Many industries need an easy and reliable way to establish the droplet size distribution (DSD) in the dispersed phase of an emulsion. At the same time, they also need to ensure that the structure of the sample is not disrupted.
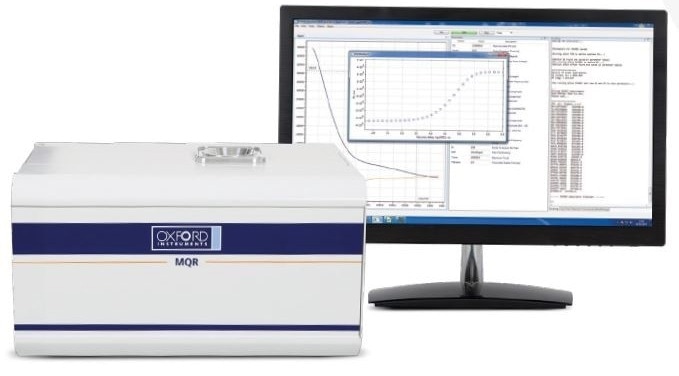
This requirement can be met by the MQR time-domain nuclear magnetic resonance (NMR) spectrometer. The technology in the NMR spectrometer offers a non-destructive approach to measure the DSD. Samples can be prepared easily, and rapid and precise results can be obtained.
The MQR offers benefits like better process control, improved consistency in manufacturing operations, a more precise and definitive formulation of the latest products, and ultimately decreased costs.
Summary
MQR - a time-domain NMR spectrometer - deals with an array of industry-specific research and development and quality control needs using reliable and established technology.
The NMR technique offers the following benefits for assessing DSD in emulsions:
- Easy sample preparation reduces damage to the structure of the sample
- It is one of the most reliable and simplest methods available today, and can be used even by unskilled staff
- Measurements can be made directly on the sample
- Eliminates the need for harmful solvents and does not produce any hazardous waste
- Non-destructive, which means the same sample can be measured a number of times
- Offers data about dimensions of droplets, and not droplet clusters
- Employs standard methods for data analysis
- Relevant to a broad range of emulsions, even if they are opaque
Application
An emulsion can be defined as a combination of two or more immiscible liquids that create a system of dispersed droplets, or dispersed phase, divided by the continuous-phase matrix.
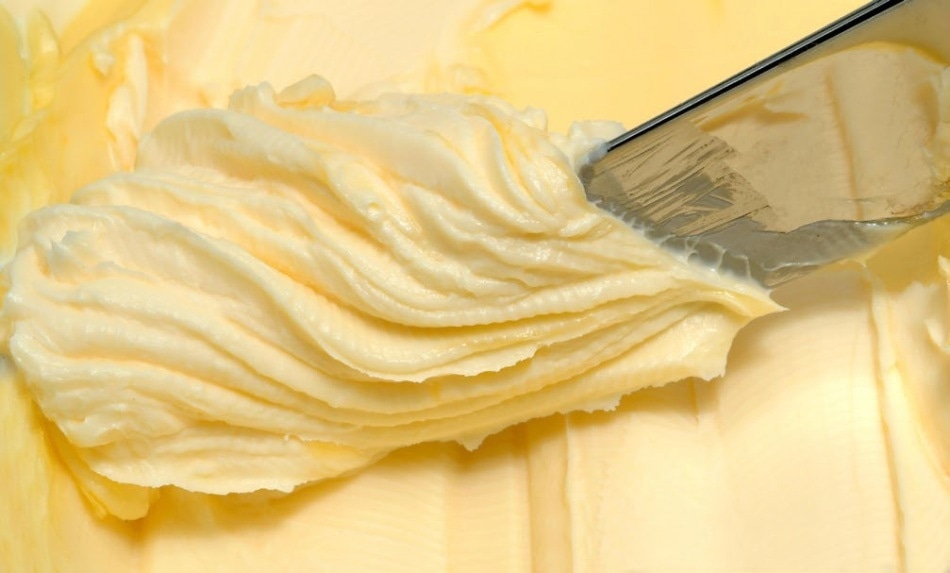
Examples of emulsion materials and products include salad dressing, mayonnaise, margarine, spreads, paints, and crude oil. Emulsions continue to be stable and maintain their structure (that is, the droplets do not coalesce) for a specific period under particular conditions.
A major feature of emulsions is the DSD. Droplet size analysis by NMR is an effective method for characterizing products at different stages of production, tracking the properties of the latest products in research and development, and also in the quality control of raw materials. By measuring the droplet size, product manufacturers and developers can realize the required characteristics of emulsions and improve their production costs.
Advantages of NMR
The NMR technique is relevant to a broad range of materials and products, and is relatively less destructive unlike other methods such as electric sensing and optical microscopy. The technique can be rapidly carried out on a sample “as is.” As a result, the structure of the sample is not significantly distorted, and the use of contrast agents, harmful solvents, or any other testing fluids is also prevented.
Hence, NMR measurements can be repeated multiple times and the same sample can be further analyzed by other methods. From a practical standpoint, non-NMR experts can routinely perform NMR measurements using easy-to-use and intuitive software that gives step-by-step instructions.
Method
The time-domain NMR technique developed for studying DSD is based on the phenomenon of limited diffusion. In limited diffusion, the effective movement of the dispersed phase molecules traveling inside the droplets is considerably lower than that of the corresponding bulk liquid. This is because of the interactions of the molecules with the droplet walls. This implies that data related to the size of droplets can be assessed from NMR diffusometry measurements.
Additionally, the raw data is obtained in the form of NMR signal diffusion decays. In the case of an emulsion sample, where dispersed and continuous phases exist, both these components create an NMR signal. If NMR data has to be collected only for the dispersed phase, the continuous phase’s signal is eliminated by applying an appropriate T1 relaxation filter. Then, a pulsed-field gradient (PFG) diffusometry protocol is performed.
To further enhance the signal selection, the temperature of the sample can be maintained at a specific value by utilizing a variable temperature NMR probe (VT probe). The effective T1 relaxation time of the continuous phase - under such conditions - is relatively shorter when compared to the relaxation time of the dispersed phase. The efficiency of the T1 filter also becomes even better. This method is employed for the DSD analysis of dairy products (that is, water-in-oil emulsions) in which the samples are determined at a temperature of 5 °C.
Four steps are involved in the measurement protocol:
Step 1: Modifying the parameters of the T1 filter to eliminate the continuous-phase NMR signal.
Step 2: Acquiring diffusion data for pure water to modify the PFG’s effective strength.
Step 3: Acquiring diffusion data for the pure dispersed phase to establish the preliminary parameters for processing data.
Step 4: Acquiring diffusion data for an emulsion sample (product). The data, which is obtained during this step, is utilized to achieve a DSD for the sample.
While Steps 1–3 are the calibration steps, Step 4 is the analysis step. If several emulsion samples comprising the same dispersed and continuous phases need to be measured, the calibration steps can be skipped.
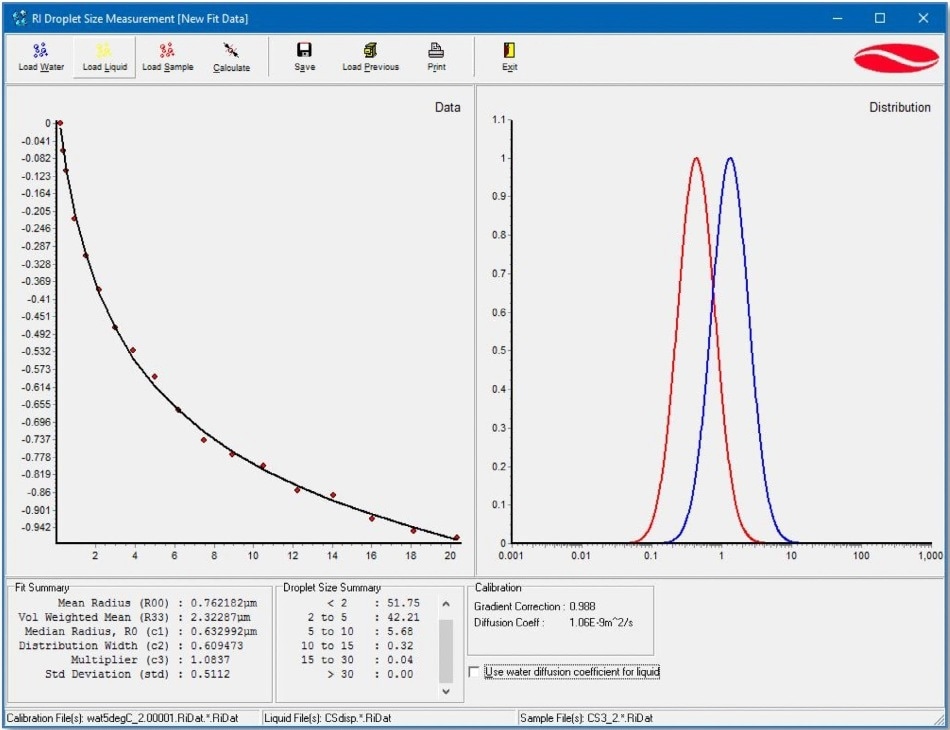
Figure 1. The droplet size distribution results obtained after the fitting of NMR diffusometry data for a butter sample. The experimental diffusion decay (•, the red solid circles) and the log-normal fitting curve ( - , the solid black line) are shown in the left-hand graph window. The volume-weighed droplet size distribution ( - , the blue curve) and the mean size distribution ( - , the red curve) are plotted in the right-hand graph. The numerical parameters of the distribution are listed in the “Fit Summary” and “Droplet Size Summary” tables below the data chart.
The data is analyzed utilizing a log-normal distribution of diffusion coefficients in an individual part of the provided software. The appropriate results are reported as a graph of the distribution function, as well as a set of the distribution function parameters (refer to the example in Figure 1) - the volume-mean radius of droplets (R33), the mean radius (R00), the distribution width (σ), the median radius R0, and the percentage of droplets with the size falling in the predefined radius ranges. Users can specify the radius ranges.
Sample Preparation
Four samples are required in the NMR method to measure the function of the DSD:
- A pure continuous phase sample (for Step 1)
- A pure deionized water sample (for Step 2)
- A pure dispersed phase sample (for Step 3)
- A set of emulsion samples or an emulsion sample made of the dispersed and continuous phases stated in (1) and (3)
Samples (1) to (4) are poured into appropriate NMR tubes up to the needed sample height. The samples should be conditioned at the preferred temperature in the VT probe of the MQR analyzer or in a conditioning block, for an appropriate period of time. With the DSD software, a time delay can be set to temper the sample before the measurement.
NB:
- Samples (1), (3), and (4) are needed for each distinct formulation of emulsion.
- Data about the proposed sample sizes as well as conditioning time is mentioned in the respective Method Sheets for probes of different sizes.
Tables 1 and 2 demonstrate that NMR offers excellent repeatability for evaluating the DSDs.

Table 1. Repeatability of NMR measurements for droplet size distribution parameters: Butter sample.
| Droplet size distribution parameters |
Repeat 1 |
Repeat 2 |
Repeat 3 |
Average value for three repeats (µm) |
Standard deviation for three repeat measurements (µm) |
| Mean radius, µm |
0.76 |
0.70 |
0.75 |
0.74 |
0.03 |
| Volume weighed mean, µm |
2.32 |
2.41 |
2.32 |
2.35 |
0.05 |
| Median radius, µm |
0.63 |
0.57 |
0.62 |
0.61 |
0.04 |
| Distribution width, µm |
0.61 |
0.64 |
0.61 |
0.62 |
0.02 |
Table 2. Repeatability of NMR measurements for content of droplets with a specific radius: Butter sample.
| Droplet radius ranges* |
Percentage of droplets with radius within the respective range (%) |
Average value for three repeats (%) |
Standard deviation for three repeat measurements (%) |
| Repeat 1 |
Repeat 2 |
Repeat 3 |
| smaller than 2 µm |
51.75 |
50.74 |
51.96 |
51.48 |
0.65 |
| from 2 to 5 µm |
42.21 |
41.87 |
41.92 |
42.00 |
0.18 |
| from 5 to 10 µm |
5.68 |
6.81 |
5.74 |
6.08 |
0.64 |
| from 10 to 15 µm |
0.32 |
0.50 |
0.34 |
0.39 |
0.10 |
| from 15 to 30 µm |
0.04 |
0.08 |
0.04 |
0.05 |
0.02 |
| larger than 30 µm |
0.00 |
0.00 |
0.00 |
0.00 |
0.00 |
*The number of the radius ranges and their numerical borders can be defined by the user.
Conclusion
The NMR method is a precise and repeatable approach for defining DSD in many different emulsions.
Samples can be prepared easily for the NMR measurements, the emulsions’ structure is not distorted, and harmful solvents or contrast (testing) additives are not needed. This means that the emulsion can be analyzed “as is.”
Since the NMR method is non-destructive, the same sample can be measured a number of times before it can be analyzed using other methods.

This information has been sourced, reviewed and adapted from materials provided by Oxford Instruments Magnetic Resonance.
For more information on this source, please visit Oxford Instruments Magnetic Resonance.