Plastics are attractive materials for a wide range of products as they can be formed into an infinite variety of shapes with different physical characteristics.
Large scale and varied usage result in a significant quantity of plastic materials, eventually ending up as waste. The scale of the plastic waste can range from large, easily handled, highly visible, and readily detectable macroplastics down to microplastic particles that may be too small to identify with normal vision. Microplastic particles are defined as particles with dimensions from 5 mm to 1 nm by the European Chemical Agency (ECHA).
The primary source of these microplastics is from sources where the plastics have been manufactured as minor particles (such as in some cleaners and cosmetic products) or as secondary products that came from the photochemical, mechanical, or thermal break down of larger plastic items.
A large number of studies on microplastics have focused on the contamination in marine environments and related aspects such as aquatic animals, seafood, and sea salt. Microplastics also appear in domestic water supplies and even in commercial products such as bottled water and other beverages.
Microplastic particle identification and detection are important for determining the possible sources of these contaminants and for understanding the health risks and environmental impact associated with the different types of materials. Efforts are ongoing to understand the full impact of these microplastics.
One of the most significant challenges with the analysis of microplastics is distinguishing microplastic particles from different types of materials and ensuring that misidentification does not lead to over-estimating the number of microplastics in a sample.
This article will focus on microplastics in a dilute water suspension, but it is recognized that there can be all types of matrices that contain microplastic particles. The particles are isolated by filtration. Post filtration, the sample consists of a group of particles on a filter and at that point the analysis requires a simple means of distinguishing and identifying microplastic particles within a field of other particles.
Two different forms of vibrational spectroscopy, Raman and FTIR spectroscopy, are widely used specifically to identify different polymeric materials. A molecular fingerprint is created from the molecular information reflected in the vibrational spectra of polymer materials. The molecular fingerprint can then be used with spectral databases to confidently identify different types of polymer materials.
Infrared and Raman spectroscopy supply spectral information that is similar but not identical. Infrared spectroscopy relies on changes in dipole moments and is principally useful for detecting polar functional groups that are found in a variety of polymer materials (amides, amines, hydroxyl, carbonyls, etc.). Raman spectra rely on a change in polarizability and are therefore useful for looking at polymer backbone structures, as well as where there are delocalized electrons such as aromatics and alkenes.
Raman spectroscopy can be more accurate with changes in molecular structures. Raman spectroscopy and Infrared spectroscopy are useful in identifying different types of polymers. However, when used together, they deliver complementary data that is more useful than either technique in isolation. Both Infrared and Raman spectroscopy can be used to analyze microscopic-sized samples. Vibrational spectroscopy is, therefore, an indispensable tool for the identification and analysis of microplastic particles.
The analysis of microplastic particles discussed within this article can be called a targeted discrete point analysis approach. In this method, a visible image is obtained from numerous fields of view through the microscope stitched together to create a visual mosaic. This visual mosaic is used to select possible particles automatically for analysis and provides information on the particle shape and size. Vibrational spectra are collected from all the targeted particles and used to identify which particles are truly microplastics.
The key input to this method is a good visual image of the particles and a filter material that has minimal spectral interferences. This method is advantageous over just collecting a Raman image of the whole filter as imaging such a large area at a reasonable resolution requires an significant amount of spectral data. If the distribution of particles on the filter is relatively sparse then the bulk of the spectral data will show only the filter and no particles.
Experimental
A commercially available 500 ml bottle of drinking water was the sample used during this study. The drinking water was filtered using the Thermo Scientific™ Microparticle Sample Preparation Kit. The kit comprises of a 10mm x 10mm silicon filter which can be used for transmission FTIR analysis, reflection FTIR analysis, or Raman analysis of the isolated particles.
The silicon filters were then examined using both a Thermo Scientific™ DXR2 Raman Microscope and a Thermo Scientific™ Nicolet™ iN10 MX FTIR Imaging Microscope. Both of these tools use software options specifically designed for automated particle analysis. The Nicolet iN10 MX FTIR Imaging Microscope uses the Particle Wizard option in the Thermo Scientific™ OMNIC™ Picta™ Software, and the DXR2 Raman Microscope uses the Particle Analysis option that is part of the Thermo Scientific™ Omnic™ Atlus Software and the Thermo Scientific™ Omnic™ for Dispersive Raman Software.
The analysis was completed using the iN10 MX FTIR Imaging Microscope in transmission mode while using an MCT A detector and 64 scans per spectrum. An area clear of particles near the center of the silicon filter was selected as the background position. The Particle Wizard routine automatically selected apertures based on the particle size. The number of potential particles was established from image analysis of the visible mosaic image and refined through adjustments in the sensitivity and particle size parameters.
Analysis using the DXR2 Raman Microscope was completed using a 532 nm laser and 10X objective. Each spectrum was collected using a 2s exposure and ten exposures.
The number of potential particles was selected using the Particle Analysis routine, and similarly to the iN10 MX FTIR Imaging Microscope, analysis was based on an image analysis of the visual mosaic along with size and sensitivity parameters.
Results and Discussion
The workflows using both the DXR2 Raman and iN10 MX FTIR Imaging Microscopes are very comparable. In both approaches, the analysis begins with defining and collecting a visual mosaic of the area on the silicon filter containing the particles filtered from the drinking water. Subsequently, image analysis of the visible mosaic is used to select possible particles. This analysis interrogates the contrast in the image, and the sensitivity can be adjusted to determine what visual features are selected as particles. A filter can be used to select what sizes of particles are chosen for analysis. These parameters help determine the number of potential particles selected for spectroscopic analysis.
The process of particle selection using the Particle Wizard software in Picta Software with an iN10 MX FTIR Imaging Microscope and a silicon filter with particles filtered from bottled drinking water is shown in Figure 1.
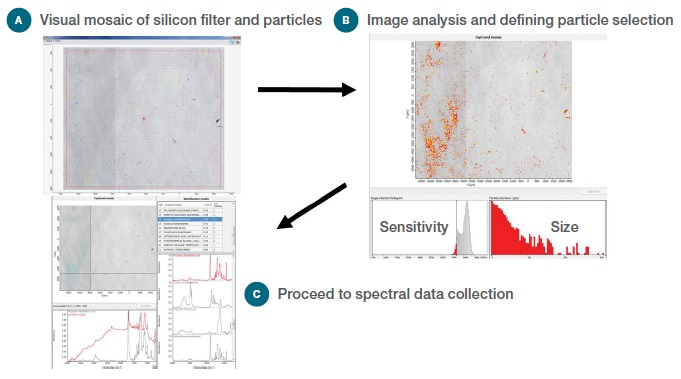
Figure 1. Workflow for particle analysis: (a) Visual Image, (b) Selecting potential particles, (c) Collect spectral data and report results.
The next step, once all the possible particles have been selected, is to collect spectral data to identify the microplastic particles. Not all the features visually identified as particles are actually particles. They could be misidentified due to scratches or discoloration of the filter, or other visual differences that are not different materials. It is also possible to have particles that are mineral or biologically-based.
While interesting, these types of particles are not the objective of this analysis. Some particle materials such as metals would not be either Raman or infrared active and, therefore, would not provide a vibrational spectrum. The reality is only a small portion of the features are microplastics, and the purpose of the analysis is to reveal these particles.
Once the spectral data is collected, the spectra are compared to spectral databases to identify matches and isolate the particles. A summary of the quantity and type of each particle is included in the analysis report, along with the spectra from the individual particles and the dimensions of the particles.
The analysis reports can be exported as text documents, which can be incorporated into other software programs or can be outputted in an electronic format or hard copy printed. A summary of the identified microplastic particles from the silicon filter both for the FTIR and Raman analysis is shown in Table 1.
Table 1. Summary of the microplastic particles identified on the silicon filter by both the FTIR analysis and Raman analysis.
| |
FTIR
(total particles – 801) |
Raman
(total particles – 1065) |
| PTFE |
5 |
9 |
| Polyester (PET) |
3 |
3 |
| Polystyrene |
0 |
3 |
| Polypropylene |
3 |
3 |
| Unspecific long chain aliphatic hydrocarbon containing materials |
2 |
1 |
| Polyethylene |
2 |
1 |
The particles’ size was approximately 10–200 microns. Length and width information is provided for each particle in the full report. Figure 2 shows an example of a particle from the Raman analysis. The figure shows a polypropylene fiber approximately 78 microns long and 16 microns wide.
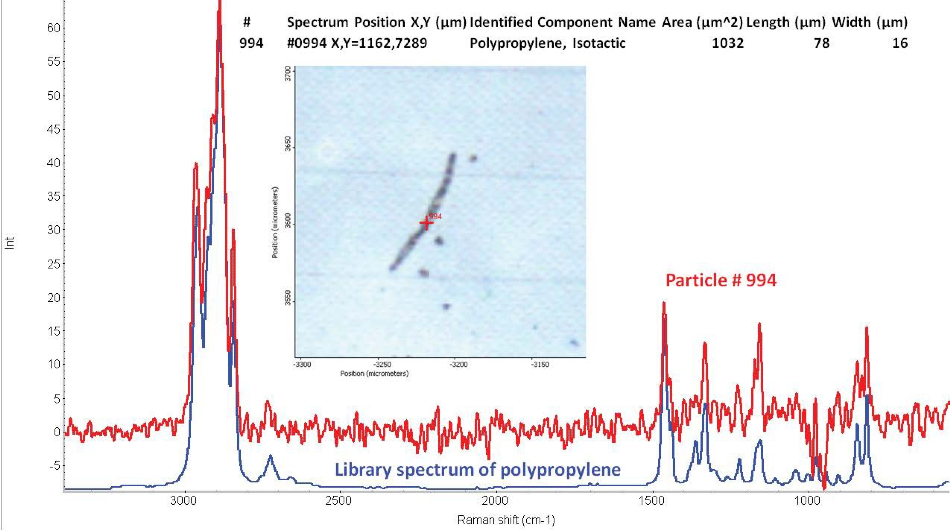
Figure 2. Example of a microplastic particle from the Raman particle analysis of the silicon filter. The particle is a small polypropylene fiber approximately 78 microns long and 16 microns wide. The Raman spectrum of the fiber matches a library spectrum of polypropylene.
While the Raman and FTIR analysis did not identify precisely the same quantity of microplastic particles, the majority of the materials were determined to be the same. The differing results can be justified by the differences in the selection rules, the differences in the spatial resolution, and the way the spectral data is collected. Some materials tend to be better suited to identification by one of the techniques. A combination of the two techniques is advantageous for optimizing the analysis of a wider range of particles.
As previously highlighted, only a small number of the potential particles are actually microplastics. Other materials such as minerals (titanium dioxide, quartz, and talc) and biological-based materials (protein, cellulose, and beta-carotene) were also identified. The majority of the features selected by the image analysis routine were not identified.
A significant proportion of these were simply visual features that did not represent real particles. Some of these were from materials that are not Raman or FTIR active. No features beyond those associated with the filter itself are shown by the spectra from these areas. However, the fact that these other materials are not clearly defined does not matter for this application, given that the goal was to identify microplastics particles.
The collection of spectral data from particles that are not microplastics might be seen as slowing down the analysis. However, the arduous and involved task of separating microplastics from non-microplastic particles does not require manual subjective visual sorting due to the fact that the data collection and most of the analysis is automated. This process, therefore, saves working hours.
Summary
Microplastics have been found in a wide range of locations, from sea life to food and beverages. The majority of microplastics are likely to be biologically benign. However, given the scope of the distributions and the large quantity of these materials, it is important to understand the total impact.
With this in mind, it is important to be able to isolate, detect, and identify microplastic particles. An isolation technique needs to be selected for spectroscopic analysis that allows for subsequent spectroscopic analysis. Silicon-based filters were found to provide certain advantages for both FTIR and Raman analysis.
Access to molecular information is provided by vibrational spectroscopy and is able to identify a wide variety of materials, including polymeric materials. Analysis of microscopic particles can be carried out with micro-spectroscopy. Infrared and Raman spectroscopy both provide molecular structure information, but each excels at identifying different aspects of polymer materials. Where one is weak, the other is strong, and so, together, they provide exceptional coverage in the identification of a wide variety of different materials.

This information has been sourced, reviewed and adapted from materials provided by Thermo Fisher Scientific – Materials & Structural Analysis.
For more information on this source, please visit Thermo Fisher Scientific – Materials & Structural Analysis.