The recent Thermo Scientific™ NanoDrop QC™ Software for the Thermo Scientific™ NanoDrop™ OneC Microvolume UV-Vis Spectrophotometer enables scientists to carry out chemometric analysis of high absorbance chemical samples in real-time with no requirement for dilution.
This article provides a step-by-step process for devising and validating a chemometric method that can determine dye concentrations in a complex mixture.
The article will also demonstrate how NanoDrop QC Software can be employed to acquire quantitative data in samples that have several components with UV-Vis spectra that significantly overlap.
The technique produced by Thermo Fisher Scientific identifies the distinct concentrations of sunset yellow and tartrazine in mixtures comprising various ratios of each component and calculates the percentage of the two dyes in the mixture.
NanoDrop QC Software for the NanoDrop OneC Spectrophotometer makes the patented microvolume measurement platform applicable to an extensive range of industries, including food dye producers, petrochemical companies, and polymer manufacturers which require an efficient and precise method for evaluating the quality of samples.

Thermo Scientific NanoDrop Onec Microvolume UV-Vis Spectrophotometer.
Introduction
Ultraviolet-visible (UV-Vis) spectroscopy is an analytical method that is commonly utilized to gain quantitative data about chemical species. This is due to its affordability, efficiency, and precision.
Where the wavelength-dependent extinction coefficient is known in pure chemical samples, Beer’s Law can be utilized to determine the concentration.
A known disadvantage of Beer’s Law is that it can only offer precise results for samples which include no other chemical species with overlapping absorbance at the analytical wavelength.1 Chemometrics is frequently utilized to investigate UV-Vis data from complex chemical samples (such as mixtures).
Relevant chemical system information can be provided by chemometrics through the analysis of measured chemical data.2 It offers an effective approach for identifying the concentration of chemical species that have overlapping spectra.
Chemometrics is the use of a range of statistical methods and multivariate mathematical models to calculate the quantitative concentration data of several components at the same time.3
The advanced nature of the multivariate calibration models employed in chemometrics has restricted its use to individuals with a strong understanding of the discipline. The majority of data analysis is performed by a knowledgeable chemometrics expert once the data has been acquired.
Effective chemometric analysis and the NanoDrop OneC’s microvolume measurement platform are combined in the NanoDrop QC Software. The measurement platform uses an innovative sample retention technology, where the surface tension between two fiber optic cables is employed to keep 1 to 2 μL samples in place (Figure 1).4
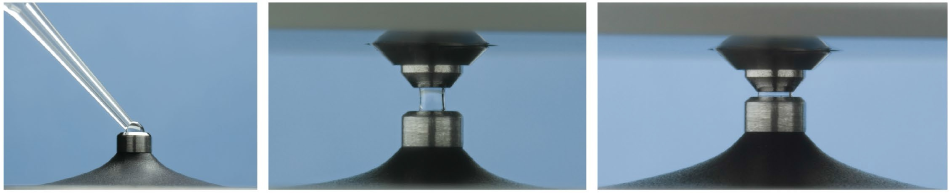
Figure 1. NanoDrop Microvolume Sampling platform Left: Loading of a 1 μL sample on the measurement pedestal Middle: Sample measurement at 1 mm pathlength Right: Sample measurement at 0.2 mm.
Several pathlengths (1.0 mm, 0.2 mm, 0.1 mm, 0.05 mm and 0.03 mm) are also utilized in the measurement platform. They adjust in real-time during sample measurement which produces a broad dynamic range that extends from 0.04 to 550 absorbance units (10 mm equivalent absorbance units).
These features make the instrument’s platform well suited to a range of different industrial applications, for example, industrial dye analysis, polymer QA/QC, petrochemical analysis, and additional material science applications.
To demonstrate the efficacy of the NanoDrop QC Software in executing real-time chemometric investigation, two common dyes (sunset yellow and tartrazine) were combined and a multivariate calibration model was constructed to identify each component’s concentration and the percentage of each component’s composition in the mixture.
Dyes were selected with highly overlapping UV-Vis absorption spectra in order to show the relevancy of this technique. The production and verification of the chemometric technique will also be outlined.
Materials and Methods
An experimental system was produced with mixtures of two water-soluble azo dyes, sunset yellow and tartrazine, to show the effectiveness of the chemometric analysis run on the microvolume UV-Vis platform by Thermo Fisher Scientific.
The two dyes were selected for the experimental framework as large regions of their spectra overlap. Sunset yellow has three peaks inside of the UV-Vis region (238 nm, 315 nm, 476 nm) whereas Tartrazine has two distinct peaks residing within the UV-Vis spectrum (259 nm, 425 nm) (Figure 2).
.
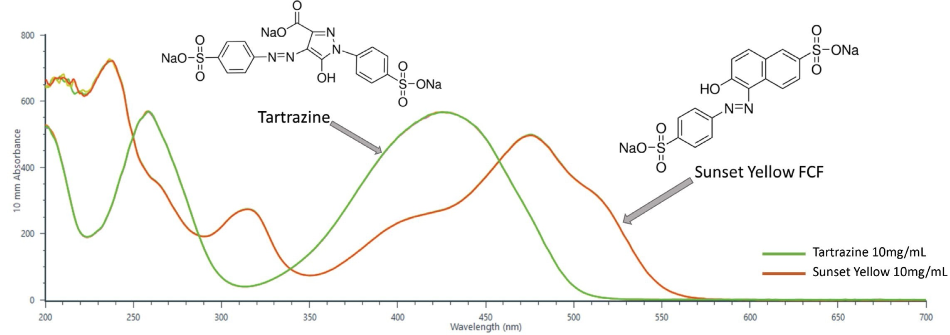
Figure 2. Full UV-Vis spectra of pure tartrazine and sunset yellow (200 nm – 700 nm). Spectra were collected with the UV-Vis module of the NanoDrop QC Software and was baseline corrected at 800 nm. Solutions of each dye were prepared at 10 mg/mL and 2 µL aliquots were measured on the instrument.
The concentrations of each dye selected for these experiments were high enough so that it would be unachievable to quantitatively establish the concentration of each dye in the mixture when employing standard spectroscopy techniques (such as measurements in cuvettes and Beer’s Law).
Experimental Flow Chart
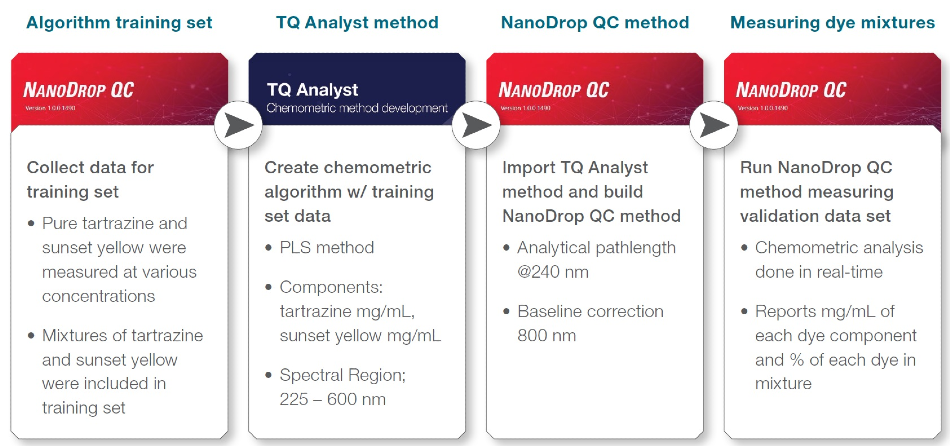
Figure 3. Experimental steps followed to create and test a NanoDrop QC chemometric method to determine tartrazine and sunset yellow dye concentration in a mixture.
Algorithm Training Set
Table 1 shows the training set samples that were devised to produce the chemometric method and to establish the concentrations of sunset yellow and tartrazine dye in a mixture.
The 100 mg/mL dye solutions were serially diluted in ddH2O: 10 mg/mL, 2.5 mg/mL, and 0.5 mg/mL to create the following stocks. Suitable volumes of each stock were pipetted to provide 100 µL of dye mixtures.
2 µL aliquots were then quantified with NanoDrop QC Software utilizing the UV-Vis application. Pathlength control was configured to an analytical wavelength at 240 nm and baseline correction was carried out at 800 nm. Three replicates were run for every sample.
Table 1. Samples created for the chemometric algorithm training set. The training data set consisted of randomly determined mixtures of tartrazine and sunset yellow. The concentration range spanned from 0 mg/mL to 10 mg/mL.
| Mixture training set |
| Training set sample # |
Description |
Tartrazine
(mg/mL) |
Sunset yellow
(mg/mL) |
| 1 |
Mixture |
7.46 |
2.54 |
| 2 |
Mixture |
0.38 |
9.62 |
| 3 |
Mixture |
5.92 |
4.08 |
| 4 |
Mixture |
2.43 |
7.57 |
| 5 |
Mixture |
8.00 |
2.00 |
| 6 |
Mixture |
3.74 |
6.26 |
| 7 |
Mixture |
5.22 |
4.78 |
| 8 |
Mixture |
2.07 |
0.43 |
| 9 |
Mixture |
0.42 |
2.08 |
| 10 |
Mixture |
1.61 |
0.89 |
| 11 |
Mixture |
1.88 |
0.62 |
| 12 |
Mixture |
1.03 |
1.47 |
| 13 |
Mixture |
1.54 |
0.96 |
| 14 |
Mixture |
0.09 |
0.41 |
| 15 |
Pure |
0.00 |
0.50 |
| 16 |
Mixture |
0.19 |
0.31 |
| 17 |
Mixture |
0.15 |
0.35 |
| 18 |
Mixture |
0.36 |
0.14 |
| 19 |
Mixture |
0.22 |
0.28 |
TQ Analyst Method
The training set information was imported into the Thermo Scientific™ TQ Analyst™ Software and a partial least squares (PLS) technique was created. The spectral region from 225 nm to 600 nm with a baseline correction at 800 nm was utilized to produce the calibration.
No additional spectral processing was carried out on the data. The two components employed were sunset yellow concentration (mg/mL) and tartrazine concentration (mg/mL).
Two composite calculations were also devised to determine the composition percentage, for example, the percentage of tartrazine and the percentage of sunset yellow.
The technique utilizes three factors to identify the concentration of tartrazine and four factors to identify the concentration of sunset yellow.
NanoDrop QC method
To produce a NanoDrop QC method, the TQ method outlined above was imported into the NanoDrop QC Software. The analytical wavelength of 240 nm was chosen to select the optimal pathlength for the measurement result.
Method Validation
Measuring Dye Mixtures
Table 2 outlines the validation samples produced for the validation of the technique created. The stocks in Table 2 were produced by serially diluting 100 mg/mL dye solutions in ddH2O to acquire 0.5 mg/mL, 1.0 mg/mL, 2.5 mg/mL, 5 mg/mL, and 10 mg/mL stocks.
Sufficient volumes of each stock were pipetted to provide 100 µL of either dye mixtures or pure dye samples. 2 µL aliquots were then quantified on the NanoDrop OneC instrument with the application of the chemometric method. Pathlength control was configured to the analytical wavelength of 240 nm.
Three replicates were run for all samples. The expected (Table 2) and measured concentrations of each dye in the mixtures were compared to verify the accuracy of the chemometric technique.
Table 2. Samples created to validate the chemometric method described above. Samples spanned the concentration range from 0 mg/mL to 8.21 mg/mL.
| Validation samples |
| Validation sample # |
Description |
Tartrazine
(mg/mL) |
Sunset yellow
(mg/mL) |
| 1 |
Mixture |
4.19 |
5.81 |
| 2 |
Mixture |
1.79 |
8.21 |
| 3 |
Mixture |
5.17 |
4.83 |
| 4 |
Pure sunset yellow |
0.00 |
5.00 |
| 5 |
Mixture |
1.34 |
3.66 |
| 6 |
Mixture |
4.59 |
0.41 |
| 7 |
Mixture |
0.32 |
2.18 |
| 8 |
Mixture |
1.61 |
0.89 |
| 9 |
Mixture |
1.91 |
0.59 |
| 10 |
Mixture |
0.39 |
0.61 |
| 11 |
Pure tartrazine |
1.00 |
0.00 |
| 12 |
Mixture |
0.30 |
0.20 |
| 13 |
Mixture |
0.25 |
0.25 |
| 14 |
Mixture |
0.31 |
0.19 |
Results
Nanodrop QC Software enabled the team to run samples and carry out a chemometric investigation in real-time. Figure 4 demonstrates how the data is visualized by the software.
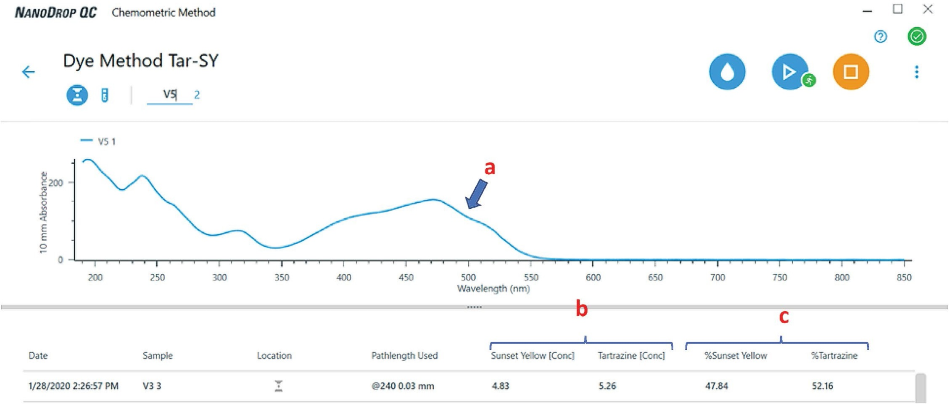
Figure 4. View of the chemometric method application contained within the NanoDrop QC Software. Note that the component (dye concentration) and composite results are reported directly on the screen in real-time. There is no need to perform any post-run data processing. For each mixture, the software displays (a) the spectrum of the mixture and (b) the concentration and (c) % composition of each dye in that mixture.
The predicted dye concentrations and the calculated concentrations for the 14 dye mixtures closely match (Figures 5 and 6). The validation samples covered a broad concentration range (0 mg/mL to 8.21 mg/mL) which enabled the complete range of dye concentrations employed in the training set to be evaluated.
In each case (Figures 5 and 6), the chemometric prediction for the highest concentrations of dye exhibited the most significant discrepancies. When comparing the sunset yellow results to the tartrazine results, sunset yellow had a higher instance of predictive error.
The variation observed between the expected concentration and reported concentration still only ranged from 0.04 mg/mL to 0.28 mg/mL.
The discrepancies outlined above highlighted the significance of validating chemometric techniques by evaluating the performance of the algorithms with independently generated samples.
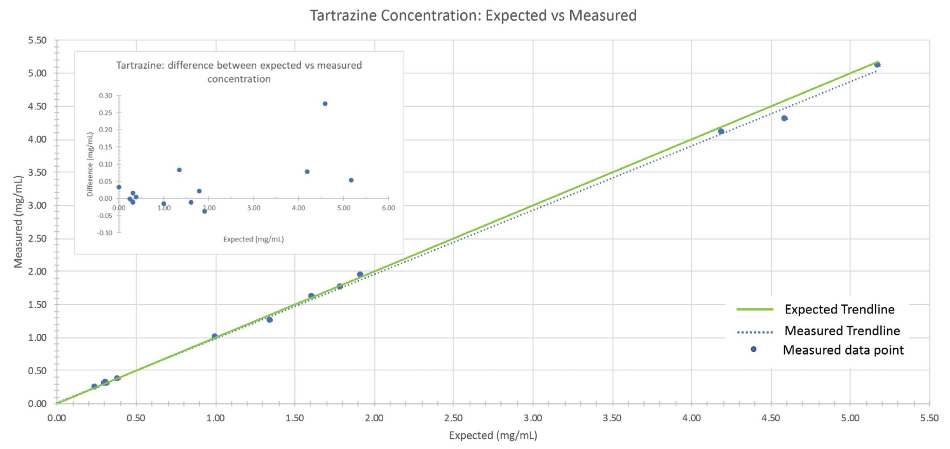
Figure 5: Comparison between expected vs. measured tartrazine concentration of the validation sample set. The green line represents the trendline when expected concentrations are plotted against themselves (i.e., measured values perfectly match expected values). The dotted blue line is the observed trendline when the measured concentrations are plotted against the expected concentrations.
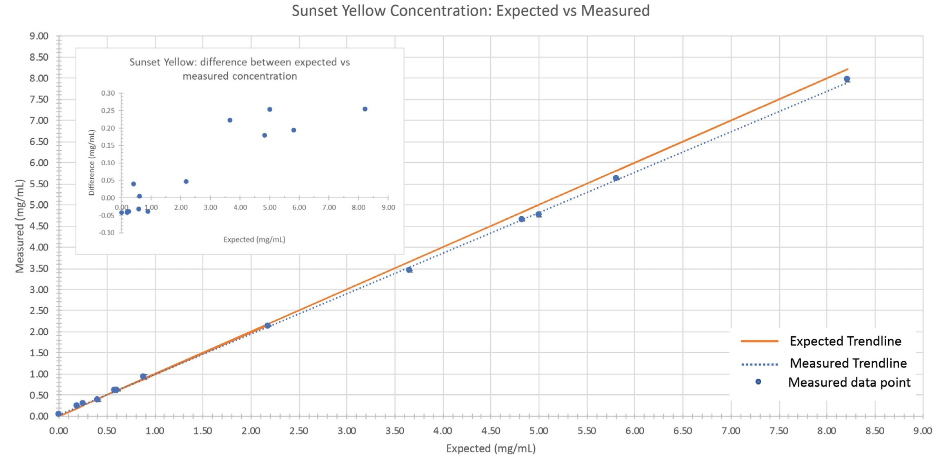
Figure 6: Comparison between expected vs. measured sunset yellow concentration of the validation sample set. The orange line represents the trendline when expected concentrations are plotted against themselves (i.e., measured values perfectly match expected values). The dotted blue line is the observed trendline when the measured concentrations are plotted against the expected concentrations.
Conclusion
NanoDrop QC Software in combination with the NanoDrop OneC microvolume sampling platform provides many benefits to scientists, such as the ability to:
- Quantify samples that are highly absorbing (> 500 A) with no requirement for specialized flow cells, specialized short-pathlength cuvettes, or carrying out time-intensive dilutions.
- Offer complete UV-Vis spectral information in a measurement that lasts 10 seconds (1,300 data points).
- Perform real-time chemometric analysis to make data processing tasks more streamlined.
Chemometric analysis was created and performed on a range of mixtures including highly concentrated dyes.
The wide applicability of UV-Vis measurements combined with chemometric analysis is a highly beneficial solution for a varied range of applications such as drug purity,5 petrochemical chemical analysis, food dye applications, polymer manufacturing, and a host of other applications that require chemometric analysis.
References and Further Reading
- Olivieri A, Faber N, Ferré J, et al. Uncertainty estimation and figures of merit for multivariate calibration (IUPAC Technical Report). Pure and Applied Chemistry 2009;78(3): pp. 633 – 661.
- Wold S. Chemometrics; what do we mean with it, and what do we want from it? Vol. 30, Chemometrics and Intelligent Laboratory Systems. Elsevier; 1995. p. 109 – 15.
- Kramer R. Chapter 2: Basic Approach. Chemometric techniques for quantitative analysis. Marcel Dekker; 1998.
- Desjardins P, Conklin D. NanoDrop microvolume quantitation of nucleic acids. Journal of visualized experiments: JoVE. Journal of Visualized Experiments 2010.
- Biancolillo A, Marini F. Chemometric Methods for Spectroscopy-Based Pharmaceutical Analysis. Frontiers in Chemistry 2018; 6:576.
Acknowledgments
- Produced from materials originally authored by Brian Matlock from Thermo Fisher Scientific.

This information has been sourced, reviewed and adapted from materials provided by Thermo Fisher Scientific – Materials & Structural Analysis.
For more information on this source, please visit Thermo Fisher Scientific – Materials & Structural Analysis.