All food products should be of high quality and purity, not only for consumer safety, but also to ensure product authenticity and label accuracy. This is especially significant for olive oils, which come in a variety of grade levels.
In some cases, high-quality olive oils may be contaminated with lower-grade olive oils or oils from other sources, such as canola or soybean. Ensuring the overall quality and stability of commercially available olive oil is essential to prevent unwanted changes in flavor, aroma, and texture.1,2,3
As a result, comprehensive testing of olive oil products is required to ensure that they are free of undesirable adulterants and byproducts. The International Olive Council (IOC) explains the tests that can be performed to ensure the purity of various types of olive oil, as well as the passing standards.4
One such method is UV-Visible absorption spectroscopy, a non-destructive analytical technique that measures the transmission of UV-Visible light through a sample.
Absorbance is calculated as the ratio of the transmitted light intensity to the initial intensity of the light before it interacts with the substance. This approach produces data particular to the analyte since its ability to absorb light is determined by its electronic structure.
In addition, Beer's law demonstrates that absorbance is directly proportional to an analyte's concentration in a medium. As a result, this methodology is frequently employed as a quantification tool.
UV-Visible absorption spectroscopy has been used to measure several analytes in olive oil samples, such as chlorophyll and carotenoids. The IOC technique assesses the level of oxidation in olive oil by measuring the absorbance of conjugated dienes/trienes.2,3,6
The oxidation of olive oils can cause flavor changes, resulting in a worse product quality.3 In IOC's approach, the "specific extinction" (K), the extinction coefficient of a 1% w/v oil solution in either cyclohexane or iso-octane, is calculated at two wavelengths to assess the levels of these oxidation byproducts present.6
IOC acceptance standards indicate that different types of olive oils may have varying values and attributes. This IOC process for assessing olive oil purity was presented utilizing a Thermo Scientific™ Evolution™ One Plus UV-Visible Spectrophotometer.
This section contains the results for four olive oil samples of varying quality and the results for a canola oil sample. Thermo Scientific™ Insight™ Pro Software's sophisticated calculations function met IOC's standards.6
These findings show how easily UV-Visible absorption assays can determine the extent to which olive oil samples have been damaged.
Experimental
Experiments were conducted with commercial oil samples. Table 1 describes these samples and the substances listed on the label, which are illustrated in Figure 1. Samples were prepared using the protocols indicated in the IOC method.6
To prepare a ~1 g/100 mL stock solution, each oil sample was dissolved in cyclohexane (Table 1). Diluted oil samples were created by diluting 0.5 mL of the produced stock solution with 2.0 mL of cyclohexane.
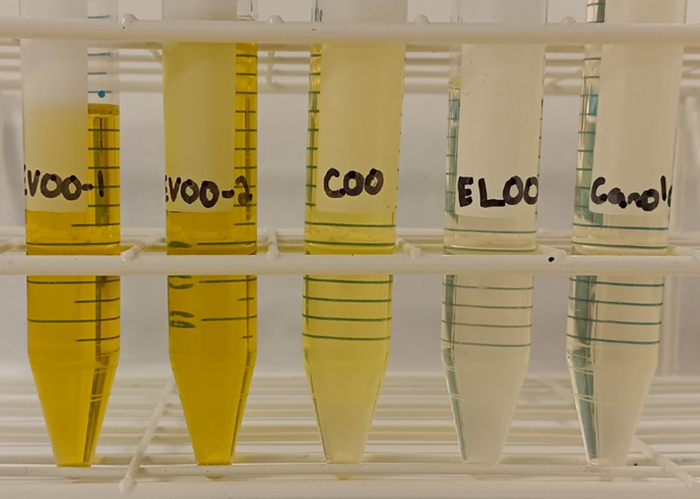
Figure 1. Olive oil samples. From left to right: EVOO-1, EVOO-2, COO, ELOO, Canola Oil. Image Credit: Thermo Fisher Scientific – Production Process & Analytics
Table 1. Description of ingredients of olive oil samples as well as concentration of prepared stock solutions. Source: Thermo Fisher Scientific – Production Process & Analytics
Labeled
Oil Sample |
Ingredients
on Label |
Prepared Stock
Concentration
(g/100 mL) |
Diluted
Concentration
(g/100 mL) |
Extra Virgin Olive Oil
– Brand 1 (EVOO-1) |
Extra Virgin
Olive Oil |
1.07 |
0.215 |
Extra Virgin Olive Oil
– Brand 2 (EVOO-2) |
Extra Virgin
Olive Oil |
1.04 |
0.208 |
Classic Olive
Oil (COO) |
Refined Olive
Oil and
Virgin Olive Oil |
1.00 |
0.200 |
Extra Light
Olive Oil (ELOO) |
Refined Olive
Oil and
Virgin Olive Oil |
1.02 |
0.204 |
| Canola Oil |
Canola Oil |
1.00 |
0.201 |
The UV-Visible absorption spectra of the stock solutions and diluted oil samples were measured using an Evolution One Plus UV-Visible spectrophotometer. Each sample was placed in a 1.0 cm quartz cuvette. The absorbance at 232, 266, 270, and 274 nm was measured with a 1.0 nm bandwidth and 1.0 s integration time.
Results/Discussion
When employing cyclohexane as a solvent, the absorbance at 232 nm and 270 nm must be measured according to IOC guidelines.6
The former wavelength measures the presence of primary oxidation products such as peroxides, whereas the latter measures the amount of secondary oxidation products present (e.g., ketones, trienes, etc.).2,3
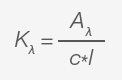
According to Beer's law (Eqn. 1), the absorbance measured is proportional to the analyte concentration and the route length through which the light travels.
This can make comparing samples with different concentrations challenging. The extinction coefficient (ελ) is a constant number specific to the analyte of interest, making it a convenient point of comparison.
To analyze oxidation products in oil, use Equation 2 to calculate the specific extinction coefficient (Kλ) of a 1% oil solution in iso-octane or cyclohexane.
 |
Equation 2. |
[Eqn. 2] where c is the concentration of oil solution (g/100 mL) and l is the pathlength. IOC's sample purity test requires variance in the specific extinction coefficient (ΔK).6
As indicated in Equation 3, this variance is only obtained for the absorbance at 270 nm (cyclohexane) or 268 nm (iso-octane).
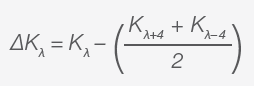 |
Equation 3. |
Table 2. Passing criteria for select olive oil types. Source: Thermo Fisher Scientific – Production Process & Analytics
| Oil Type |
*K232 nm |
K270 nm |
ΔK270 nm |
| Extra Virgin Olive Oil |
≤ 2.5 |
≤ 0.22 |
≤ 0.01 |
| Refined Olive Oil + Virgin Olive Oil |
N/A |
≤ 1.15 |
≤ 0.15 |
Table 2 shows acceptable limits for K232 nm, K270 nm, and ΔK270 nm in extra virgin olive oil and a blend of refined and virgin olive oils, as defined by IOC. These restrictions are far more stringent for extra virgin olive oil than for the olive oil mixture.
The latter product is predicted to be of lesser quality and so contain a higher concentration of oxidation products than the former. Table 3 shows the computed K232 nm, K270 nm, and ΔK270 nm values for five distinct oil samples.
These calculations were performed using the advanced calculations capabilities, as shown in Figure 2. Figure 2 also includes pass/fail checks to ensure the estimated values are within acceptable ranges.
Table 3. Calculated K for measured oil samples. Source: Thermo Fisher Scientific – Production Process & Analytics
| Sample Type |
*K232 nm |
K270 nm |
ΔK270 nm |
| EVOO-1 |
2.21 |
0.15 |
0.001 |
| EVOO-2 |
2.40 |
0.15 |
0.004 |
| COO |
2.44 |
0.45 |
0.029 |
| ELOO |
2.30 |
0.57 |
0.043 |
| Canola Oil |
3.52 |
0.79 |
0.023 |
* Calculations carried out using absorbance at 232 nm of diluted samples as per the experimental section.
According to the computed specific extinction coefficients (Table 3), both extra virgin olive oil samples fall within the limits stated in Table 2, implying that they have not been oxidized beyond the allowable range.
The COO and ELOO samples, which are blends of refined and virgin olive oil, meet the K232 nm criterion for extra virgin olive oil; however, the specific extinction coefficient seen at 270 nm does not meet extra virgin olive oil standards.
If the ELOO and COO samples were manufactured like the EVOO-1 and EVOO-2 samples, these standards would deem them overly oxidized.
The computed K270 nm and ΔK270 nm values are within the expected limits for blends of refined and virgin olive oils. This indicates that the samples do not include more than the allowed concentration of oxidized byproducts.
The canola oil sample, which contains no olive oil, fails to meet the standards for extra virgin olive oil as expected. However, it can meet the standards for K270 nm and ΔK270 nm for refined/virgin olive oil.
Because there should be no olive oil in these samples, these findings demonstrate that this assay cannot be used to identify the kind of oil present. Extra testing is required to determine the type of olive oil or detect the presence of oil from another oil, such as canola. Chromatographic methods are presented to identify extraneous oils based on IOC.7
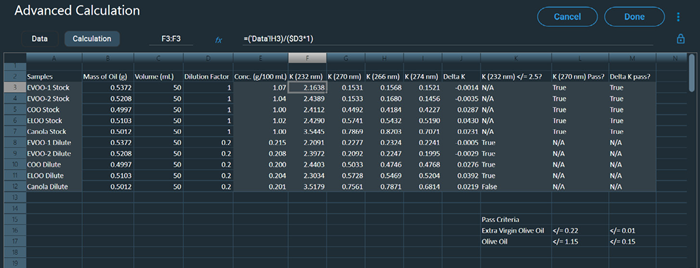
Figure 2. Advanced calculations function in the Insight Pro software for the analysis of various oil samples. Image Credit: Thermo Fisher Scientific – Production Process & Analytics
Conclusions
The results demonstrate how easily UV-Visible techniques, following IOC guidelines, can be used to assess olive oil purity.
While further testing is needed to confirm overall quality and authenticity, the ability to detect oxidation products through non-destructive analysis underscores the value of this approach for quality control.
The Evolution One Plus spectrophotometer, along with Insight Pro software, streamlines the process, handling calculations and pass/fail assessments, making it a practical tool for routine quality inspections.
References
- TorrecillaJ.S., et al. (2010). A Novel Method To Quantify the Adulteration of Extra Virgin Olive Oil with Low-Grade Olive Oils by UV−Vis. Journal of Agricultural and Food Chemistry, 58(3), pp.1679–1684.https://doi.org/10.1021/jf903308u.
- Tarapoulouzi, M., et al. (2022). Recent Advances in Analytical Methods for the Detection of Olive Oil Oxidation Status during Storage along with Chemometrics, Authenticity and Fraud Studies. Biomolecules, 12(9), p.1180. https://doi.org/10.3390/biom12091180.
- Gargouri, B., Zribi, A. and Bouaziz, M. (2014). Effect of containers on the quality of Chemlali olive oil during storage. Journal of Food Science and Technology, (online) 52(4), pp.1948–1959. https://doi.org/10.1007/s13197-014-1273-2.
- International Olive Council, Trade Standard Applying to Olive Oils and Olive Pomace Oils, 2019, COI/T.15/NC No 3/Rev. 13.
- Jolayemi, O.S., Tokatli, F. and Ozen, B. (2021). UV–Vis spectroscopy for the estimation of variety and chemical parameters of olive oils. Journal of Food Measurement and Characterization, 15(5), pp.4138–4149. https://doi.org/10.1007/s11694-021-00986-8.
- International Olive Council, Method of Analysis Spectrophotometric Investigation in the Ultraviolet, 2019, COI/T.20/Doc. No 19/Rev. 5.
- International Olive Council, Global Method for the Detection of Extraneous Oils in Olive Oil, 2013, COI/T.20/Doc. No 25/Rev. 1

This information has been sourced, reviewed and adapted from materials provided by Thermo Fisher Scientific – Production Process & Analytics.
For more information on this source, please visit Thermo Fisher Scientific – Production Process & Analytics.