Within this experiment, the award-winning K-Alpha X-ray Photoelectron Spectrometer (XPS) System from Thermo Scientific was employed to investigate two different samples of printed paper.
One of the samples was printed with a laser printer, while the other was printed with an inkjet printer. XPS was utilized to discover chemical differences between the two surfaces, as well as differences between shades of ink from the same printer.
Introduction
Printing applications make use of a number of surface processes. These include the distribution of ink (via nozzle or some other form of dosing mechanism), the application of ink via cylinder or plate, and lastly the interaction between the ink and the media’s surface.
On occasions where the surface interaction between the printing head and the ink is not ideal, the print may be smeared or the print head can become clogged. Where the substrate’s surface is not uniform, the print may look mottled, patchy, or flaky.
In most cases, these failures are caused by the surface chemistry deviating away from that which is expected. This deviation may be subtle, possibly even a small change in the composition at the surface in relation to the bulk, or this may be a significant change such as the introduction of a contaminant during manufacturing.
In either case, the surface must be characterized for both elemental and chemical information.
The K-Alpha™ X-ray Photoelectron Spectrometer (XPS) System from Thermo Scientific™ provides a straightforward means of characterizing these types of samples. The system is capable of analyzing both conducting and insulating samples, and does not need any special sample preparation steps, so long as the sample is vacuum-compatible.
Experiment
Identical graphics were printed onto samples of standard copier paper using inkjet and laser printers. Spectra were collected from both the unprinted paper and from areas printed black or red.
The K-Alpha XPS System offers increased sensitivity, allowing data to be collected in a significantly reduced timeframe in comparison with the original instrument, and with no loss in spectral quality.
Because the samples were insulating, the K-Alpha turnkey charge compensation system was employed. This system is easy to use, requiring no user intervention to maintain consistent analysis conditions across the whole sample set.
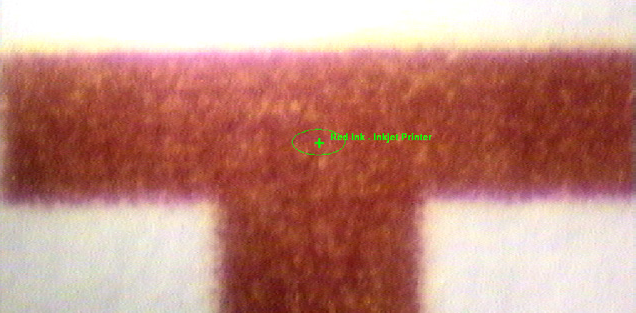
Figure 1. Optical image of one of the samples in the K-Alpha XPS System. The analysis area is defined by the size of the X-ray spot, shown as an ellipse on the image.
Figure 1 displays an optical image of one of the samples, shown in the spectrometer’s analysis position. An elliptical marker is superimposed on this image, highlighting the analysis area’s size and position.
Results
Figures 2 to 5 display the results of the analysis. Figure 2 includes survey spectra from both the paper and areas printed in black ink from both printers. Survey spectra are commonly used to show elemental information from the surface, making them effective in the identification of contaminants.
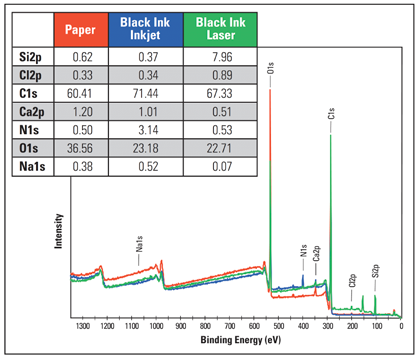
Figure 2. Survey spectra from the printed and unprinted areas.
Here, obvious differences can be observed in the inks’ minor components, with the laser print being comparatively rich in silicon, while the inkjet ink showed increased nitrogen. Components related to the paper substrate itself can also be identified; such as the chlorine used in bleaching.
Following the collection of a survey spectrum, it is possible to use an automated routine to identify the elements present. Those elements can then be analyzed further with high-resolution spectra.
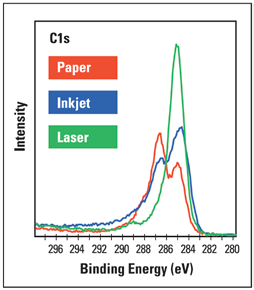
Figure 3. High-resolution C1s spectra from areas printed in black ink by the inkjet and laser printers.
Figure 3 shows examples of the C1s high-resolution scans. The spectra confirm that there is a discernible variation in the chemistry of the laser and inkjet inks, with the inkjet ink showing more complicated chemistry.
The Thermo Scientific Avantage Data System (supplied with all Thermo Scientific surface analysis instruments) can be used to peak fit the high-resolution spectra, and also to quantify individual chemical states. Figure 3 shows the output for this type of analysis of the spectra, while Figures 4 and 5 highlight a comparison of the red and black inkjet inks.
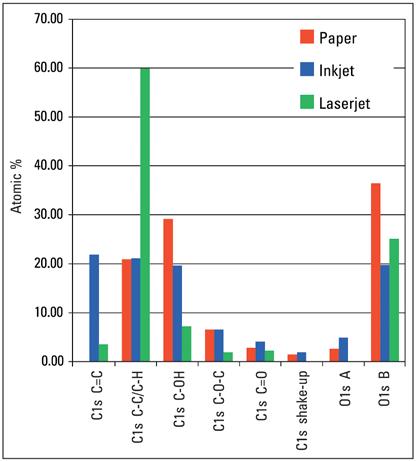
Figure 4. Quantification results for areas printed in black ink based on the C1s and O1s high-resolution spectra only.
Figure 4 illustrates the difference between the laser and inkjet inks, primarily due to the difference in the saturated hydrocarbon bonding within the molecule. Figure 5 shows that XPS can distinguish between the two ink colors investigated.
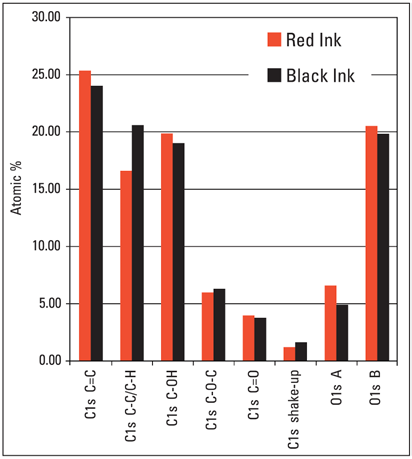
Figure 5. Quantification results for the C1s and O1s high-resolution spectra for the red and black inkjet ink.
Chemical changes here are fairly subtle, but these mainly involve a difference in the (C-C/C-H) functionality, along with a minor change in the amount of oxygen in the ink molecule.
Conclusion
It is possible to utilize XPS to explore surface effects involved in printing. The chemical signature of distinct printing methods can be determined, while the chemical functionalization of the ink can also be quantified.

This information has been sourced, reviewed and adapted from materials provided by Thermo Fisher Scientific – X-Ray Photoelectron Spectroscopy (XPS).
For more information on this source, please visit Thermo Fisher Scientific – X-Ray Photoelectron Spectroscopy (XPS).