Key Issues
- Process analytics using Raman spectroscopy: an alternative to GC
- Improved safety and QA/QC with the use of in situ sampling
- Robust in-line sampling coupled with simple univariate calibration
Introduction
Methyltin chlorides, including dimethyltin dichloride ((CH3)2SnCl2) and methyltin trichloride (CH3SnCl3), are generally utilized as precursors for the synthesis of heat stabilizers, used in the commercially valuable polymer polyvinyl chloride (PVC).
Ascertaining the fractions of these two species within a product is an essential QA/QC task. Historically, at-line gas chromatography (GC) has been employed in this application, but as organotin compounds are extremely toxic, a laborious, complex sampling method must be used in order to prevent any human contact with potentially hazardous samples.
Raman spectroscopy can provide a useful alternative to GC for the analysis of organotin compounds. It can be conducted in-line via a remotely operated system fitted with an insertion probe, minimizing human exposure and improving both quality control and safety.
While GC requires grab samples to be taken from the process stream before being analyzed off-line, Raman spectroscopy facilitates real-time in-line analysis that can be used to support effective process control.
Furthermore, while GC can accommodate a single band for a single analyte, the Raman spectrum can provide information on both functional groups and molecular structure.
Experiment
Raman spectra was obtained via a Kaiser Raman analyzer with excitation radiation from a 785 nm NIR laser. The samples used in this study were mixtures of dimethyltin dichloride and methyltin trichloride. An oven was used to melt the samples before they were analyzed in the liquid phase.
The immersion probe utilized for sampling had wetted parts constructed of sapphire and alloy C-276, meaning that it was able to withstand methyltin chlorides’ corrosive effects.
Before the spectra could be effectively used for quantitative analysis, they had to be truncated using the GRAMS® software package. This meant that they only included the analytically useful range of 300–650 cm–1. Within each spectrum, the curved fluorescence baseline was fit to a fifth-order polynomial, and this was then subtracted before the newly corrected baseline was re-zeroed.
Results
Spectra of both liquid and solid dimethyltin dichloride were obtained – Figure 1 identifies the specific spectral features. The liquid sample – which was heated above its melting point of 105 °C - displays a broad fluorescence background.
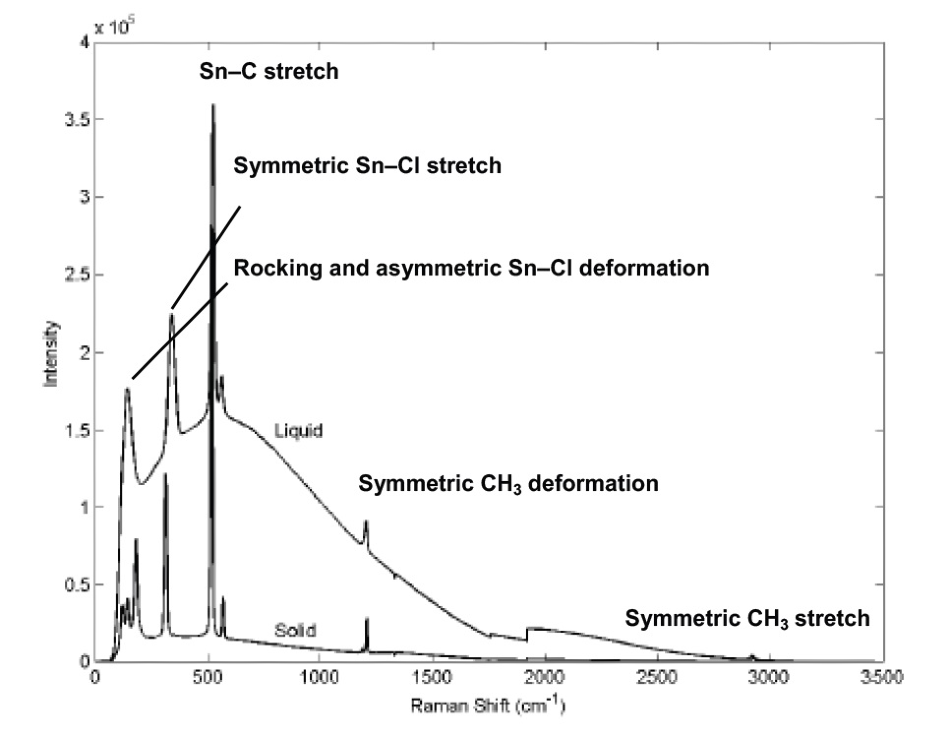
Figure 1. Raman spectrum of dimethyltin dichloride with important bands labeled. The Raman bands are visible atop the fluorescence background. Image Credit: Adapted with permission from Ref. 1. Copyright © 2001 InfoScience Services.
Meanwhile, the solid sample – kept at room temperature - was exposed to the laser for a period of time before data was acquired, therefore eliminating the fluorescence background.
This ‘photobleaching’ approach eliminated the fluorescence while leaving the methyltin chloride Raman signal intact, suggesting that the fluorescence stemmed from an impurity that was destroyed through prolonged exposure to the laser.
To properly eliminate variation resulting from background noise, spectra of various samples were compared only after the baselines were subtracted and re-zeroed, as outlined above.
It is possible to distinguish dimethyltin dichloride and methyltin trichloride by unique Raman bands: dimethyltin dichloride has bands at 524 cm–1 and 564 cm–1 while methyltin trichloride has a band at 548 cm–1.
These species’ relative concentrations within a sample can be determined quantitatively by examining the heights of characteristic Raman peaks. Figure 2a shows Raman spectra of heated liquid samples in vials - these possess differing fractions of methyltin trichloride and high dimethyltin dichloride content.
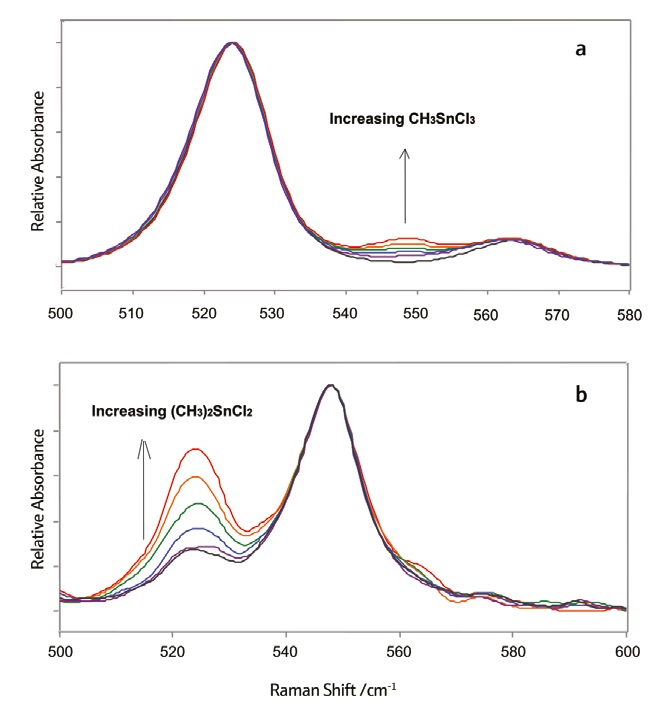
Figure 2. Normalized Raman spectra of methyltin chloride mixtures of various compositions. Image Credit: Adapted with permission from Ref. 1. Copyright © 2001 InfoScience Services.
Spectral intensities from these spectra were normalized to the intensity of the 524 cm–1 peak. The known fraction of methyltin trichloride was then correlated to the normalized intensity of the peak found at 548 cm–1.
Figure 2b displays Raman spectra of heated liquid samples differing varying fractions of dimethyltin dichloride and high methyltin trichloride content. These spectra were normalized to the intensity of the 548 cm–1 peak with the known fraction of dimethyltin dichloride correlated to the normalized intensity of the peak at 524 cm–1.
These results were then utilized in the construction of a calibration curve for methyltin chloride mixtures with more than 80% methyltin trichloride (Figure 3). On-line Raman analysis of a process sample which was completed using this calibration data correlated well with the results from at-line GC analysis.
Standard deviations of the band ratios from the prepared samples and the process sample fell in the range 0.02-0.04, while uncertainty in the fraction of methyltin trichloride was found to be around 1%.
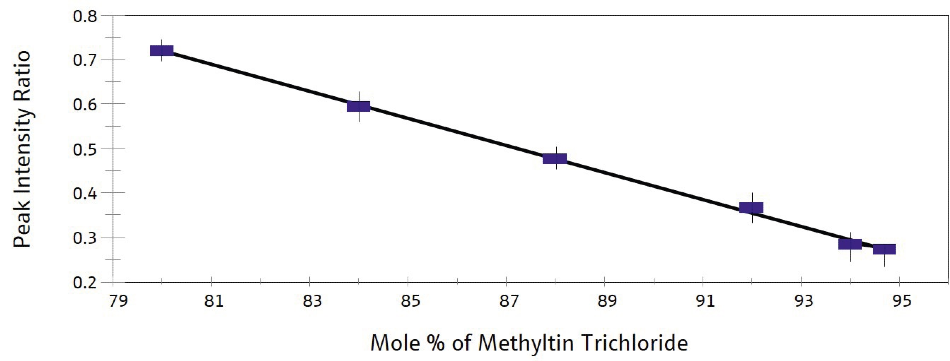
Figure 3. Calibration curve for methyltin trichloride. Image Credit: Kaiser Optical Systems, Inc.
Conclusion
In-line Raman spectroscopy has the potential to considerably streamline QA/ QC of methyltin chloride production. While GC necessitates the use grab samples obtained from the process stream and then analyzed off-line (resulting in significant time delays), Raman spectroscopy can obtain data in real time from within the process line, with no reduction in data quality.
Raman eliminates the problematic sampling procedure necessary for GC analysis while enabling remote operation. Raman also affords users better safety than GC, along with protection of the product from contamination. Not only that, but it can accomplish this while offering real-time process control that would be unworkable using at-line GC.
References
- Lee, D.; and Chabot, P. “Raman Spectroscopy of Methyltins.” Journal of Process Analytical Chemistry, Vol. 6, No. 1, 2001, 31.
This information has been sourced, reviewed and adapted from materials provided by Kaiser Optical Systems, Inc..
For more information on this source, please visit Kaiser Optical Systems, Inc..