For over 50 years, TMC has been dedicated to developing and offering precision working surfaces and vibration isolation systems to industry and precision measurement laboratories. To deliver prime performance, it is vital that both precision ‘tops’ and their supporting isolators must incorporate the control of environmental noise into their design.
1. Sources of Vibration (Noise)
Disruption of a payload can be caused by three of the primary sources of vibration (or noise): ground vibration, acoustic noise, and direct force disturbances. Ground, or seismic vibration, is present in all environments all over the world. This noise has a multitude of sources, from tectonic plates constantly grinding, waves smashing on coastal shorelines, and the bluster of the wind passing through trees and buildings, to manmade sources like machinery, HVAC systems, street traffic, and even the sound of people walking. TMC vibration isolation systems are designed to significantly reduce the environmental impact of vibration sources.
Acoustic noise derives from many of the same sources but is transferred to the payload via pressure waves in the air, generating forces that directly affect the payload. Even subsonic acoustic waves can disrupt a payload by performing the role of differential pressure which impacts the diaphragms of pneumatic isolators. Therefore, air currents created by localized HVAC vents can also be a source of acoustic noise. TMC produces Acoustic Enclosures for OEM applications which shield payloads from this type of disturbance by supplying the entire payload with a heavy, energy-absorbing, nearly airtight enclosure.
While it is possible to measure acoustic noise, its influence on a payload is contingent on several factors which can be hard to estimate (such as a payload’s acoustic [cross-section]). The exploration and examination of this type of noise source goes outside the realm of this discussion.* Generally, acoustic noise is the principal source of noise-causing vibrations above 50 Hz.
The third source of disruption affecting the payload is direct forces disturbance. These vibrations may be established through direct mechanical coupling; vibration transferred to the payload via a hose, or a laser water cooling line. They can also originate from the payload itself. This is often the case in semiconductor inspection equipment, where silicon wafers are positioned by several moving stages.
The ‘static’ portion of the payload is influenced by the force also used to advance the moving stages in the form of a reaction force. These moving stages also alter the payload’s overall center-of-mass (COM). Minimizing these sources of vibration can be done passively, with TMC’s MaxDamp® line of isolators. Furthermore, using feedback or feedforward techniques to actively reduce direct force disturbances. Due to their notoriety, payload-generated noise sources are typically easy to categorize and do not require any measurements.
Excellent payload design can minimize the influence of vibration transmitted to the payload. TMC provides a variety of honeycomb optical tables, breadboards, and platform laminations, offered in standard and custom shapes and sizes. All of which minimize the impact of environmental noise by having characteristics primed for dampening high resonant frequencies.
1.1 Measuring Noise
Seismic (floor) noise must be measured in advance as the source is not usually obvious or known. The two types of seismic noise sources are; periodic/coherent noise; and random/incoherent noise. The first necessitates the use of an amplitude spectrum while analysis of the second is accomplished using an amplitude spectral density. To establish the levels of vibration expected on a payload, these must be amalgamated with the vibration transfer function for the supporting isolation system.
1.1.1 Periodic Noise
Periodic noise usually emanates from rotating machinery. Considerably, the most frequent cause of this kind of noise is the large fans present in HVAC systems. These fans revolve at a constant rate and can produce a continuous, single-frequency vibration (and sometimes multiple harmonic frequencies as well).
Additionally, air compressors are another common source. Contrary to building fans, these cycle on and off according to demand. Compressors should be deemed periodic, coherent noise sources, although they are nonstationary, meaning a measurement will still alter whether the source is active or not. Amplitude spectrum measurement should be used to measure all periodic noise sources whether they are stationary or not.
An amplitude spectrum measurement is generated by taking the Fourier transform of data gathered from a sensor measuring the noise. The most widely used sensor is an accelerometer, which will provide a spectrum with units of acceleration as a function of frequency. Accelerometers are common because they have a ‘flat’ frequency response, and random ground noise is usually fairly ‘flat’ in acceleration (as discussed in section 1.2.2 below).
Additionally, amplitude spectrums can demonstrate velocity or position amplitudes as a function of frequency. Nearly all spectrum analyzers use the Fast Fourier Transform or FFT. An FFT analyzer locates the amplitude of each frequency in the input data and plots it. This plot also consists of the amplitudes and frequencies of any periodic noise sources. The amplitudes of periodic noise sources recorded using an amplitude spectrum are autonomous of the length of the data record.
1.1.2 Random Noise
Using an amplitude spectral density, random, or incoherent noise can be measured. The contrast between periodic and random noise is that the amplitude spectrum (above) is multiplied by the square root of the data record’s length prior to the analyzer displaying it. The outcome is a curve that measures the random noise with units of [units] /, where [units] might be acceleration, position, or velocity. This normalization for the measurement bandwidth aims to ensure that the noise level measured is unrelated to the length of the data record.**
For example, without this correction, the level of random noise would seem to reduce by a factor of ten if the length of the data record was greater by a factor of 100. Note, when using the spectral density, the periodic noise sources will appear to expand in amplitude as the data record gets longer.
Random ground noise levels can shift significantly but an ‘average’ site may have 0.5 µg / √ Hz of noise between 1 and several hundred Hz. It is also possible that random noise is nonstationary. For example, stormy weather can intensify levels of random seismic noise considerably. Figure 1 displays common noise levels in buildings.***
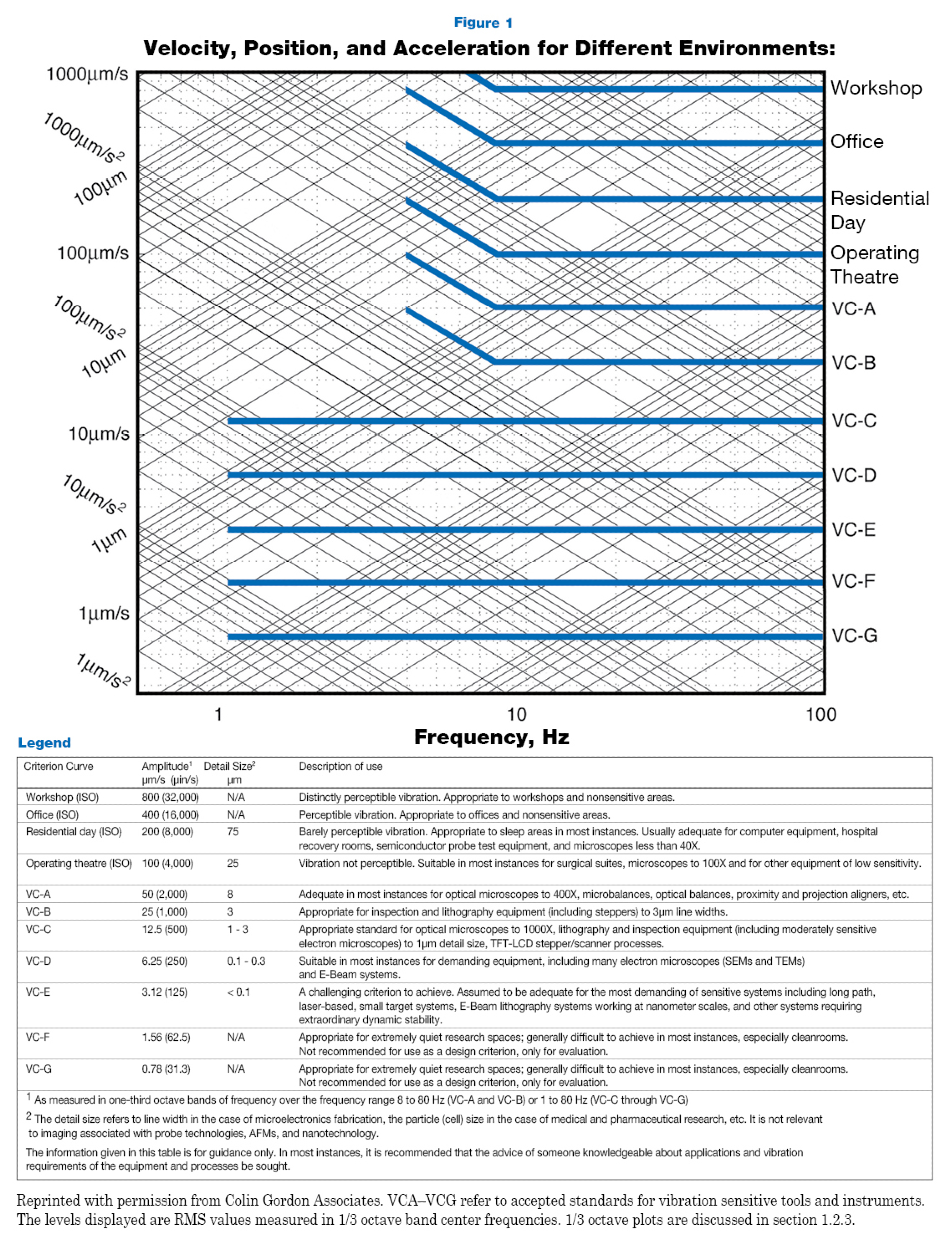
Image Credit: TMC Vibration Control
1.1.3 Measuring RMS Values
Due to both random and periodic noise being present in most locations, it is often advisable to come up with a single number that characterizes noise levels. This is typically made by quoting an RMS (Root-Mean-Squared) noise level within a particular range of frequencies. Fortunately, this is simply carried out by incorporating the power spectral density or PSD over the frequency range of interest. The PSD is the square of the amplitude spectral density. The following expression for the RMS motion between the frequencies f1 and f2 is provided:
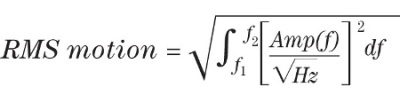
This formula calculates precisely the RMS value of the measurement while simultaneously considering both periodic and random noise sources. Most spectrum analyzers can perform this integration as a built-in function. Using the amplitude spectrum (not the amplitude density) and dividing the peak value by √2, the contribution to this RMS value from any single periodic source can be measured. The contribution from several peaks can be integrated by adding them in quadrature. RMS values are occasionally stated as 1/3 octave plots in which a histogram of the RMS values calculated in 1/3 octave frequency bins is shown as a function of frequency: an octave is a factor of two in frequency.
1.1.4 Characterizing Isolators
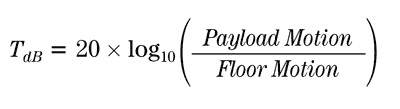
Predicting the noise level on a payload is made possible by measuring the ground noise (described above), then multiplying those spectra by the isolation system’s transfer function. Often referred to as the isolator’s transmissibility, the transfer function is a dimensionless multiplier determined as a function of frequency. It is usually plotted as the ratio of table motion to ground motion as a function of frequency. It is customary to express transmissibility in terms of decibels, or dB:
In reality, other noise sources acting on the payload (such as acoustic noise) can cause corruption of the measurement of the transfer function for an isolation system. This is the main reason why many transfer functions measured are noisy. To enhance the quality of a transmissibility measurement, a ‘shake table’ can be utilized. However, this is hazardous as it can distort the system’s performance at low levels of vibration.
References
* See Cyril M. Harris, Ed., Shock and Vibration Handbook, Third Ed. (The McGraw-Hill Companies, 1987)
** Other normalizations often apply such as corrections for “data-windowing” which is beyond the scope of this text. See “The Fundamentals of Signal Analysis,” Application Note Number 243. Hewlett Packard Corporation.
*** Reprinted with permission from Colin Gordon Associates. VCA–VCE refer to accepted standards for vibration sensitive tools and instruments. The levels displayed are RMS values measured in 1/3 octave band center frequencies.

This information has been sourced, reviewed and adapted from materials provided by TMC Vibration Control.
For more information on this source, please visit TMC Vibration Control.