Few techniques are as versatile or as powerful as Nuclear Magnetic Resonance (NMR) spectroscopy. First detailed in 1938, with the first identifiable instruments constructed in the mid-1940s, NMR spectroscopy was established as one of the primary techniques used to obtain physical, electronic, chemical, and structural information about molecules.
The method manipulates the principle of a chemical shift in resonance frequencies of the nuclear spins in the sample. Over 75 years later, NMR spectroscopy routinely offers detailed information on the functional groups, dynamics, topology, and three-dimensional structure of molecules in solution and in the solid-state. Utilized in a range of research and industrial fields, for example, pharmaceuticals, agriculture, and food.
From early on when the initial papers surfaced around 30 years ago, NMR has been considered a quantitative technique also. Since the area under an NMR peak tends to be relative to the number of spins involved, peak integrals can be used to establish composition quantitatively.
Significantly, quantitative NMR (qNMR) does not necessitate calibration to establish response factors – the ratio between the concentration of a compound being analyzed and the response of the detector to that compound – as other analytical techniques do. In recent times, there has been an incline in the interest in qNMR as a new wave of analysts, and application scientists have become aware of the potential of this technique. This article considers why this is and provides particular emphasis to the progressions in data processing that look set to broaden the appeal of qNMR further.
Why qNMR?
qNMR can offer both relative quantitation and absolute quantitation. That is the measurement of the ratio of a target component present within the sample being measured and the measurement of the effective amount of the target component present within the sample being measured in each case respectfully.
Absolute quantitation has some novel characteristics and advantages over other analytical techniques. Chromatography identifies the characteristics of the molecule itself, such as refractive index, absorbance, and fluorescence. Therefore, where quantitative analysis is concerned, chromatographers require a standard substance that is identical to the component that is being quantified in order to have a benchmark for making a measurement of the target molecule. Moreover, to guarantee reproducibility in sample measurements, a method that eliminates variability in the response factor must be deployed. One of the simplest ways to do this is when calibrating the instrument use relative response factors and an internal standard.
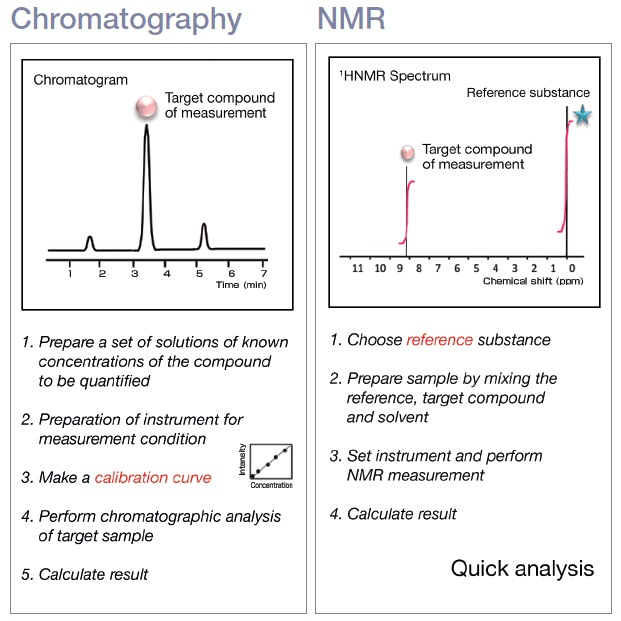
Figure 1. Comparison of chromatography and qNMR workflows.
Practically, a set of standards are measured, and a calibration curve is determined which samples are compared against. Comparatively, qNMR detects the nuclei that form molecules. Thus, if there is a proton in the molecule, a substance identical to the target component to benchmark is not required and calibration curves are not necessary.
The crucial features of qNMR can be summarized with 4 keywords:
- Versatility – can be utilized for almost any organic compound that can be made into a solution.
- Speed –calibration curves for qNMR are not necessary. Additionally, conditioning is not required for performing a measurement. For a low molecular weight compound, several milligrams are necessary to make a measurement, but each measurement can be completed in around 10-15 mins.
- Efficiency – standard substance that is identical to the analysis target is not required to perform quantification. Substances typically difficult to analyze quantitatively using chromatography (as no standard substance is available), such as new compounds, can be quantitatively analyzed using qNMR. It’s possible to use one reference substance for the quantitative analysis of many measurement targets.
- Reliability – if a suitable protocol is followed, qNMR can perform Si traceable purity assessments, therefore, the reliability of the results can be assured.
Optimized NMR Measurement Conditions
The measurement conditions routinely used for proton NMR are not the best for quantitative analysis. Specific quantitative conditions are required when measurements are taken for quantitative analysis. Figure 2 exhibits an NMR spectrum of ethyl crotonate acquired with routine, standard conditions, which signifies the default measurement conditions on JEOL NMR instruments. They enable the rapid collection of proton spectra as required at many NMR laboratories.
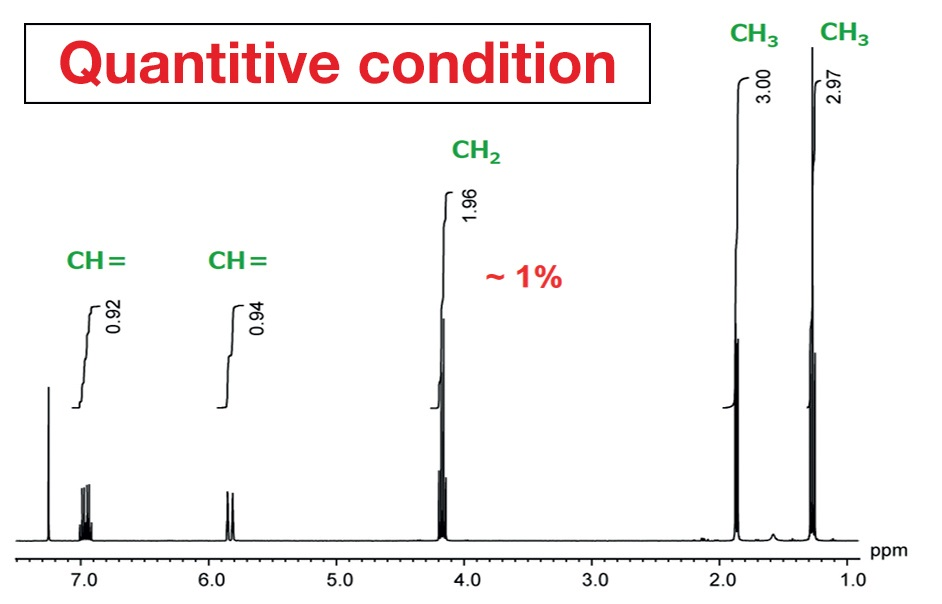
Figure 2. NMR spectrum of ethyl crotonate acquired with ordinary, routine conditions.
Figure 3 was achieved using measurement conditions maximized for quantification. Comparing the peak areas, in Figure 2, from the left, the values are 0.92, 0.93, 1.96, 3.0, and 2.97. For structural analysis, this can be read as 1 to 1 to 2 to 3 to 3, but it is apparent that there is an error in the integral values of as much as 8%. This is not acceptable in high-precision qNMR analysis. By way of comparison, in Figure 3, the area values and the proton counts match. The error is around 1%. This displays the importance of using quantitative conditions when taking measurements for quantitative analysis.
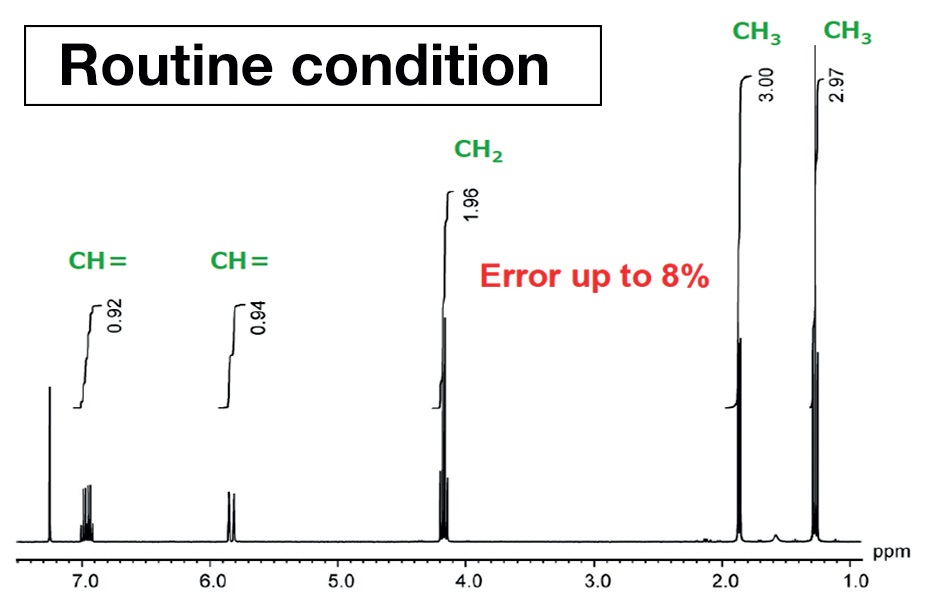
Figure 3. NMR spectrum of ethyl crotonate acquired using measurement conditions optimized for quantification.
But what are quantitative conditions?
Table 1 displays a comparison of the conventional parameters for standard conditions and for quantitative conditions. The routine conditions are the default settings of the JEOL instrument for proton measurement. The quantitative conditions are founded on the conditions as detailed in the Japanese Pharmacopoeia1. The parameter variances can be quite significant, but there are six specific parameters that need to be considered. Pulse repetition time and the number of scans are two of the most important parameters.
Table 1. Typical parameters for routine and quantitative measurement conditions.
| Typical parameters |
Routine |
Quantitative |
| Pulse repetition time |
~7 sec |
>T1 x 7 |
| Pulse flip angle |
45° |
90° |
| Scans |
8 |
S/N>100 |
| Digital resolution |
0.5 Hz |
<0.25 Hz |
| Sample spinning |
On |
Off |
| 13C decoupling |
Off |
On |
Pulse Repetition Time
AS displayed in Figure 4, the pulse repetition time is the length of time from the irradiation of one pulse until the irradiation of the next pulse. This should be at least seven times longer than T1 (longitudinal relaxation time) for quantitative conditions.
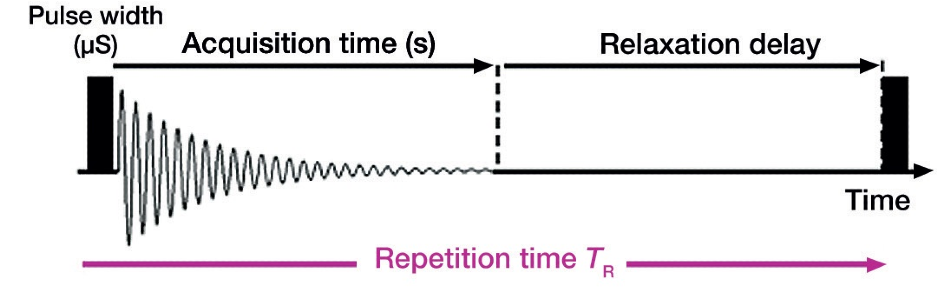
Figure 4. Pulse repetition time overview.
The magnetization behavior on the sample side relates to the pulse sequence of the instrument when the magnetization is disturbed by the application of a pulse. Waiting patiently and allowing the magnetization to completely recover before applying the next pulse, ensures the quantitativeness of the signals. Thus, the parameter settings must allow for ample delay between pulses to assure quantitativeness while taking measurements.
The index for this time setting is T1 – time constant that is a feature of the signal. The relaxation time can be established by making an inversion recovery measurement. Therefore, to identify how much time is necessary for the pulse repetition time, Figure 5 illustrates the theoretical relationship between the signal strand and the ratio between the repetition time, and the relaxation time. The vertical axis signifies normalized signal strength, and the horizontal axis is the ratio of the repetition time to the longitudinal relaxation time.
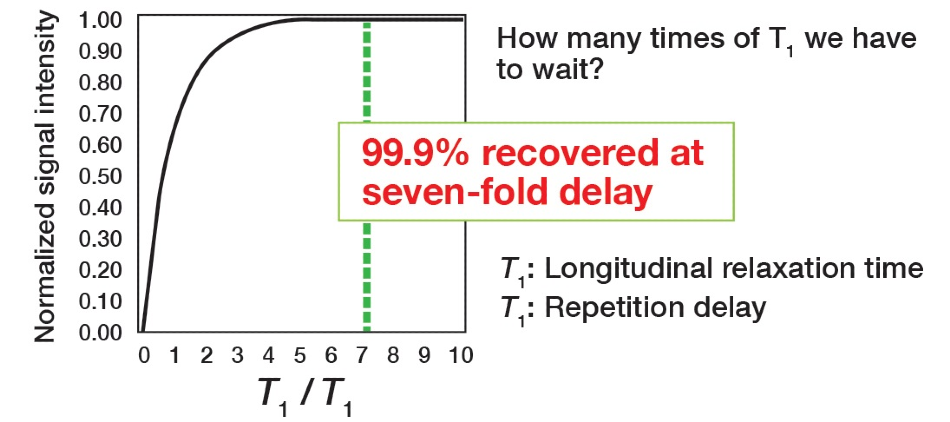
Figure 5. Pulse repetition time analysis.
It can be noted that the point at which the signal intensity turns to 100% is shown as a multiple of T1. Accordingly, setting the pulse repetition time to 7 x T1 or more will mean the signal is almost returned entirely to the original state. Hence, why this is determined as the condition for quantification. In standard conditions, the primary focus is on the signal to noise ratio to verify the signal as much as possible, meaning that the acquisition conditions underline the integration efficiency, so the goal differs. The pulse repetition time is the key parameter because it is the setting that technically enhances quantitative performance. Other parameters are present for minimizing the integration error as peak areas are acquired. There are no compulsory settings for the other parameters and there should be no issues if these are varied in line with the situation.
Number of Scans
For quantitative conditions, it is necessary for the signal to noise (S/N) ratio to be 100 or more. Figure 6 exhibits the relationship theorized between the S/N ratio and accuracy. Accordingly, if the S/N is 100 or more, the integration error can be maintained to an accuracy within 1%. Thus, to acquire an integration with improved accuracy, the S/N ratio must be higher. If this is not possible because of the sample amount, it is crucial to understand that this will be a factor contributing to the quantification error. Therefore, the setting for the number of scans is not a specific number, rather, it is a setting to acquire a target accuracy for the available S/N ratio.
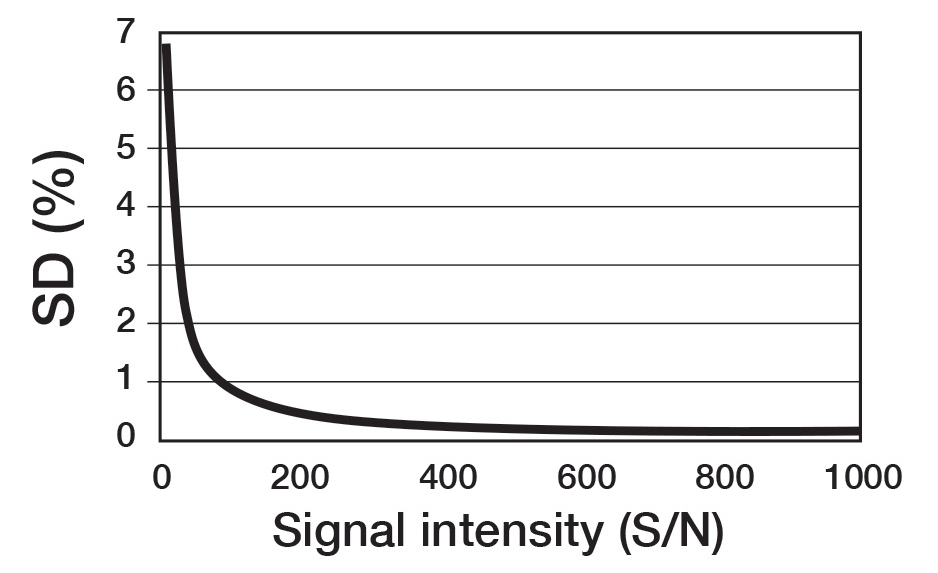
Figure 6. Influence of signal intensity (S/N) to repetitive accuracy (SD) of integration.
The Challenge of Data Analysis
Traditional high-throughput, automated NMR analysis (whether for quantitative or structural/dynamic studies) has historically concentrated on raising the throughput of the data collection and/or its reduction to tabular format. Bottlenecks can occur in the reduction of the spectral domain to the tabular domain, specifically when considering systems of high-complexity, where crucial, manual intervention and guidance are demanded from the user.
Time-domain analysis (i.e. extraction of amplitude, frequency, linewidth, and phase directly from the FID) has been suggested in the past for data reduction to a table. Presently, the emerging CRAFT (Complete Reduction to Amplitude Frequency Table 2.) technique looks set to revolutionize the traditional steps in the data processing. However, it is vital to note that the applicability of CRAFT for qNMR measurements is not about it being superior to existing, appropriate approaches implemented in NMR processing software such as JEOL’s Delta NMR software and third-party offline NMR processing packages.
For many analytical tasks, conventional methods will remain fixed in place. Instead, the advantage of the direct ‘Spectrum to Spreadsheet’ function in CRAFT is that it provides scope for easy, full automation where problems of real complexity are concerned.
CRAFT
First suggested as a durable and time-efficient Bayesian approach for quantitative mixture analysis in 2013, CRAFT utilizes a Bayesian statistical approach to transform NMR time-domain data directly to the tabular domain (Figure 7). This approach is potentially a new paradigm for spectral analysis. With CRAFT, the frequency domain data (the ‘spectrum’) is a visualization tool for the tabular domain, in comparison to traditional processes where the tabular domain is taken from the spectrum by a skilled spectroscopist.
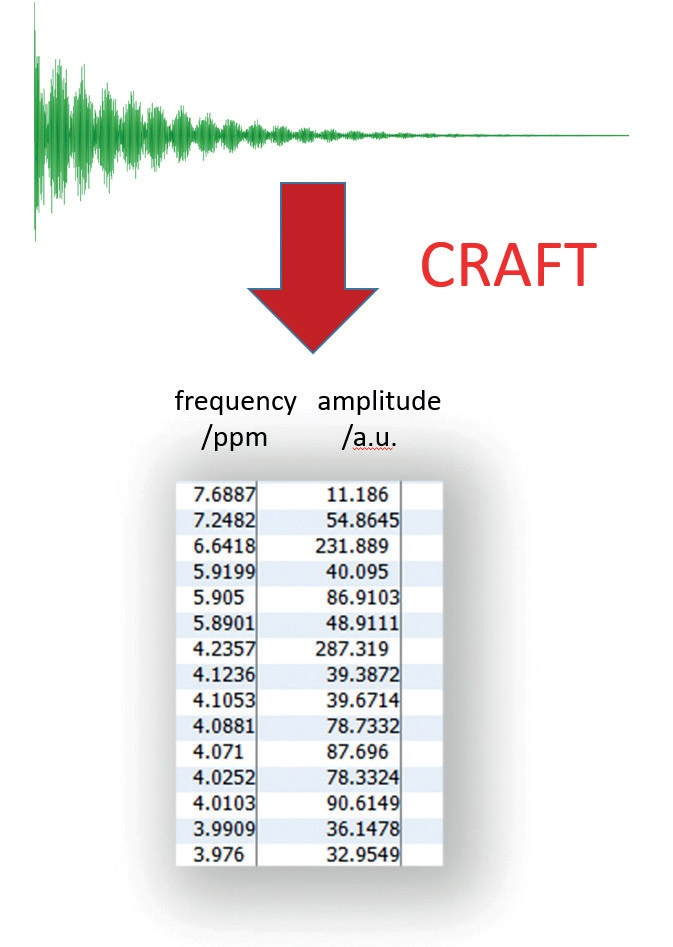
Figure 7. The output from CRAFT: data directly in tabular form.
The reconstruction, after the event, of model data captured from each component of the amplitude-frequency table of an example 1H-NMR measurement of brucine is exhibited in Figure 8. The reconstructed trace (green) is very similar to the original, measured, trace (blue) – the nominal differences are illustrated on the residual (brown) trace.
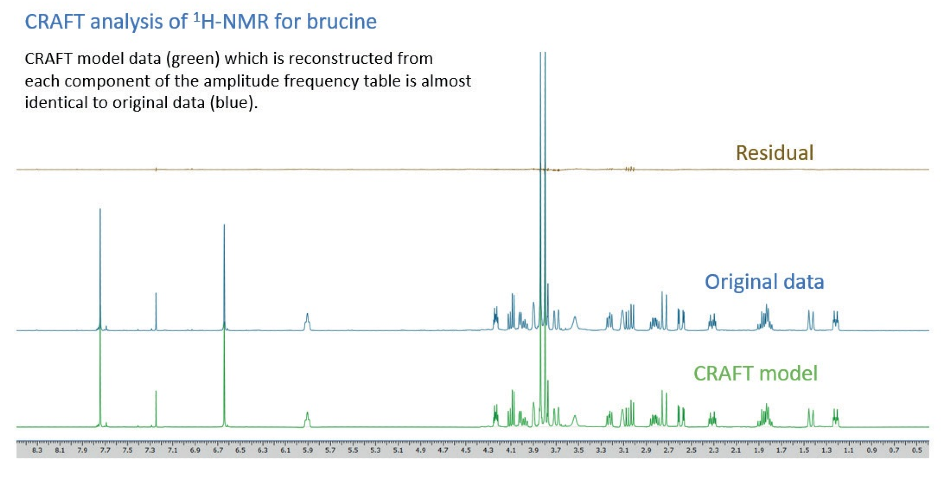
Figure 8. CRAFT analysis of 1H-NMR for brucine.
An example of a standard CRAFT result is exhibited in Figure 9. The saved CRAFT line list result can be observed in a saved CRAFT result pdf file, or data may be visualized with the Delta data slate tools. It is key to understand that the ‘Amplitudes’ take into account the total area of each frequency reported, not peak height. By choosing a value in the line list table with a mouse click, its relevant CRAFT model can be displayed.
A user can select as many peaks as required and normal shift-click, control-click options are respected. To eliminate the display of selected models, control-click the lines in the line list report to deselect.
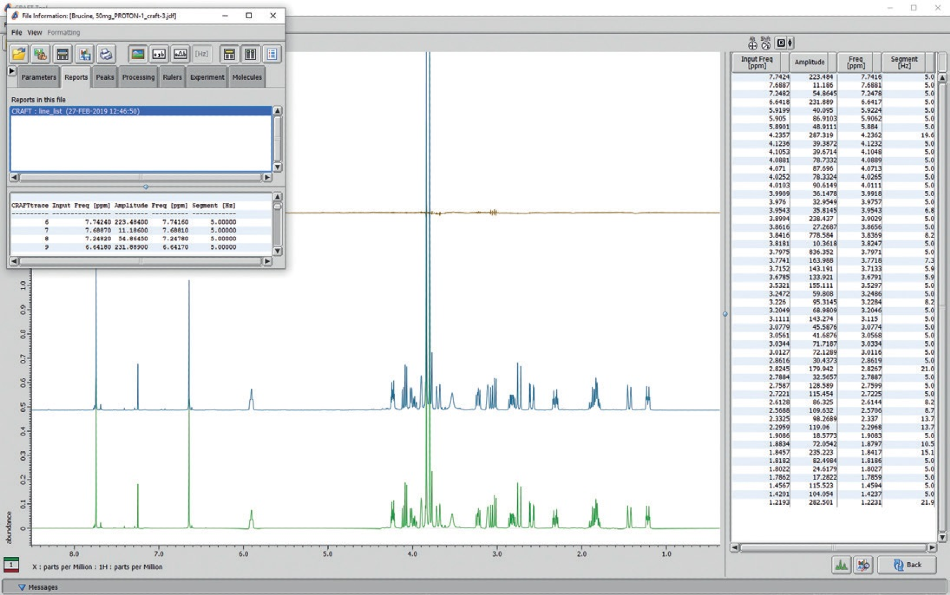
Figure 9. CRAFT analysis screen from JEOL CRAFT tool software shows a line list table (right panel) reconstructed models (large panel), and the pop-up menu box to choose data export and display options.
Summary
qNMR is a rapid, dependable, versatile, flexible, and robust analytical tool. With optimal conditions for quantitative analysis, qNMR provides multiple advantages over alternative techniques. It can be utilized for analysis for almost any organic compound that can be transformed into a solution. Vitally, NMR does not necessitate calibration to determine response factors, nor a standard substance that is identical to the analysis target to perform quantification. Furthermore, it is not necessary to produce calibration curves for qNMR. Sample conditioning is not needed for carrying out and taking a measurement. For low molecular weight, compounds analysis can be performed in around 10-15 mins. With the suitable protocol, qNMR can be used to conduct Si traceable purity assessments and it is appropriate for automation and high-throughput analysis. With enhanced data processing options, using CRAFT for the analysis of complex mixtures, qNMR is well on the way to find broader application uses in the coming years.
References and Further Reading
- The Japanese Pharmacopoeia, Seventeenth Edition, P2519, 2016
- Amplitude Frequency Table – robust and time-efficient Bayesian approach for quantitative mixture analysis by NMR, Krish Krishnamurthy, Magn. Reson. Chem, 51, pp 821-829 (2013).

This information has been sourced, reviewed and adapted from materials provided by JEOL USA, Inc.
For more information on this source, please visit JEOL USA, Inc.