The most important resource and most consumed food worldwide is drinking water. International and national regulations and norms regulate quality control for drinking water.
For instance, the Method 200.8 has been released by the U.S. Environmental Protection Agency (EPA), which specifies criteria for establishing trace elements in waters and wastes by ICP-MS. The Council Directive 98/83/EC of 3 November 1998 specifies quality criteria for water intended for human consumption in Europe.
The analyses are performed externally by contract labs or internally by water suppliers or producers to guarantee safe products free from toxic contaminants. To harmonize the measurement procedures, almost all analyses provided by contract labs follow regulations and standards.
For those labs that need high sample throughput each day, not only accuracy, robustness, and precision of the technique chosen are vital, but the speed of analysis matters particularly. The lower the cost per sample, the more samples that can be analyzed per hour.
Quick sampling systems were developed for ICP mass spectrometers, reducing sample uptake time and total analysis time per sample dramatically1. The limiting factor is no longer the supply and rinsing time of the sample, but the measuring time that depends on the number of elements to be analyzed.
However, decreasing the data acquisition time will affect the precision of the results directly, this is because less averaging is possible due to the time constraint. Therefore, the key parameter for the evaluation of high-throughput techniques is precision.
The measurement of 82 drinking water samples per hour with 21 elements (+4 internal standards) is demonstrated using Analytik Jena’s patented iCRC technology for interference removal. Highly precise results were achieved (average RSD <2.2%) even with this high sample throughput, according to the U.S. EPA 200.8 regulation.
An even higher precision with an average RSD of 1.5% is demonstrated at a very competitive throughput of 60 samples per hour, due to the robustness of the technique and the unmatched sensitivity of the PlasmaQuant® MS. In combination with the lowest argon consumption on the market, this translates into the lowest cost per sample.
Materials and Methods
A PlasmaQuant® MS equipped with Micro Mist (0.4 mL/min) nebulizer, Fassel torch with 2.4 mm injector, and Scott double-pass spray chamber was utilized for the analyses. To improve the throughput, a fast sample introduction system (oneFAST, ESI) was combined with an ASPQ3300 autosampler.
Featuring the self-cleaning pre-quadrupole and the patented ReflexION technology, the PlasmaQuant® MS decreases contaminations of the ion optics and quadrupole to an absolute minimum, avoiding unnecessary maintenance and cleaning steps. It is necessary to minimize the time per sample to reduce the costs per sample.
The sample analysis cycle can be divided into measurement time and non-productive steps such as read delays, sample uptake or washout, and autosampler movements (see Figure 1).
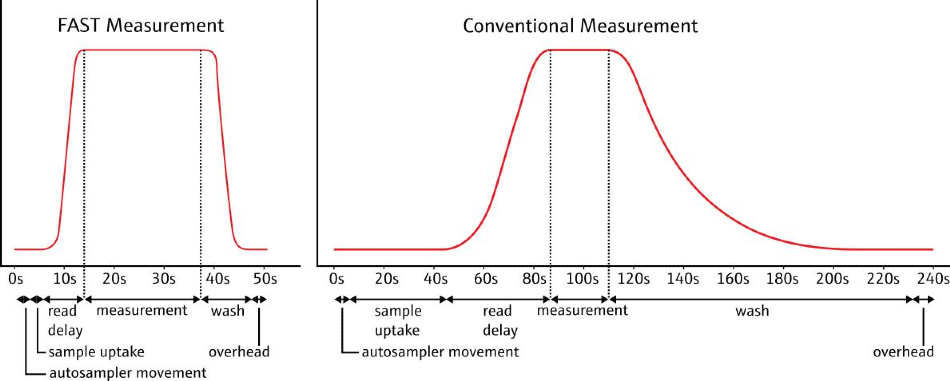
Figure 1. Comparison of different steps during sample uptake, measurement, and washout with and without ESI oneFAST.
Using the ESI oneFAST system, those non-productive steps are minimized, boosting sample throughput significantly1. The measurement time and sample throughput are then defined by the requested precision, which must be acquired.
All functions and accessories of the instrument are fully controlled and monitored with the Aspect MS® software. A warm-up routine, which can be adapted to the user’s requirements, performs all of the required steps automatically, minimizing instrument downtimes.
The software enables the automatic optimization of all ion optics, nebulizer, and plasma parameters, and guides the user through the technology development process. As required by regulations, it contains built-in quality controls for monitoring the results.
Out-of-specification results trigger predefined actions, minimizing user actions. The Aspect MS® software supplies intuitive data analysis, export, and report functions for optimal integration in modern laboratory environments and LIMS systems.
Samples and Reagents
- Using the multi-element standard Calibration Mix 2 (Analytik Jena) and single-element standards (ICP grade) for Ag, Sb, Hg, and Mo, calibration solutions were prepared from a stock solution. The concentrations utilized for calibration are shown in Table 1.
- Standards and samples contained 1% nitric acid (Ultrapure, Merck).
- All samples and standards were prepared using high-purity reagents. Samples were diluted by a factor of 2 with deionized water (<0.055 mS, ELGA Lab).
Table 1. Concentration of the standards used for calibration.
| Element |
Concentration of standards [ppb] |
| Be |
0.5 |
5 |
50 |
100 |
500 |
| Al |
0.5 |
5 |
50 |
100 |
|
| V |
0.5 |
5 |
50 |
100 |
|
| Cr |
0.5 |
5 |
50 |
|
|
| Mn |
0.5 |
5 |
50 |
|
|
| Co |
0.5 |
5 |
50 |
|
|
| Ni |
0.5 |
5 |
50 |
100 |
|
| Cu |
0.5 |
5 |
50 |
100 |
|
| Zn |
0.5 |
5 |
50 |
100 |
500 |
| As |
0.5 |
5 |
50 |
100 |
500 |
| Se |
0.5 |
5 |
50 |
100 |
500 |
| Mo |
0.5 |
5 |
50 |
100 |
|
| Ag |
0.5 |
5 |
50 |
|
|
| Cd |
0.5 |
5 |
50 |
100 |
|
| Sb |
0.5 |
5 |
50 |
100 |
|
| Ba |
0.5 |
5 |
50 |
100 |
500 |
| Hg |
0.5 |
5 |
50 |
|
|
| Tl |
0.5 |
5 |
50 |
100 |
|
| Pb |
0.5 |
5 |
50 |
100 |
|
| Th |
0.5 |
5 |
|
|
|
| U |
0.5 |
5 |
|
|
|
Six representative calibration curves (Be, Al, Mn, Mo, Ba and Tl) out of the 21 analytes are shown in Figure 2. Correlation coefficients >0.99996 were obtained for all elements.
The very high correlation coefficients acquired, low RSDs, and minor deviations of the individual standards from the regression curve exhibit the excellent quality of the calibration even at high sample throughput.
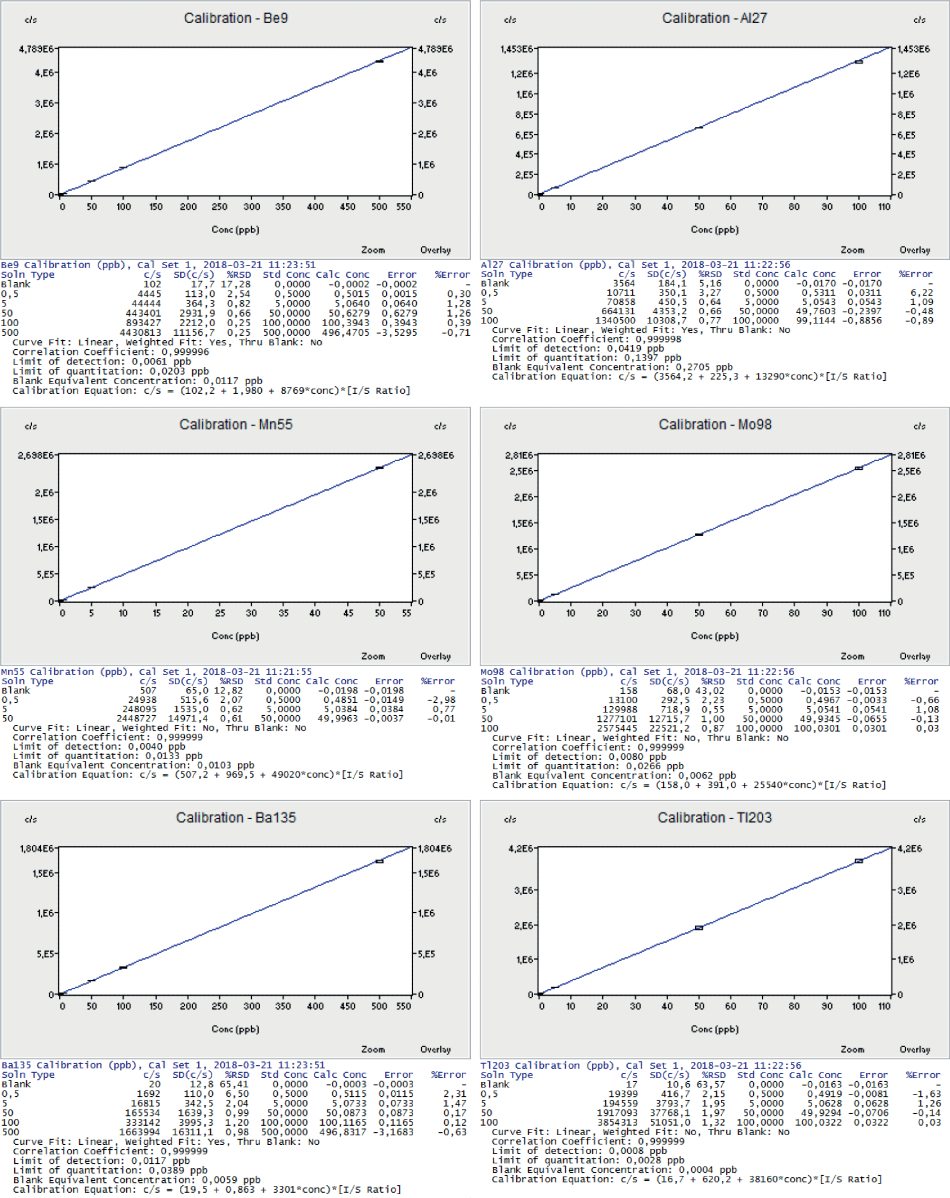
Figure 2. Representative calibration curves.
Instrument Settings and Method Parameters
To achieve high accuracy and robustness at minimum analysis time per sample, a robust method using helium as a collision gas for effective interference removal by kinetic energy discrimination (KED) was developed.
Internal standards (6Li, Y, Rh, and Ir) were added on-line to the sample via a T-piece at 20 ppb concentration. The method parameters employed are shown in Table 2.
Table 2. Method parameters.
| Parameter |
Specification |
| Plasma Gas Flow |
9 L/min |
| Auxiliary Gas Flow |
1.45 L/min |
| Nebulizer Gas Flow |
1.01 L/min |
| Spray Chamber Temperature |
3 °C |
| RF Power |
1450 W |
| Sampling Depth |
5.0 mm |
| Dwell Time |
20 ms (50 ms for Be, As, Se) |
| Scans per Replicate |
7 (peak hopping, 1 pt/peak) |
| No. of Replicates |
6 |
| Pump Rate, Tubings |
15 rpm, black/black PVC pump tubing for sample; orange/green PCV tubing for internal standards |
| Stabilization Delay |
19 s |
| Sample Loading Time |
7 s |
| iCRC Gas Flow |
120 mL He/min |
| Detector Attenuation |
none |
Accuracy
To verify the accuracy of the technique, certified reference materials were measured. The concentration results were found within 91 and 103% of the specified value and within the ±10% range as specified by U.S. EPA 200.8.
Furthermore, two lab-fortified matrices (LFM, +1 ppb and +10 ppb) were measured to verify the method’s accuracy. The recovery rates of the LFMs were between 91 and 104% and were within the specified range of 70 to 130%.
It is vital to note that good recovery rates for small spikes on high sample concentrations can only be obtained with a precise measurement. The EPA 200.8 regulation states that the spiked concentration is dependent on the instrument’s sensitivity for this reason, and it should be equal to the concentration in the sample.
It was possible to correctly analyze lab-fortified matrix samples adding only 10% to the actual sample concentration because of the outstanding sensitivity of the PlasmaQuant® MS and the enhanced precision.
Table 3. Determined concentrations of Jena tap water and certified reference materials.
| [ppb] |
Be9 |
Al27 |
V51 |
Cr52 |
Mn55 |
Co59 |
Ni60 |
Cu65 |
Zn66 |
As75 |
Se82 |
| tap water |
0.0 |
2.7 |
0.5 |
0.2 |
1.1 |
0.0 |
0.9 |
63.7 |
47.7 |
0.9 |
1.5 |
| NIST 1640a |
2.9 |
52.8 |
14.2 |
38.5 |
38.7 |
19.7 |
23.5 |
81.2 |
52.0 |
7.8 |
19.3 |
| NIST 1643f |
13.1 |
131.9 |
35.9 |
17.5 |
34.9 |
24.1 |
54.6 |
19.8 |
70.2 |
54.0 |
11.7 |
| [ppb] |
Mo98 |
Ag107 |
Cd112 |
Sb121 |
Ba135 |
Hg202 |
Tl203 |
Pb207 |
Th232 |
U238 |
| tap water |
0.7 |
0.2 |
0.0 |
0.2 |
200.0 |
0.4 |
0.0 |
2.4 |
0.1 |
5.4 |
| NIST 1640a |
45.3 |
7.4 |
3.8 |
5.1 |
145.7 |
0.2 |
1.5 |
11.7 |
0.1 |
24.1 |
| NIST 1643f |
118.9 |
1.0 |
5.8 |
56.7 |
503.2 |
0.3 |
6.5 |
17.1 |
0.1 |
0.0 |
Precision
The relative standard deviation (RSD) was utilized as a parameter to evaluate the precision of the measurements. An RSD of 1.5% was achieved on average. Due to its inherent low ionization efficiency, the results for selenium were less precise resulting in only a low count rate.
Figure 3 shows the precision and accuracy of the certified reference materials and lab-fortified matrices. All recovery rates are within 90 to 110%, while the RSD is <2% for low concentrations (LFM +1 ppb, NIST 1640a) and ≈1% for higher concentrations (LFM +10 ppb, NIST 1643f).
For all elements, the RSD required <5% for a 10/100 ppb tuning solution standard (depending on sensitivity) to verify instrument stability was achieved.
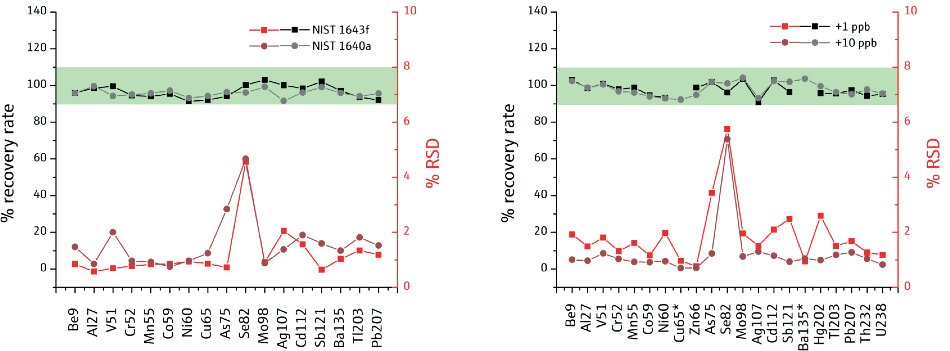
Figure 3. Recovery rate and precision of certified reference materials and lab-fortified blanks. All measurements are within the range specified. The spike concentration of +1 ppb was <5 % of the sample concentration for Cu and Ba and was excluded.
Speed of analysis
A total of 60 samples per hour can be measured with very high precision (mean RSD <1.5%) using the PlasmaQuant® MS, enabling the precise determination of LFMs adding only 1 ppb.
These results surpass the requirements of the European drinking water directive and the U.S. EPA method 200.8 by far, meeting even more demanding regulations and much stricter requirements.
However, for a number of applications, precision, accuracy, and speed of analysis are vital parameters. A higher sample throughput significantly decreases the cost per sample.
If the requirements for the precision of the analysis are not the main aim, the spectrometer’s unmatched sensitivity enables it to boost sample throughput further, to >80 samples per hour, while still delivering competitive precision (mean RSD 2.2%) as shown in Figure 4.
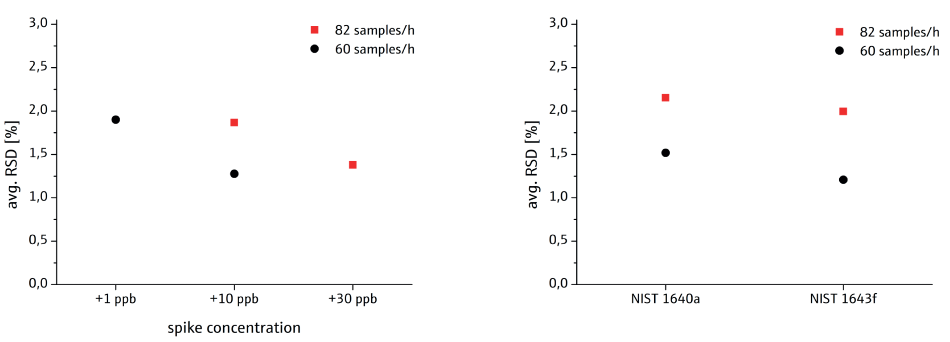
Figure 4. RSD of matrix spikes and certified reference materials measured at two different speeds. The outstanding sensitivity allows measuring 82 water samples per hour with competitive precision.
Robustness
To assess the stability of the instrument and the robustness of the technique, the recovery rate was assessed as a function of time. During the analyses over the entire mass range, the stability of the recovery rates of the laboratory-fortified matrices certified reference materials, and internal standards were excellent.
The PlasmaQuant® MS is ideal for routine applications requiring a high sample throughput over a long time (Figure 5).
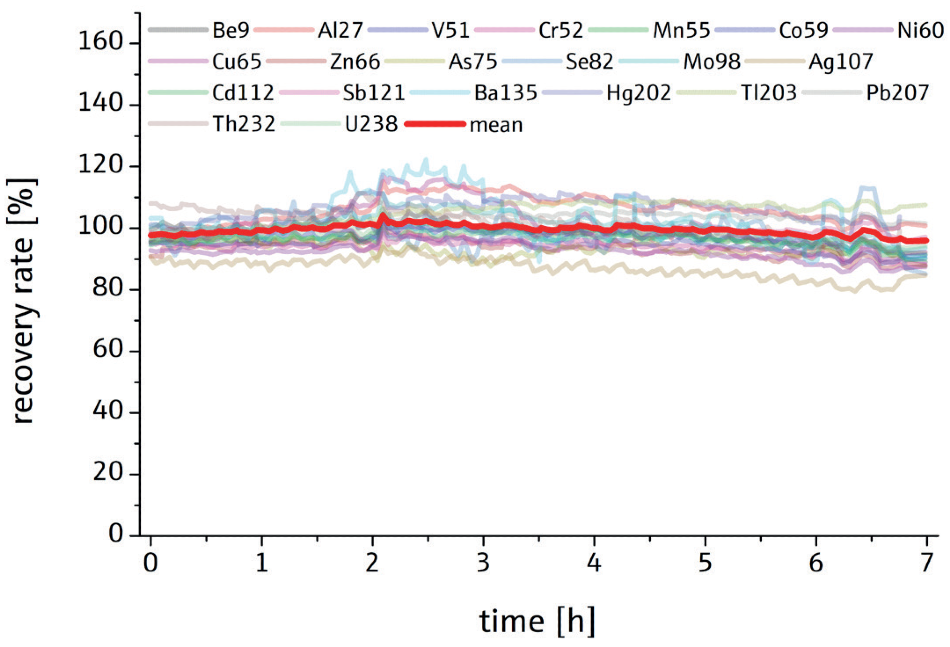
Figure 5. The recovery rate of the certified reference materials and LFMs as a function of time. Stable and accurate results were measured on all masses for 7 hours proving the robustness of the instrument and method.
Conclusion
The costs per sample are directly linked to sample throughput and limited by the precision that must be obtained. The unmatched sensitivity of the PlasmaQuant® MS and the resulting precision advantage enables it to achieve the highest sample throughputs in the ICP-MS market.
The requirements of the U.S. EPA 200.8 regulations are surpassed by far and the performance is maintained for hours, proving the robustness of the technique. The mass spectrometer by Analytik Jena has the lowest running costs on the ICP-MS market. It consumes just 50% argon gas compared to a conventional ICP-MS.
The combination of the highest sample throughput results in the lowest costs per sample and minimal running costs, making the PlasmaQuant® MS the ideal solution for customers who must routinely measure many samples.
References and Further Reading
- Sample Introduction Accessories for the PlasmaQuant® MS Series (Technote, Analytik Jena)

This information has been sourced, reviewed and adapted from materials provided by Analytik Jena US.
For more information on this source, please visit Analytik Jena US.