The most essential food for humans is clean drinking water, and standards to verify its purity and healthiness are strongly regulated by law. For example, in the EU, the European drinking water directive1 outlines purity standards, disinfection and cleanup techniques, and measurement and sampling intervals.
This directive includes water for human consumption, which must adhere to the minimum requirements in relation to chemical, microbiological, and additional indicator parameters, given in limit values. Along with taste, conductivity, and color, TOC and oxidizability are also highlighted.
While there is no limit value expressed for TOC, the oxidizability (stated as permanganate index) is restricted to 5.0 mg/L O2. As the oxidizability is in relation to total organic carbon, note 4 clearly explains that the oxidizability “need not be measured if the parameter TOC is analyzed.”
For TOC, a ≤ 30% uncertainty of measurement at a level of 3 mg/L is provided (SD ≤ ± 0.9 mg/l), and the standard norm EN 1484 for dissolved organic carbon (DOC) and total organic carbon must be performed.
The greatest challenge when measuring TOC in drinking water is the fact that, normally, TOC constitutes only a fraction, approximately less than 5%, of the sample’s total carbon content.
As such, EN 1484 strongly suggests that the difference technique (TOC = TC – TIC) should only be employed if the predicted TIC (total inorganic carbon) value is equal to or less than the sample’s TOC value.
Example:
TC = 125 mg/l, TIC = 123 mg/l with a considered RSD of 1%
SD (TC) = ± 1.25 mg/l, SD (TIC) = ± 1.23 mg/l, resulting in a total error of ± 2.48 mg/l
TOC (calc.) = 2 mg/l ± 2.48 mg/l (-0.48 – 4.48 mg/l)
Thus, the method of choice is the NPOC technique with automated sample acidification followed by automatic purging of the TIC by the carrier gas of the analyzer.
The multi N/C® analyzers provide an option for TIC control measurement, which measures the total residual TIC after the purge stage. This can easily be employed to optimize the method in terms of the acid strength used and purge time. It can also be used to validate the quality of the obtained NPOC results.
Materials and Methods
Samples and Reagents
Reference standards along with drinking water samples from various origins and levels of inorganic carbon content were analyzed.
Sample Preparation
Prior to analysis, the samples were kept in a refrigerator at 4 degrees Celsius. The samples were moved into appropriate autosampler vials for measurement.
Calibration
A 1 mg/L standard solution of potassium hydrogen phthalate was utilized to calibrate the multi N/C® analyzer for NPOC. Varying the injection volume from 2 to 20 mL on the multi N/C® UV HS was carried out to perform a multi-point calibration in order to assess the results of the NPOC quantitation.
When using an injection volume of 5 mL for sample measurements, this translates to a real working range of 0.4 – 4 mg/L. The same working range can be implemented in the multi N/C® 3100 using the EasyCal function with the following settings: a variation of injection volume 100 – 1000 µL, a 2 mg/L standard solution, and running the samples with an injection volume of 500 µL.
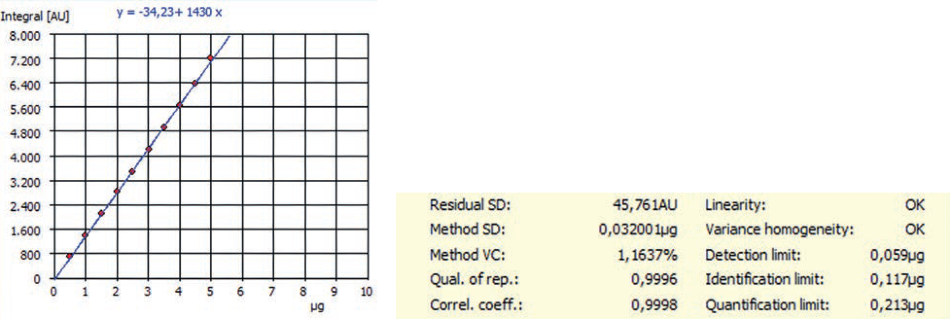
Figure 1. Example of NPOC calibration and method characteristics for an EasyCal function carried out by multi N/C® 3100.
Instrumentation
The multi N/C® UV HS and multi N/C® 3100 were used to perform the analysis. The Focus Radiation NDIR detector is featured in both models for sensitive CO2 detection. An AS vario (with 72 sample positions) was equipped to automate sample introduction.
Method Parameters
For the measurement of NPOC, automatic acidification was used to adjust the samples to pH <2, and a carrier gas was used to purge them for the removal of TIC. After the purge stage, an initial sample aliquot was dosed into the TIC reactor for subsequent determination of residual TIC through TIC control measurement.
An additional aliquot was then dosed into the main reactor, where organic compounds were fully oxidized into carbon dioxide either through UV/persulfate wet chemical digestion or by catalytic high-temperature combustion at 800 degrees Celsius in an oxygen-rich environment.
The formed CO2 was moved to the detector by the carrier gas after the reaction gases had been purified. The measurement of TOC was performed by nondispersive infrared spectrometry in the Focus Radiation NDIR detector. The method settings described in Table 1 were utilized to establish the NPOC content:
Table 1. Method settings.
| Parameter |
multi N/C® UV HS |
multi N/C® 3100 |
| Measurement parameter |
NPOC + TIC control |
NPOC + TIC control |
| Acid used for sample acidification |
2 M H2SO4 |
4 M HCl |
| Digestion |
UV oxidation at 185 nm and 254 nm + peroxo disulphate |
High-temperature digestion at 800 °C with a platinum catalyst |
| Number of repetitions |
min. 3, max. 4 |
min. 3, max. 4 |
| Rinse with sample before injection |
3 times |
3 times |
| Sample purge time |
600 sec. |
600 sec. |
| Injection volume |
5000 µL |
500 µL |
| Measuring time per injection |
3 – 5 min |
3 – 5 min |
Results and Discussion
Table 2 provides the mean values of the NPOC measurements determined from a minimum of 3 identical injections along with the relative standard deviation.
Check standards were performed as sample type “AQA standard” and the previously measured preparation water TOC blank determined at 154 AU/mL was automatically subtracted from the AQA measurements using multiWin software.
Table 2. Results.
| Sample ID |
NPOC Average [mg/L] |
RSD [%] |
TIC control level [µg/L] |
| tab water - Malmö |
2.46 |
0.32 |
0.12 |
| tab water - Oslo |
3.23 |
0.81 |
0.19 |
| tab water - Helsinki |
2.14 |
0.60 |
0.09 |
| tab water - Jena |
0.85 |
0.95 |
0.07 |
| AQA-Std – 1,0 mg/L |
0.98 |
0.31 |
0.04 |

Figure 2. NPOC measurement curve “tap water - Helsinki”.

Figure 3. TIC control measurement curve “tap water - Helsinki”.
Conclusion
The data outlined in this article demonstrates that tap water from various sources can be accurately and reliably measured employing an optimized NPOC technique. For this purpose, the TIC control tool in the multiWin software was used and acid strength and purge times used for automatic acidification were adapted accordingly.
Very low RSD values are shown in the results, which also show that the TIC control reading for every sample was at a suitably low level (well below 10% of the NPOC reading). By applying the analyses and parallel purge feature of multi N/C® analyzers along with the high throughput autosampler AS vario, long purge times do not contribute to lengthy sequence runtimes.
The TIC purge has already been completed throughout triplicate injection of the previous sample, and the next sample is investigated immediately. The multiWin Easy Cal tool reduces calibration effort to a minimum.
This tool enables calibrations to be performed with a single stock solution on a stable level of calibration higher or equivalent to one ppm and during the injection of various volumes. This way, the range of the drinking-water can be calibrated from the sub-ppm up to multiple ppm TOC.
TOC determination using multi N/C® systems will be the most comfortable parameter in the laboratory as it offers a high level of automation along with the highly effective Self Check System for hassle-free and unattended system operation.
The patented VITA flow-management system entirely compensates for flow fluctuations within the system as a result of sample evaporation, which provides TOC calibration stability for up to one year, saving precious time during the sample runs.
References and Further Reading
1) Council directive 98/83/EC (03.11.1998), latest amended by Commission Directive (EU) 2015/1787 of 6 October 2015.

This information has been sourced, reviewed, and adapted from materials provided by Analytik Jena US.
For more information on this source, please visit Analytik Jena US.