Scanning electron microscopes (SEM) combined with an energy dispersive X-ray detector (EDS) are commonly used to offer information about the chemical composition of a sample.
This SEM-EDS method can give insight on the elements in the sample, their spatial distribution, and relative concentrations over volumes that are very small (micron and in some cases nanometer scale).
EDS is generally classed as a semi-quantitative elemental analysis method. A frequently asked question at JOEL is the level of reliability that can be provided by the quantitative results achieved through SEM-EDS. This is a very broad question as the reliability is influenced by a range of factors such as the sample morphology and matrix, along with instrument factors.
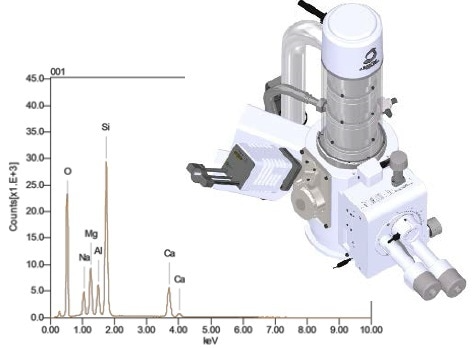
Image Credit: JEOL USA, Inc.
This leads one to ask what can be detected, and how much. Current systems can identify elements from Be to U. Limits of detection are normally considered to be ≥0.1% (1000 ppm) for higher atomic number elements and ≥1% for lower atomic number elements (F to Be).
A technique that is often referred to as ‘standardless’ quantitative EDS is one of the most widespread methods used for quantitative EDS research. With this technique, the user employs a ratio of peak intensities instead of physical standards to identify the relative presence of the elements discovered.
Background and matrix effects are corrected in the peak intensities and the results are then normalized to 100% according to the identified elements. Errors in the analysis results can be hidden by this normalization.
However, if all requirements are met, approximately ±2% to ±5% relative can be expected for major components. This error can be significantly higher for rough surfaces or particles. A number of criteria should be considered when carrying out EDS quantitative analysis.
Multiple assumptions are made with this method irrespective of whether the quantitative technique uses physical standards or is ‘standardless’. The sample must firstly be flat and polished. It should additionally be homogeneous and infinitely thick in relation to the beam interaction volume.
If the sample is not similar in relation to the beam interaction volume, the results may differ depending on the influence of nearby elements (Figure 1).
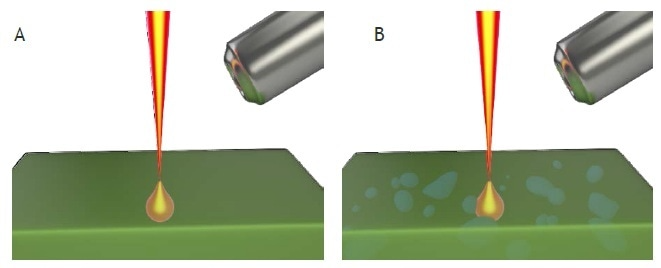
Figure 1. A: Homogeneous sample within the beam scattering volume. B: Heterogeneous sample, a particle within the scattering volume will contribute to EDS quantitative results. Image Credit: JEOL USA, Inc.
In other cases, the goal may be to quantify and identify inclusions or particles. A contribution from the surrounding matrix may arise by positioning the beam on the particle, if the scattering volume is bigger than the particle itself.
It is best practice for non-uniform materials to acquire spectra from many distinct areas and average the results. Only X-rays that are within the EDS detector’s line of sight are acquired. If the sample has strong topography, the X-rays can be completely blocked and fail to reach the detector.
In other cases, the sample matrix may absorb low energy X-rays more than higher energy X-rays, which can create errors in the quantitative results. It is crucial to consider the position of the sample in relation to the position of the EDS detector when dealing with topographic samples. The region of interest can often be positioned so that it has direct line of sight to the detector (Figure 2).
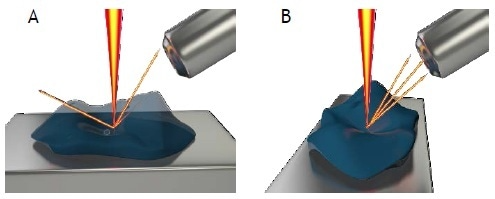
Figure 2. A: X-rays are blocked from reaching the detector by sample topography. B: Rotating the stage presents the region of interest in sight of the EDS detector allowing the X-rays to be detected. Image Credit: JEOL USA, Inc.
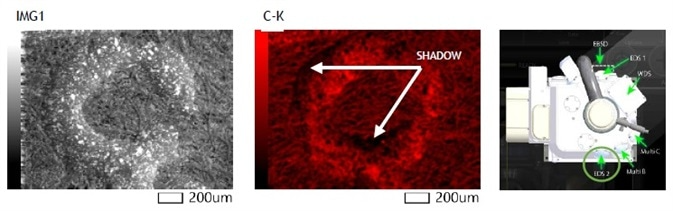
Figure 3. Example of C X-ray Intensity Map of Ink on Paper taken from EDS detector position 2. The ink is raised on surface of paper and the result is a shadow where C X-rays are blocked by the topography of the sample from reaching the detector. Image Credit: JEOL USA, Inc.
Lastly, the accelerating voltage must be sufficiently high for effective excitation of the X-ray lines for the elements found in the sample. There should also be an adequate probe current to produce an X-ray count rate that is statistically significant.
Selecting an accelerating voltage that is 1.5 to 2 times higher in energy compared to the energy of the X-Ray lines of interest is the most typical method. 15kV to 20kV is recommended for an unknown sample. Errors in the quantitative analysis results may be produced if any of these conditions are not followed.
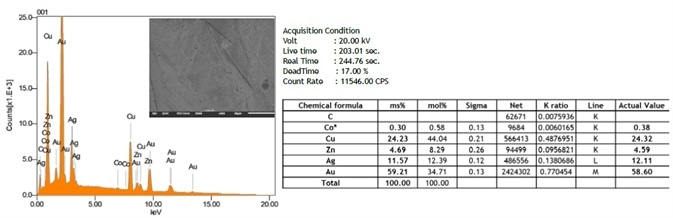
Figure 4. Example: EDS Standardless Quantitative Results – Gold Alloy. Image Credit: JEOL USA, Inc.

This information has been sourced, reviewed and adapted from materials provided by JEOL USA, Inc.
For more information on this source, please visit JEOL USA, Inc.