Lubricating oils are the essence of oil-wetted machinery. Elements like calcium, copper barium, boron, molybdenum, magnesium, sulfur phosphorus, and zinc are employed as additives in lubricating oils to enhance their lubricating capacity and properties, like anti-wear, anticorrosive, antioxidant, and diffusing. The amount of those elements greatly impacts how the lubricant acts. As such, a fast, sensitive, and accurate measurement is critical as an aspect of its manufacture.
For machinery observing and upkeep, used lubricating oil study greatly resembles a blood test to establish the wellbeing of a machine. Elemental evaluation of wear metals, impurities and additives is a critical element of oil condition evaluation. It offers an effective analytical device for organizing oil changes and predictive maintenance. Consequently, routine elemental evaluation aids enhancement profitability by improving the machinery’s dependability, accessibility, and productivity.
Elemental analysis can be performed with X-ray fluorescence, atomic absorption spectrometry (AAS), rotating electrode optical emission spectrometry (RDE-OES), or inductively coupled plasma optical emission spectrometry (ICP-OES).
ICP-OES is a formidable device for elemental assessment due to its capacity for fast multi-elemental analysis, elevated sensitivity, and a broad linear dynamic analysis range. This prowess means ICP-OES is the recommended technique for new and used oil study in ASTM D4951 and D5185 techniques. The difficulties for ICP-OES, however, are lubricating oil’s high viscosity, heterogeneity, and matrix intricacy.
These challenges can be avoided by diluting the sample with a solvent that is less viscous and employing an appropriate sample introduction system, therefore diminishing detection limits. The elevated organic load may trigger plasma instability and extinction. Inadequate carbon combustion causes soot formation on the torch injector, which needs urgent cleaning, producing downtime.
Spectral interferences may have a significant effect on the condition of the baseline fitting practices, causing substandard accuracy and detection boundaries.
Because of this, oil analysis by ICP-OES needs an instrument that provides superb plasma performance, excellent spectral resolution, and extreme sensitivity. The Analytik Jena PlasmaQuant® 9100 Elite is ideal for economical oil evaluation, with its robust plasma, excellent resolution, and distinctive sensitivity.
The excellent analytical capacities occur from its four main components. A free-running high-frequency generator with a heavy-duty four-winding induction coil provides dependable plasma performance for lubricating oil samples. The robust plasma can effortlessly accept high organic sample loadings and offer long-term stability.
High-resolution optics and a charge-coupled device (CCD) detector offer excellent spectral resolution, which permits interference-free measurement by well-separated lines.
The CCD detector depicts emission line and background intensities concurrently; this allows the automatic background correction. The vertical plasma geometry of the V Shuttle Torch means soot development and memory impacts are no longer an issue. In a normal analysis, the V Shuttle torch design means maintenance is easy and decreases instrument downtime and consumable costs.
A further critical point is that the DualView PLUS plasma observation will enhance the efficiency of oil analysis substantially, as trace elements and major constituents can quantified now from a single sample measurement with no need for tedious sample preparation.
In this article, ASTM D4951 and D5185 methods are each shown. The basic technique ASTM D4951 is for “determination of additive elements in lubricating oils by inductively coupled plasma atomic emission spectrometry.” This test technique encompasses eight elements and can be employed to ascertain if additive packages and unused lubricating oils meet requirements with regard to elemental composition.
The basic technique ASTM D5185 is for “multielement determination of used and unused lubricating oils and base oils by inductively coupled plasma atomic emission spectrometry (ICP-AES).” The ASTM D5185 technique is created for used and unused oil samples, identifying 22 additives, wear metals, and pollutants. It is usually employed as a fast diagnostic technique to ascertain the level of adulteration, the wear levels, and the overall condition of the equipment and the lubricant itself.
Experimental
Reagents
The following chemicals were employed for standards and sample preparation: CONOSTAN® Standard S21 multielemental organometallic standards at 20, 100 and 900 mg/kg (SCP Science), 10000 mg/kg yttrium oil-based standard (SCP Science), 75 cSt blank oil (SCP Science), custom QC 1, 2 and 3 samples (LGC Group) and mixed xylenes (Fisher Scientific).
Sample and Standard Preparation
Sample preparation was created to be straightforward, creating a consistency of analytes, lowering sample viscosity and reducing the possible interferences. Every sample and stock standard was homogenized in a warmed ultrasonic bath for 30 minutes at 60 °C. Yttrium was employed as the internal standard. The yttrium standard was diluted with blended xylenes to achieve a final concentration of 2 mg/kg. This yttrium solution was employed as a diluent for each sample and standard.
To reduce the viscosity disparity between samples and standards, blank oil was included if necessary, resulting in the final solution comprising of 10% oil by weight.
A blank was made by diluting the blank oil in the yttrium solution. Each standard was prepared by diluting the stock standards by weight to offer the necessary concentration. Both oil samples and QC samples were diluted ten-fold by weight.
Instrumentation
The PlasmaQuant® 9100 Elite, stocked with Organic Sample Introduction Kit, was employed for this analysis. Just 15 minutes of warm up time was necessary prior to the sample analysis. No oxygen was inserted into the plasma. A Teledyne CETAC Oils 7400 Homogenizing Dual Matrix Autosampler was employed to ensure good homogeneity of the samples. The instrument parameters can be seen in Table 1.
Table 1. Instrument parameters. Source: Analytik Jena US
| Parameter |
Setting |
| RF Power |
1400 W |
| Plasma gas flow |
15 L/min |
| Nebulizer gas flow |
0.35 L/min |
| Auxiliary gas flow |
1.5 L/min |
| Spray chamber |
borosilicate cyclonic spray chamber with dip tube, 50 mL |
| Injector |
quartz, inner diameter 1 mm |
| Nebulizer |
borosilicate concentric nebulizer, 1 mL/min |
| Outer tube/ inner tube |
quartz/quartz |
| Pump tubing |
SolventFlex |
| Sample pump rate |
1 mL/min |
| Read delay |
40 s |
| Rinse time |
45 s |
Method Development
In each ASTM method, analysis wavelengths are recommended as a standard. With the outstanding spectral resolution of the Analytik Jena PlasmaQuant® 9100 Elite, the most sensitive line can be chosen with no issue of interference.
In the Analytik Jena ASpect PQ software, the automatic background correction (ABC) purpose was utilized for data evaluation. The ABC function automatically sits in a global baseline to the whole spectral background concurrently throughout the sample analysis. The evaluation parameters for ASTM D4951 and D5185 techniques can be seen in Table 2.
Table 2. Overview of evaluation parameters for ASTM D4951 and D5185. Source: Analytik Jena US
| Method |
Element |
Wavelength (nm) |
Plasma view |
Integration mode |
Replicates |
Read time (s) |
Evaluation |
| No. of Pixel |
Baseline fit |
Polynomial degree |
Correction |
| D4951 |
Ca |
317.933 |
radial |
peak |
3 |
1 |
3 |
ABC |
auto |
Y |
| Mg |
279.553 |
radial |
peak |
3 |
1 |
3 |
ABC |
auto |
Y |
| Mo |
202.030 |
radial |
peak |
3 |
1 |
3 |
ABC |
auto |
Y |
| P |
178.224 |
radial |
peak |
3 |
1 |
3 |
ABC |
auto |
Y |
| Zn |
213.856 |
radial |
peak |
3 |
1 |
3 |
ABC |
auto |
Y |
| Y |
371.030 |
radial |
peak |
3 |
1 |
3 |
ABC |
auto |
- |
| D5185 |
Ag |
328.068 |
radial |
peak |
3 |
1 |
3 |
ABC |
auto |
Y |
| Al |
396.152 |
radial |
peak |
3 |
1 |
3 |
ABC |
auto |
Y |
| B |
249.773 |
radial |
peak |
3 |
1 |
3 |
ABC |
auto |
Y |
| Ba |
455.403 |
radial |
peak |
3 |
1 |
3 |
ABC |
auto |
Y |
| Ca |
317.933 |
radial |
peak |
3 |
1 |
3 |
ABC |
auto |
Y |
| Cd |
228.802 |
radial |
peak |
3 |
1 |
3 |
ABC |
auto |
Y |
| Cr |
267.716 |
radial |
peak |
3 |
1 |
3 |
ABC |
auto |
Y |
| Cu |
324.754 |
radial |
peak |
3 |
1 |
3 |
ABC |
auto |
Y |
| Fe |
238.204 |
radial |
peak |
3 |
1 |
3 |
ABC |
auto |
Y |
| Mg |
285.210 |
radial |
peak |
3 |
1 |
3 |
ABC |
auto |
Y |
| Mn |
257.610 |
radial |
peak |
3 |
1 |
3 |
ABC |
auto |
Y |
| Mo |
202.030 |
radial |
peak |
3 |
1 |
3 |
ABC |
auto |
Y |
| Na |
589.590 |
radial |
peak |
3 |
1 |
3 |
ABC |
auto |
Y |
| Ni |
221.648 |
radial |
peak |
3 |
1 |
3 |
ABC |
auto |
Y |
| P |
178.224 |
radial |
peak |
3 |
1 |
3 |
ABC |
auto |
Y |
| Pb |
220.353 |
radial |
peak |
3 |
1 |
3 |
ABC |
auto |
Y |
| Si |
251.611 |
radial |
peak |
3 |
1 |
3 |
ABC |
auto |
Y |
| Sn |
189.927 |
radial |
peak |
3 |
1 |
3 |
ABC |
auto |
Y |
| Ti |
334.941 |
radial |
peak |
3 |
1 |
3 |
ABC |
auto |
Y |
| V |
309.311 |
radial |
peak |
3 |
1 |
3 |
ABC |
auto |
Y |
| Zn |
213.856 |
radial |
peak |
3 |
1 |
3 |
ABC |
auto |
Y |
| Y |
371.030 |
radial |
peak |
3 |
1 |
3 |
ABC |
auto |
- |
Calibration
For the ASTM D4951 and D5185 techniques, the concentrations of standards can be seen in Table 3, in addition to the coefficient of correlation (R2) and technique detection parameters. Linear calibrations were achieved with a correlation coefficient higher than 0.9997 for every element. Calibration curves for the techniques can be seen in Figure 1 and Figure 2, respectively. ASTM D4951 and ASTM D5185 anticipate detectability in the low mg/kg range for the majority of elements to be adequate.
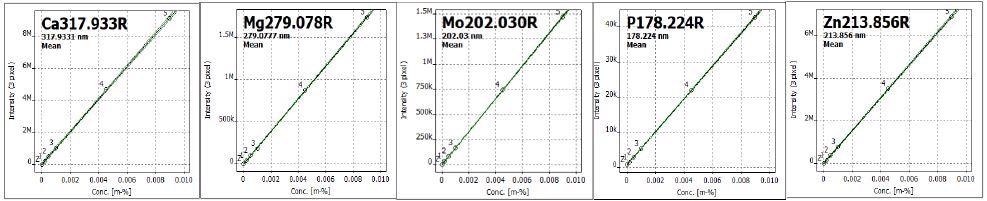
Figure 1. Calibration curves by ASTM D4951 method. Image Credit: Analytik Jena US
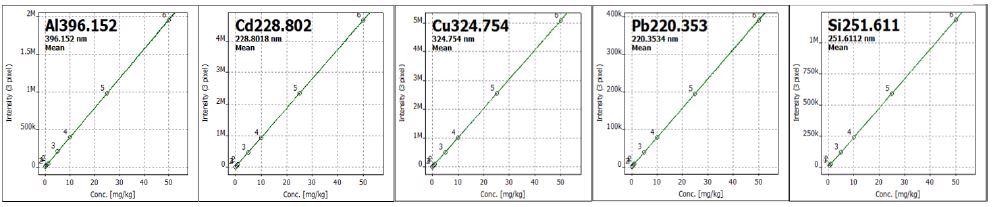
Figure 2. Calibration curves by ASTM D5185 method. Image Credit: Analytik Jena US
For the majority of elements, the method detection limits (MDL) are less than 5 µg/kg with the PlasmaQuant® 9100 Elite in radial view.
Table 3. Calibration standards, coefficient of correlation (R2) and method detection limits (MDLs). Source: Analytik Jena US
| Method |
Element |
Cal.0
(mg/kg) |
Cal.1
(mg/kg) |
Cal.2
(mg/kg) |
Cal.3
(mg/kg) |
Cal. 4
(mg/kg) |
Cal.5
(mg/kg) |
Cal.6
(mg/kg) |
Cal.7
(mg/kg) |
R2 |
MDL
(mg/kg) |
| D4951 |
Ca |
0 |
2 |
5 |
10 |
45 |
90 |
|
|
0.9997 |
|
| Mg |
0 |
2 |
5 |
10 |
45 |
90 |
|
|
0.9999 |
|
| Mo |
0 |
2 |
5 |
10 |
45 |
90 |
|
|
0.9999 |
|
| P |
0 |
2 |
5 |
10 |
45 |
90 |
|
|
0.9999 |
|
| Zn |
0 |
2 |
5 |
10 |
45 |
90 |
|
|
0.9999 |
|
| D5185 |
Ag |
0 |
0.5 |
1 |
5 |
10 |
25 |
50 |
|
1.0000 |
0.0016 |
| Al |
0 |
0.5 |
1 |
5 |
10 |
25 |
50 |
|
1.0000 |
0.0043 |
| B |
0 |
0.5 |
1 |
5 |
10 |
25 |
50 |
|
0.9999 |
0.0019 |
| Ba |
0 |
0.5 |
1 |
5 |
10 |
25 |
50 |
|
1.0000 |
0.0026 |
| Ca |
0 |
0.5 |
1 |
5 |
10 |
25 |
50 |
81.5 |
1.000 |
0.0033 |
| Cd |
0 |
0.5 |
1 |
5 |
10 |
25 |
50 |
|
1.0000 |
0.0016 |
| Cr |
0 |
0.5 |
1 |
5 |
10 |
25 |
50 |
|
0.9999 |
0.0017 |
| Cu |
0 |
0.5 |
1 |
5 |
10 |
25 |
50 |
|
1.0000 |
0.0020 |
| Fe |
0 |
0.5 |
1 |
5 |
10 |
25 |
50 |
|
0.9999 |
0.0009 |
| Mg |
0 |
0.5 |
1 |
5 |
10 |
25 |
50 |
|
0.9999 |
0.0006 |
| Mn |
0 |
0.5 |
1 |
5 |
10 |
25 |
50 |
|
0.9996 |
0.0002 |
| Mo |
0 |
0.5 |
1 |
5 |
10 |
25 |
50 |
|
1.0000 |
0.0026 |
| Na |
0 |
0.5 |
1 |
5 |
10 |
25 |
50 |
|
0.9998 |
0.0140 |
| Ni |
0 |
0.5 |
1 |
5 |
10 |
25 |
50 |
|
1.0000 |
0.0021 |
| P |
0 |
0.5 |
1 |
5 |
10 |
25 |
50 |
|
0.9999 |
0.0278 |
| Pb |
0 |
0.5 |
1 |
5 |
10 |
25 |
50 |
|
1.0000 |
0.0056 |
| Si |
0 |
0.5 |
1 |
5 |
10 |
25 |
50 |
|
1.0000 |
0.0024 |
| Sn |
0 |
0.5 |
1 |
5 |
10 |
25 |
50 |
|
0.9999 |
0.0057 |
| Ti |
0 |
0.5 |
1 |
5 |
10 |
25 |
50 |
|
0.9999 |
0.0010 |
| V |
0 |
0.5 |
1 |
5 |
10 |
25 |
50 |
|
0.9999 |
0.0016 |
| Zn |
0 |
0.5 |
1 |
5 |
10 |
25 |
50 |
|
0.9999 |
0.0005 |
Results
D4951 and D5185 methods, which can be observed in Table 4 and Table 5, analyzed QC samples, used and unused oil samples, and spiked samples. Exceptional accuracy and recovery rates of every QC and spiked sample was achieved using the PlasmaQuant® 9100 Elite ICP-OES. Every QC and spike recovery rates are inside 7% of the projected values.
To attain reliable and accurate outcomes and minimize the requirement for recalibration or remeasurement of samples, the ICPOES system has to offer good long-term stability. Long-term stability was assessed by measuring lubricating oil samples and QC 1 with constant aspiration throughout a period of 10 hours.
Table 4. Sample analysis results by ASTM D4951 method. Source: Analytik Jena US
| Element |
QC 1 |
QC 2 |
Passenger car motor oil |
Heavy duty engine oil |
Conc.
(mg/ kg) |
RSD
(%) |
Recovery
(%) |
Conc.
(mg/ kg) |
RSD
(%) |
Recovery
(%) |
Conc.
(mg/kg) |
RSD
(%) |
Conc.
(mg/kg) |
RSD
(%) |
| Ca |
30.00 |
0.8 |
102 |
249.30 |
0.6 |
100 |
1441.53 |
0.7 |
19.13 |
1.3 |
| Mg |
29.76 |
0.5 |
99 |
99.00 |
0.4 |
100 |
477.13 |
0.6 |
0.57 |
2.0 |
| Mo |
29.34 |
2.6 |
95 |
20.00 |
0.4 |
100 |
178.66 |
0.4 |
0.32 |
1.2 |
| P |
28.02 |
0.9 |
96 |
19.90 |
0.9 |
99 |
708.22 |
0.5 |
- |
- |
| Zn |
28.66 |
0.3 |
95 |
98.90 |
0.6 |
100 |
847.39 |
0.2 |
0.23 |
2.3 |
Table 5. Sample analysis results by ASTM D5185 method. Source: Analytik Jena US
| Element |
QC 3 |
Used oil 1 |
Used oil 2 |
Conc.
(mg/
kg) |
Recovery
(%) |
Conc.
(mg/
kg) |
Spiked
Level
(ppm) |
Recovery
(%) |
Conc.
(mg/
kg) |
Spiked
Level
(ppm) |
Recovery
(%) |
| Ag |
3 |
103 |
0.12 |
5 |
100 |
<MDL |
5 |
103 |
| Al |
3 |
104 |
2.63 |
5 |
99 |
17.91 |
5 |
101 |
| B |
3 |
106 |
15.66 |
25 |
106 |
22.4 |
25 |
104 |
| Ba |
3 |
102 |
0.38 |
5 |
101 |
0.84 |
5 |
102 |
| Ca |
3 |
101 |
1355.10 |
25 |
99 |
1566.8 |
25 |
94 |
| Cd |
3 |
99 |
0.14 |
5 |
97 |
<MDL |
5 |
95 |
| Cr |
3 |
102 |
1.14 |
5 |
99 |
1.48 |
5 |
100 |
| Cu |
3 |
103 |
0.41 |
5 |
98 |
6.48 |
5 |
100 |
| Fe |
3 |
101 |
0.45 |
5 |
98 |
9.38 |
5 |
99 |
| Mg |
3 |
101 |
3.38 |
5 |
98 |
10.71 |
5 |
95 |
| Mn |
3 |
101 |
<MDL |
5 |
103 |
<MDL |
5 |
103 |
| Mo |
3 |
102 |
0.12 |
5 |
100 |
377.46 |
5 |
107 |
| Na |
3 |
99 |
0.03 |
5 |
102 |
4.22 |
5 |
99 |
| Ni |
3 |
102 |
<MDL |
5 |
98 |
<MDL |
5 |
100 |
| P |
3 |
98 |
268.83 |
25 |
101 |
321.00 |
5 |
104 |
| Pb |
3 |
101 |
0.06 |
5 |
96 |
7.61 |
5 |
97 |
| Si |
3 |
94 |
2.76 |
5 |
96 |
5.37 |
5 |
96 |
| Sn |
3 |
102 |
<MDL |
5 |
99 |
<MDL |
5 |
101 |
| Ti |
3 |
104 |
0.35 |
5 |
100 |
0.06 |
5 |
102 |
| V |
3 |
102 |
0.83 |
5 |
99 |
0.50 |
5 |
99 |
| Zn |
3 |
101 |
305.07 |
25 |
99 |
378.80 |
25 |
100 |
QC 1 was analyzed after every five samples and zero recalibration was completed. For every element, the recovery of QC 1 was inside 10% of the approved value, with RSD less than 2.5% (Figures 3 and 4). Result reliability was examined by examining two distinct emission lines for all elements. Even lines with a strong probability of spectral interferences, like the P/Cu line pair at 214.9 nm, can be employed for accurate quantification because they are baseline divided by the high-resolution optics of the PlasmaQuant® 9100 Elite (Figure 5). Soot formation did not occur throughout this period without using oxygen; as such, no cleaning of injector, torch and entrance window was required. Those outcomes show that the PlasmaQuant® 9100 Elite ICP-OES can be easily employed for regular oil analysis with superb plasma and signal strength.
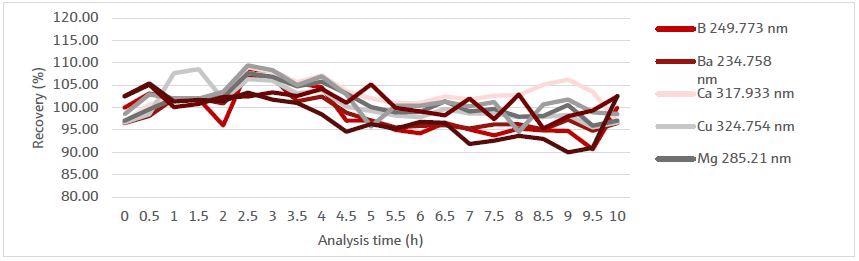
Figure 3. Percentage recoveries of QC 1 sample during a 10-hour measurement period. Image Credit: Analytik Jena US
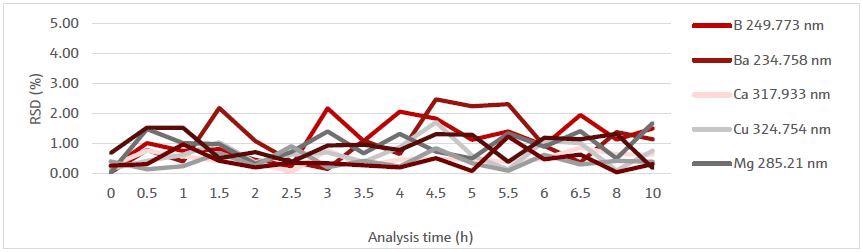
Figure 4. RSD of QC 1 sample during a 10-hour measurement period. Image Credit: Analytik Jena US
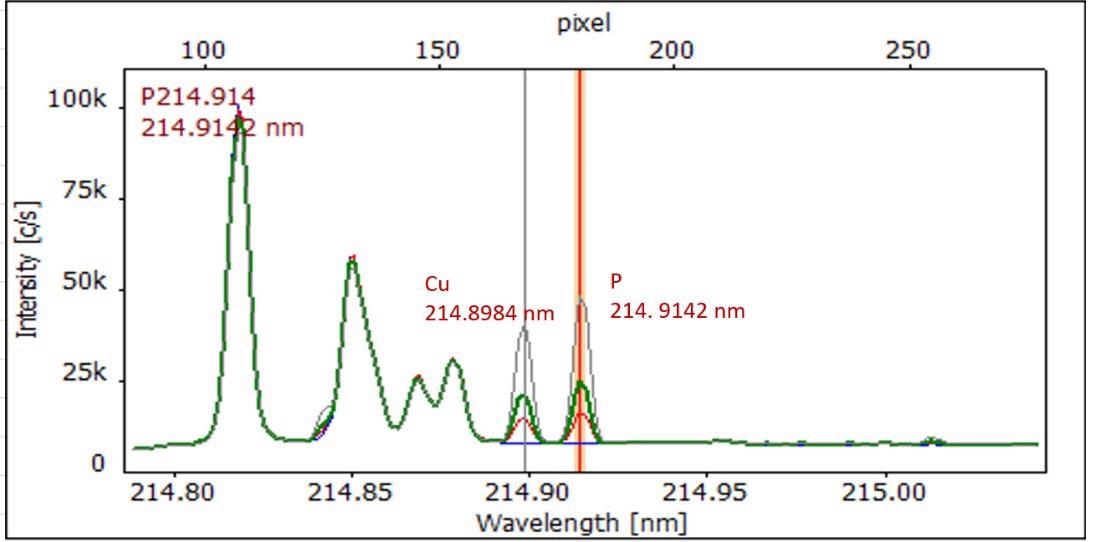
Figure 5. P-recorded spectrum of P/Cu line pair at 214.9 nm with base-line separation for interference-free quantification. Image Credit: Analytik Jena US
Conclusion
The excellent accuracy and precision in lubricating oil analysis has been shown by Analytik Jena’s PlasmaQuant® 9100 Elite ICP-OES in this report. PlasmaQuant® 9100 Elite can easily meet the needs of ASTM 4951 and D5185 methods. The strong plasma and the high matrix tolerance mean PlasmaQuant® 9100 Elite is the perfect instrument for routine oil analysis. The distinctive V shuttle torch reduces upkeep because of minimal carbon deposition.
High resolution optics simply separate analytical lines from interferences, like carbon-based emission; Analytik Jena PlasmaQuant® 9100 Elite ICP-OES offers a simple resolution for assessing lubricating oil precisely, efficiently and timely.

This information has been sourced, reviewed and adapted from materials provided by Analytik Jena US.
For more information on this source, please visit Analytik Jena US.