Chemical mechanical polishing/planarization (CMP) is a technique extensively used throughout the microelectronics industry to smooth surfaces of a substrate by utilizing a mixture of chemical and mechanical forces.
The wafer surface is planarized using an abrasive and corrosive slurry. The CMP slurry is an elaborate combination of chemicals and nano-sized abrasive particles, including surfactants, organic acids, oxidizers, pH adjusters and complexing agents.
The overall process is affected in numerous ways by the particle size distribution of the abrasive. The material removal rate (MRR) is impacted by the average size of the abrasive, with some data and models indicating an uninhibited relationship, while others advocate for an inverse relationship.1,2
The distribution width is also crucial, in an atypical fashion, with both a size dependent and number dependent region producing opposite effects on MRR.2 Thus, with large particle counts (LPCs), detrimental effects on yield are possible, resulting in scratches and defects.3,4
Dispersion stability and affinity of particles to wafer surfaces5 are impacted by the surface charge (zeta potential) of the abrasive particles.
A wide range of abrasive suspensions deployed in CMP slurries was examined using the Nicomp® dynamic light scattering (DLS) system to establish mean size, width of distribution and zeta potential.
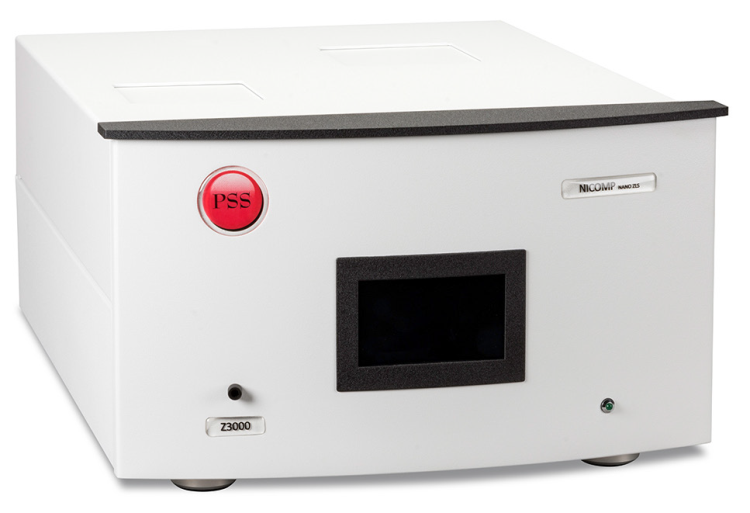
Figure 1. Nicomp DLS system. Image Credit: Entegris
The Nicomp system (Figure 1) used in each study was fitted with a 35 mW 658 nm laser and two detectors; a high gain avalanche photodiode (APD) for particle size and a photomultiplier tube (PMT) for zeta potential.
The instrument was also equipped with a multi-angle goniometer, which has the capacity to measure particle size across the spectrum of angles.
Dilution Effects
When using DLS the majority of sample preparation investigations commence when determining the effect of dilution.6 Even when correcting for viscosity, all abrasives used in this study are overly concentrated to measure without dilution.
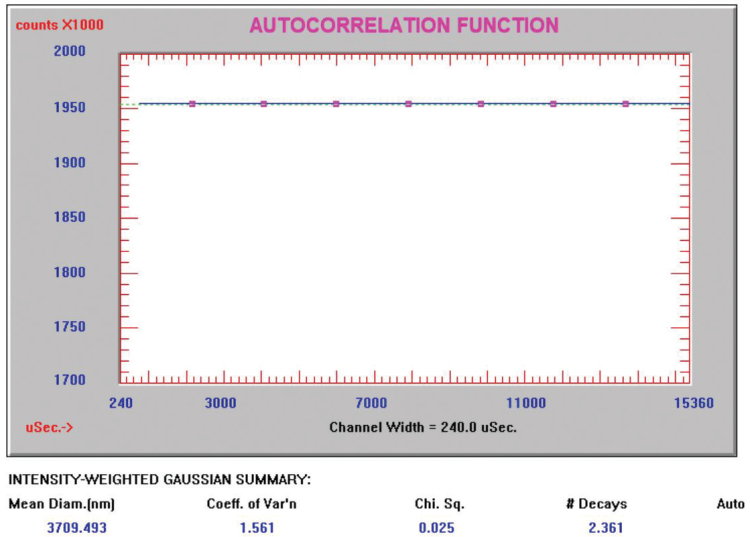
Figure 2. Ceria abrasive correlation function diluted 2:1. Image Credit: Entegris
This point is illustrated in Figure 2, exhibiting the raw data correlation function for a ceria abrasive diluted 2:1. In Figure 2, there is just a straight line, no curve to fit, which indicates either no particle motion or no light scattering from Brownian motion materializing at the detector.
After determining the necessity to dilute, it is necessary to ascertain the proper dilution ratio. Even when factoring in viscosity, it is recommended to check for errors due to either restricted diffusion or multiple scattering. Both mechanisms add concealed anomalies to the final calculation of results.
Multiple scattering presents itself when the scattered light from a diffusing particle associates with one or more additional particles before reaching the detector. Multiple scattering is probable when the mean size increases and the width of the distribution (polydispersity index, or PI) decreases with dilution.
Restricted diffusion takes place when the translational diffusion is impeded by nearby particles showing up. Restricted diffusion is likely when the mean size decreases with dilution, while minimal change is noted in the width of the distribution or PI.
Using the Nicomp system, a dilution study of an alumina-based abrasive was conducted across a range of dilution ratios. For instance, 100 µL of the sample was diluted into 99.9 mL of DI water and is recorded as D1000. Figure 3 illustrates that the results were reasonably stable across the range of dilutions, but size and Pl increased at higher concentrations.
Table 1. Source: Entegris
| Dilution |
Size |
PI |
| D1000 |
98.9 nm |
0.086 |
| D250 |
99 nm |
0.089 |
| D125 |
99.1 nm |
0.099 |
| D62.5 |
99.3 nm |
0.092 |
| D31.25 |
99.3 nm |
0.087 |
| D15.6 |
99.6 nm |
0.096 |
| D7.8 |
99.5 nm |
0.094 |
Size and PI vs. Dilution
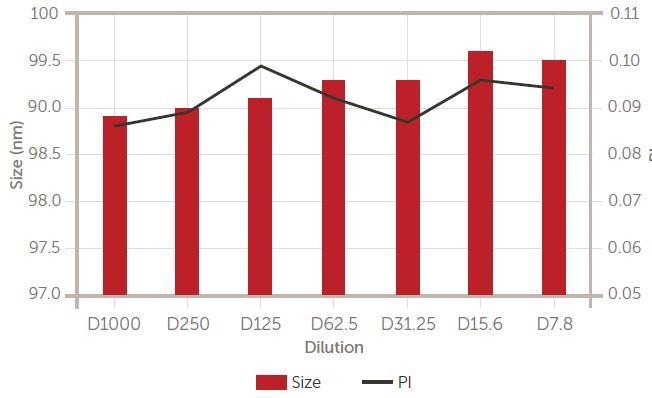
Figure 3. Alumina dilution study. Tabular and graphical results. Lower: size (left Y axis) and PI (right Y axis). Image Credit: Entegris
While this study may be telling and informative concerning the effect of restricted diffusion, some analysts may decide all results are close enough that any of these dilution ratios are passable.
A dilution study of a ceria-based abrasive offered evidence of multiple scattering impacting results. For this sample, the mean size reported decreased at higher concentrations while the PI increased, as shown in Figure 4.
Table 2. Source: Entegris
| Dilution |
Size |
PI |
| D1000 |
133 nm |
0.112 |
| D100 |
131.1 nm |
0.111 |
| D10 |
122.9 nm |
0.176 |
| D5 |
114.2 nm |
0.181 |
Size and PI vs. Dilution
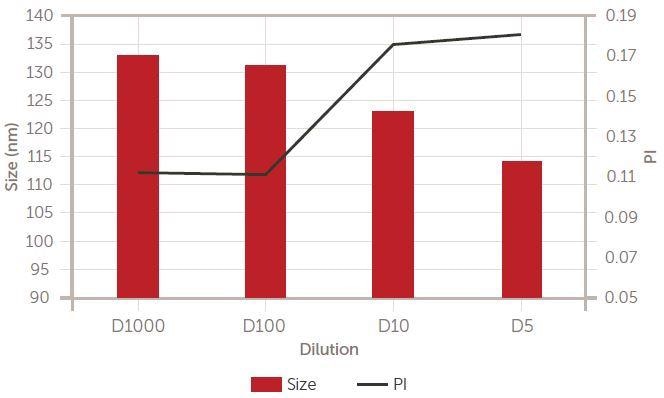
Figure 4. Ceria dilution study. Tabular and graphical results. Lower: size (left Y axis) and PI (right Y axis). Image Credit: Entegris
Distribution Width
The width of the abrasive particle size distribution (PI) also influences the MRR. The Nicomp system was used for the analysis of two colloidal silica abrasives.
The smaller size abrasive has a significantly wider distribution than the larger size abrasive with a narrower distribution. Results in Figure 5 exhibit the large difference in width of particle size distribution.
Table 3. Source: Entegris
| Sample |
Mean |
PI |
| Narrow |
80.9 nm |
0.008 |
| Wide |
20.1 nm |
0.325 |
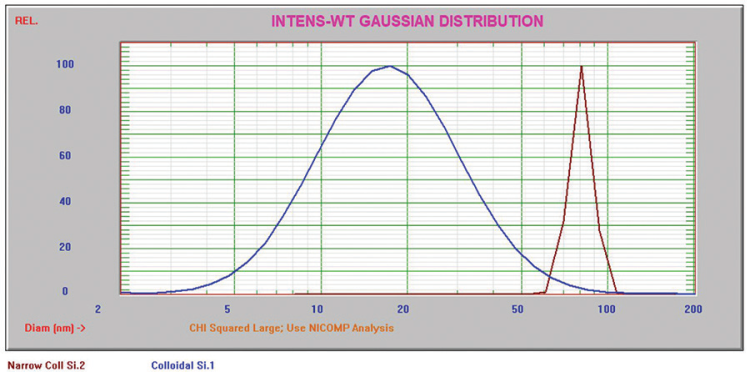
Figure 5. Width of distribution difference in two silica abrasives. Image Credit: Entegris
Monomodal vs. Multimodal
The Nicomp system utilizes two algorithms to transform the correlation function into a particle size distribution – Gaussian (monomodal) and Nicomp (multimodal).
Figure 6 displays the Nicomp system bimodal result for colloidal silica. The manufacturer’s specification sheet for this abrasive notes a primary and secondary peak near to the sizes in the range seen here.
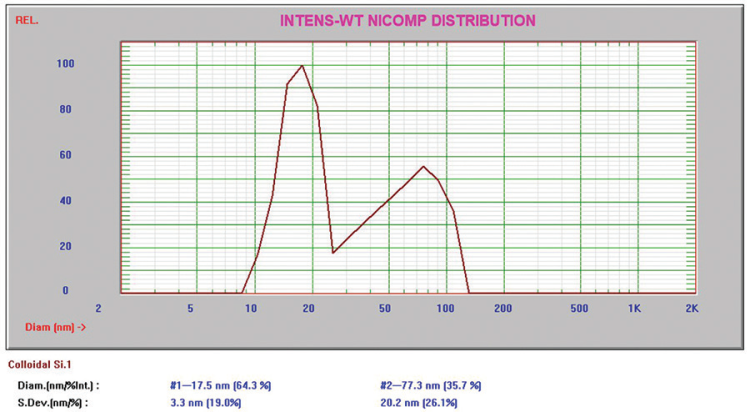
Figure 6. Bimodal colloidal silica abrasive. Image Credit: Entegris
Range of Sizes
The dynamic range of DLS is in the region of 1 nm to 1+ µm (system and sample dependent). This dynamic range is appropriate for the determination of the mean size relative to the wide range of abrasives used for CMP slurries.
Figure 7 illustrates the broad spectrum of reported particle size distributions for four types of abrasives; colloidal silica, alumina, ceria and fumed silica.
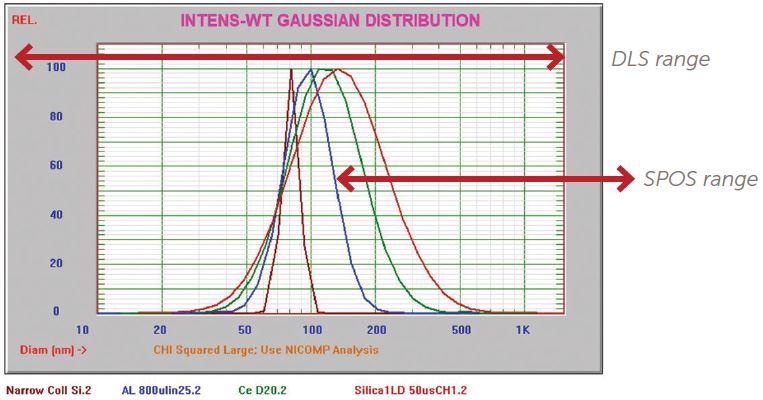
Figure 7. Range of size distributions for various abrasives. Image Credit: Entegris
Large Particle Counts
While DLS is the favored method for establishing the mean size of submicron abrasive slurries, this process is not the optimal way to measure LPCs.
DLS and other ensemble light scattering techniques, such as laser diffraction, can evaluate multimodal distributions, but the resolution is insufficient for the detection of a small number of particles at the tails of the distribution.
LPCs are usually observed using liquid particle counters while utilizing the method of single particle optical sizing (SPOS) that offers the advantage of concentration data in particles/mL.
The AccuSizer® lab and Mini online SPOS systems have shown to be the most sensitive and accurate methodology for LPCs.8–12 The distribution ranges exhibited in Figure 8 clarify why there are multiple AccuSizer Mini systems for tracking LPC tails.
Varying size ranges, concentration limits and dilution fluidics are necessary to optimize the measurement for a broad range of abrasive types.
Zeta Potential
Submicron suspensions like these abrasives tend to be electrostatically stabilized in order to manipulate the size distribution and control the shelf life of the product.13 By increasing the surface charge of the particles, they push back against each other like magnets and never get close enough to cluster up.
The particles being positively or negatively charged is inconsequential. Only the absolute magnitude is key. Numerous abrasive types can be formulated to obtain either negative or positive charge depending on the chemistries used.
To establish the zeta potential, two alumina abrasives were analyzed by the Nicomp system. The results displayed in Figures 8 and 9 exhibit one negatively and one positively charged suspension.
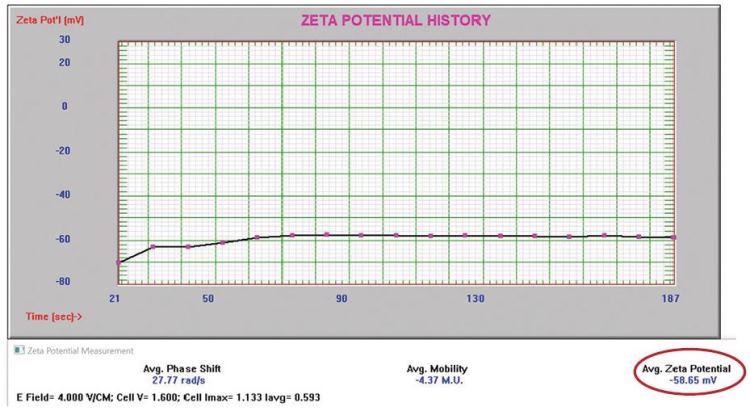
Figure 8. Negatively charged alumina abrasive zeta potential. Image Credit: Entegris
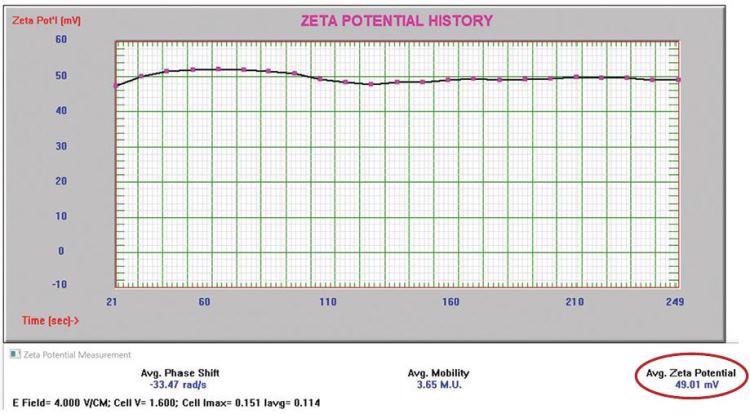
Figure 9. Positively charged alumina abrasive zeta potential. Image Credit: Entegris
It is considered vital to circumvent the pH where the zeta potential equals zero, known as the isoelectric point,14 or IEP.
The positively charged alumina slurry exhibited in Figure 9 was titrated from positive to negative charge to establish the IEP. The pH was modified using 0.1 M KOH titrating from lower to higher pH. The results are displayed in Figure 10.
Table 4. Source: Entegris
| pH |
Zeta potential |
| 7.75 |
36.97 |
| 8.27 |
30.84 |
| 8.52 |
25.9 |
| 9.08 |
14.1 |
| 9.46 |
-1.72 |
| 10 |
-22.49 |
Zeta Potential
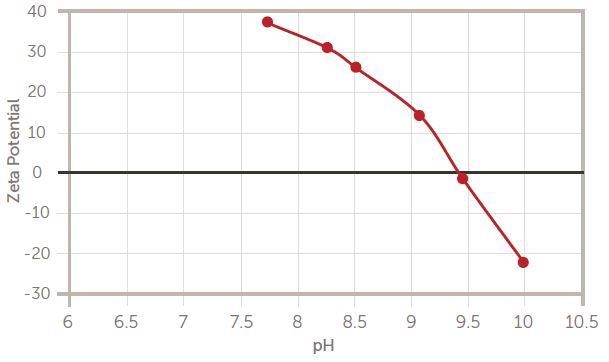
Figure 10. IEP titration of alumina slurry. Image Credit: Entegris
The particle size increased substantially from a mean of 78.4 nm to 3735.6 nm after moving through the IEP at pH 9.4. Yet, in the absence of a charge less than about 10 mV, this is predetermined because the particles have the tendency to agglomerate.
Conclusions
For particle size and zeta potential analysis of abrasives used for CMP slurries, dynamic light scattering is the favored method. Appropriate and precise sample preparation is crucial to produce the most accurate and repeatable results.
The Nicomp DLS system is optimal for taking the mean size and zeta potential measurements of submicron abrasives. The AccuSizer SPOS is the technique preferred for establishing LPC tails in abrasives and final CMP slurries.
References
- Basim, G., et al., Effect of particle size of chemical mechanical polishing slurries for enhanced polishing with minimal defects, J. Electrochem. Soc., vol. 147
- Lou, J. and Dornfeld, D., Effects of Abrasive Size Distribution in Chemical Mechanical Planarization: Modeling and Verification, IEEE Transactions on Semiconductor Manufacturing, Vol. 16, No.3, Aug. 2003
- Remsen, E. et al., Analysis of Large Particle Count in Fumed Silica Slurries and Its Correlation with Scratch Defects Generated by CMP, Journal of The Electrochemical Society, 153 (5) G453-G461(2006)
- Kim S.-K. et al., Effect of calcination time on the physical properties of synthesized ceria particles for the shallow trench isolation chemical mechanical planarization process, Journal of Ceramic Processing Research, Vol. 7, No. 1, pp. 53-57 (2006)
- Sorooshian, A., et al., Effect of Particle Interaction on Agglomeration of Silica-Based CMP Slurries, MRS Proceedings, Vol. 816, 2004
- Entegris Technical Note – DLS Sample Preparation
- Entegris Technical Note – DLS Data Interpretation
- Entegris Application Note – Detecting Tails in CMP Slurries
- Entegris Application Note – SPOS vs. Laser Diffraction
- Entegris Application Note – Ceria CMP Slurry Monitoring
- Entegris Application Note – Detecting Tails in CMP Slurries
- Entegris Application Note – CMP Slurry Filter Testing
- Entegris Application Note – Dispersion Stability
- Entegris Application Note – Isoelectric Point (IEP) Determination

This information has been sourced, reviewed and adapted from materials provided by Entegris.
For more information on this source, please visit Entegris.