Diesel engines and their impact on the environment, in contrast to gasoline engines, is a matter of serious dispute when entering the debate about the cause of and measures against anthropogenic climate change.
While more of the greenhouse gas CO2 is produced by the combustion of gasoline, diesel engines typically exhaust more nitrogen oxides.
The nitrogen oxide molecules NO and NO2, which are included in the general term NOX, cause smog and acid rain in large concentrations and contribute to the damage of the ozone layer, making them very relevant for discussions concerning air pollution.
Consequently, the aim is to reduce the NOX exhaust in diesel engines on several different levels. A number of countries have agreed on emission norms that introduce upper limits for NOX discharge in diesel vehicles.
One of the most encouraging approaches towards reducing emissions in diesel engines is known as a selective catalytic reduction (SCR) of NOX converting nitrogen oxides to nitrogen gas and water after the combustion process[1].
NOX exhaust reduction is dependent on reactions with the molecule urea ((NH2)2CO) that is fed into the exhaust by way of a 32% urea solution in water (AUS 32) that is dispersed into the exhaust from a separate tank.
Up to 90% of the NOX in the exhaust is converted into environmentally friendly compounds via the reactions inside the SCR catalyst compartment. This solution which is now established worldwide is registered under the brand name AdBlue®, held by the German Association of the Automotive Industry (VDA).
Figure 1 illustrates the schematic overview of the NOx reduction mechanism in diesel vehicles while Figure 2 describes the phases occurring throughout the NOx reduction process.
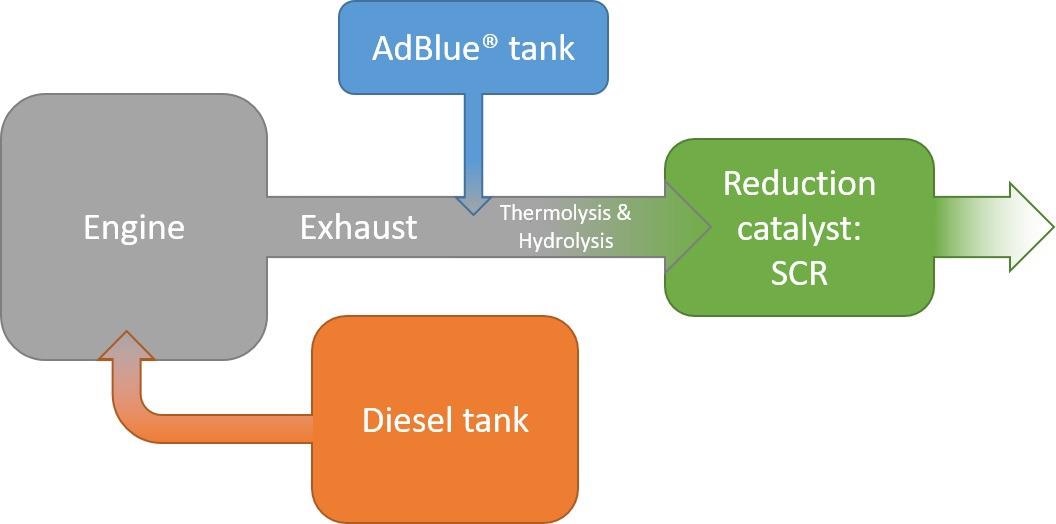
Figure 1. NOx reduction in diesel vehicles following the selective catalytic reduction (SCR) mechanism with AdBlue. Image Credit: Mettler-Toledo Ltd

Figure 2. Chemicals and reactions involved in the NOx reduction in diesel vehicles. NOx is ultimately converted to nitrogen gas (N2) and water (H2O) by reactions involving urea ((NH2)2CO). Image Credit: Mettler-Toledo Ltd
The quality assessment of AUS 32 solutions is detailed in the ISO standard 22241-2[2] and the relative acceptance limits are provided in ISO 22241-1[3].
The various test methods controlled by ISO 22241-2 are outlined in annexes B – J. Amongst these criteria, the following can be established utilizing METTLER TOLEDO instruments:
- Annex C: Refractive Index and Determination of Urea Content by Refractive Index
- Annex D: Determination of Alkalinity
- Annex E: Determination of Biuret Content
- Annex F: Determination of Aldehyde Content
- Annex G: Determination of Insoluble Matter Content by Gravimetric Method
- Annex H: Determination of Phosphate Content by Photometric Method
As Annex H did not undergo testing for this study it is not treated any further. However, with the addition of extra equipment, annex H could be easily performed using a METTLER TOLEDO UV/Vis spectrophotometer.
Annex B: determination of urea by total nitrogen, Annex I: identifying trace elements (Al, Ca, Cr, Cu, Fe, K, Mg, Na, Ni, P, and Zn) by ICP-OES method, and Annex J: determination of identity by FTIR spectrometry method intrinsically performed using METTLER TOLEDO instruments.
ANNEX C: Refractive Index and Determination of Urea Content by Refractive Index
Annex C of ISO 22241-2 details the identification of the refractive index of AUS 32 solutions. The content of urea as the principal component of AUS 32 solutions is a performance factor of the refractive index and can be measured according to the following equation:
WU = (−742.74788 ∙ (ηD20)2 + 2669.65361 ∙ (ηD20) − 2238.7991) − B
When WU is the mass fraction of urea identified as a %, ηD20 is the refractive index at 20°C with the sodium D line as the wavelength of reference and B is the mass fraction of biuret (see 2.3 and 4.3: Biuret content). B is typically small and biuret has an equal refractive index as urea per unit of mass.
AUS 32 solutions usually contain 32% urea. The urea content can differ in a range of around 31.5 – 35%. Comparable refractive indices fluctuate in the ranges around 1.379 – 1.385.

Figure 3. R5 refractometer used for AUS 32 refractive index measurement. Image Credit: Mettler-Toledo Ltd
ANNEX D: Determination of Alkalinity
Minor components of AUS 32 solutions include ammonia and other amines with a combined content typically less than 0.5% (mass fraction). These alkaline ingredients make up the alkalinity of the sample solution.
The alkalinity is established via a potentiometric titration with 0.1 M HCl to the endpoint pH 5.7 and rendered in terms of percent ammonia (NH3). The alkalinity composition of AUS 32 samples is described further in[4].

Figure 4. T9 autotitrator with InMotion autosampler used for AUS 32 alkalinity determination. Image Credit: Mettler-Toledo Ltd
ANNEX E: Determination of Biuret Content
Small amounts of biuret can always be found in concentrated urea solutions. This compound displays the same refractive index as urea per unit of mass. Therefore, the biuret content must be known in order to establish the concentration of the urea by refractive index measurement.

Figure 5. Formation of biuret from urea. Image Credit: Mettler-Toledo Ltd

Figure 6. UV7 spectrophotometer used for AUS 32 biuret determination.Image Credit: Mettler-Toledo Ltd
For the determination of the biuret, UV/V is a spectrophotometer with a 5 cm path length, and a wavelength of 550 nm is selected. Before the sample measurement is taken, a calibration predicated on a series of biuret standard solutions with known concentrations is carried out.
The calibration primarily served as a linearity check and should be conducted once a year. A calibration factor FC is established using the following equation:

Where mb,i is the biuret content of the matching standard i in milligrams and Ai is the (blank compensated) absorbance of basic solution i.
The biuret content is measured utilizing a so-called day-factor FD, which is established on the measurement of a singular biuret standard solution. The day factor is acquired according to the following equation:

Where A is the absorbance measured in the standard solution, the day-factor FD should be pitched against to the calibration factor FC. The two factors should not diverge from each other by more than 5%.
The biuret content in the sample can then be established using the day-factor with the following equation:

Where FD is the day-factor, A is the absorbance of the sample measured and ms is the sample size in grams that was utilized for the preparation of the sample. The conversion factor of 2.5 functions as a representation of the sample preparation and to obtaining the correct result unit, which is presented as a % (mass fraction).
The process is further detailed in [5]. The biuret content identified via UV/Vis is also required for identifying urea according to Annex B or Annex C.
ANNEX F: Determination of Aldehyde Content
AUS 32 solutions generally contain between 0.5 – 10 mg/kg of free or bound aldehydes, which are shown as formaldehyde. The amount of free and bound aldehydes can be established by utilizing a UV/Vis spectrophotometer at a wavelength of 565 nm.
The content determination depends on a 6-point calibration utilizing a dilution series produced from a formaldehyde standard solution. The precise concentration of the standard formaldehyde solutions should be identified potentiometrically using the sulfite procedure[6] [7].

Figure 7. CuvetteChanger used for the automation of UV/Vis measurements. Image Credit: Mettler-Toledo Ltd
Using the calibration results, a calibration factor FC is calculated according to the following equation:

Where the content of formaldehyde is represented as mHCHO,i of the relative dilution step, and Ai is the measured absorbance of the consequent dilution step.
The formaldehyde content in the sample can then be established based on the calibration factor FC with the following equation:

Where WA is the aldehyde content characterized as % formaldehyde (mass fraction), A is the absorbance measured and ms is the sample size in grams that was utilized for the sample preparation. The process is detailed further in[8].
ANNEX G: Determination of Insoluble Matter Content by Gravimetric Method
Small insoluble particles can be found in AUS 32, typically originating from insoluble impurities in urea. The exhaust reduction may be compromised by particles blocking the injection nozzle or accumulating and covering the solid catalyst.

Figure 8. XPR205 analytical balance with filter weighing tray. Image Credit: Mettler-Toledo Ltd
The insoluble matter content is established by weighing the residuals of a portion of AUS 32 that has been fed through a membrane with 0.8 µm pore size for vacuum filtering. A comprehensive description of the procedure is presented in[9].
The insoluble matter content in mg/kg is calculated using the following equation:

Where WIns make up the insoluble matter in mg/kg; mFL is the mass of the dry; empty filter content in milligrams; mFR is the mass of the dry filter and sample deposit in milligrams; and ms is the size of the sample in grams.
Setup and Materials
Materials
Table 1 and Table 2 display all the instruments and accessories that are utilized for AUS 32 testing. The relative Annexes illustrate which type of analysis is used for the material.
Table 1. Specific instruments and accessories used for AUS 32 testing according to ISO 22241-2. Source: Mettler-Toledo Ltd.
| Instruments and accessories |
Part number |
Used in Annex |
| C |
D |
E |
F |
G |
| Refractometry Excellence R5 |
30474904 |
|
|
|
|
|
| Titration Excellence |
T5
T7
T9 |
30252672
30252675
30252676 |
|
|
|
|
|
| UV/VIS Excellence Spectrophotometer UV5/UV7 |
30254725
30254726 |
|
|
|
|
|
| XPR205DR Analytical balance |
30355415 |
|
|
|
|
|
| XPR203SN Precision balance |
30316540 |
|
|
|
|
|
| HX204 Halogen moisture analyzer |
30019875 |
|
|
|
|
|
| Aluminum sample pans |
00012865 |
|
|
|
|
|
| InMotion Flex Base |
30094121 |
|
|
|
|
|
| InMotion Flex Rack Kit 100 mL |
30094126 |
|
|
|
|
|
| Manual titration kit |
51109220 |
|
|
|
|
|
| 2 x Dosing units |
51109220 |
|
|
|
|
|
| 1 x Burette DV1010 10 mL |
51107501 |
|
|
|
|
|
| 1 x Burette DV1020 20 mL |
51107502 |
|
|
|
|
|
| DGi111-SC Combined pH glass electrode |
51109500 |
|
|
|
|
|
| DM143-SC Platinum double pin electrode |
51109220 |
|
|
|
|
|
| Pt1000 Temperature probe |
51109220 |
|
|
|
|
|
| Thermostatable beaker |
51107497 |
|
|
|
|
|
| Titration beakers PP 100 mL |
00101974 |
|
|
|
|
|
| Pipette LTS L-5000XLS |
17011790 |
|
|
|
|
|
| Cuvettes, quartz glass, 10 mm |
30258738 |
|
|
|
|
|
| Cuvette holder long path lengths |
30254738 |
|
|
|
|
|
| Cuvettes, quartz glass, 50 mm |
30258739 |
|
|
|
|
|
| CuvetteChanger |
30236313 |
|
|
|
|
|
| Rainin pipette and tips L-10ML |
27060051 |
|
|
|
|
|
Table 2. Non-specific instruments and accessories used for AUS 32 testing according to ISO 22241-2. Source: Mettler-Toledo Ltd.
| Instruments and accessories |
Used in Annex |
| A |
B |
C |
D |
E |
| Plastic Pasteur pipettes |
|
|
|
|
|
| Glass microfiber filter pads, diameter = 70 mm, particle retention = 0.7 μm |
|
|
|
|
|
| Tissue wipes |
|
|
|
|
|
| Equipment for vacuum filtration, suitable for 70 mm filter pads |
|
|
|
|
|
| Flat-tipped tweezers |
|
|
|
|
|
| Spatula |
|
|
|
|
|
| Erlenmeyer flask, 500 mL |
|
|
|
|
|
| Volumetric flasks and glass beakers |
|
|
|
|
|
| Water bath |
|
|
|
|
|
| Any pH meter or autotitrator |
|
|
|
|
|
| External thermostat for 0 °C applications |
|
|
|
|
|
| Drying oven |
|
|
|
|
|
Chemicals
Table 3 details all the chemicals that are utilized for AUS 32 testing. The relative Annexes demonstrate which type of analysis is used for the substance.
Table 3. Substances used for AUS 32 testing according to ISO 22241-2. Source: Mettler-Toledo Ltd.
| Substance |
Annex |
| Hydrochlochloric acid (HCl), c = 0.01 mol/L |
D |
| Tris(hydroxymethyl)aminomethane, THAM, c = 0.01 mol/L |
| DIN(19266)/NIST buffer solutions pH 4.006, 6.865 and 9.180 |
| Biuret reference standard |
E |
| Copper sulfate pentahydrate (CuSO4•4 H2O) |
| Potassium sodium tartrate tetrahydrate (KNaC4H4O6•4 H2O) |
| Sodium hydroxide (NaOH) |
| Hydrochloric acid (HCl), c = 0.1 mol/L |
| Potassium hydroxide (KOH) |
| Sulfuric acid (H2SO4), 96% |
F |
| Formaldehyde standard solution |
| Chromotropic acid |
| Iodine (I2) solution, c = 0.05 mol/L |
| Sodium sulfite (Na2SO3) solution, c = 1 mol/L |
| Acetic acid (CH3COOH), c = 1 mol/L |
| Sodium carbonate (Na2CO3) solution, c = 1 mol/L |
| Sodium thiosulfate (Na2S2O3) solution, c = 0.1 mol/L |
| Deionized water |
C, D, E, F, G |
| Acetone |
C |
Preparation
The preparation steps detailed below must be followed prior to the analyses:
- Refractometers must be validated with deionized water and air.
- Calibration of the DGi111-SC electrode should be carried out using the DIN(19266)/NIST buffer solutions before the alkalinity determination.
- Standardization of titrant HCl, c = 0.01 mol/L should be done against a 0.01 mol/L THAM standard solution. The technique can be found in METTLER TOLEDO application note M470[10].
- Standardization of the titrant I2, c = 0.05 mol/L should be performed against a 0.1 mol/L Na2S2O3 standard solution.
Results and Discussion
This section details the test results achieved. The results are examined in line with the acceptance limits that are detailed in ISO 22241-1.
In addition, repeatability of the individual test methods is approximated and compared to the approximate repeatability presented in ISO 22241-2. The repeatability r was measured in line with ISO 4259[11] using the following equation:
r = k ∙ √2 ∗ s
Where the coverage factor is signified by k for the conversion to the confidence limit, in this instance to a double-sided 95% probability level, possessing a value of 1.96, and s is the basic deviation of the measured values.
Refractive Index and Urea Content
The refractive indices of a series of 6 AUS 32 samples were evaluated by utilizing a R5 refractometer (METTLER TOLEDO). The relative urea mass fractions were worked out using the equation given in Annex C, including the mass fraction of biuret, which is determined under section header ‘Biuret Content.’
Table 4 presented an overview of the results achieved.
Table 4. Measured refractive indices and urea weight fractions of an AUS 32 sample. A biuret weight fraction of 0.205% (see 4.3 Biuret content) was included in the urea weight fraction calculation. Source: Mettler-Toledo Ltd.
| |
nD20 |
wU [%] |
| 1 |
1.38235 |
32.081 |
| 2 |
1.38235 |
32.081 |
| 3 |
1.38237 |
32.093 |
| 4 |
1.38238 |
32.099 |
| 5 |
1.38239 |
32.105 |
| 6 |
1.38240 |
32.112 |
| Mean |
1.38237 |
32.095 |
| s |
0.00002 |
0.013 |
| r |
0.00006 |
0.036 |
The measurements and corresponding calculations performed generate urea content which is considerably near to 32.5%. Both the measured refractive index and urea content 14 lies well within the range tolerated in ISO 22241-1.
The approximate repeatability r of 0.036% (mass fraction) is significantly better than the repeatability expected of 0.154% as detailed in ISO 22241-2 for the urea content.

Figure 9. Measured refractive index and urea content of an AUS 32 sample. The average of the measured values is indicated with a solid blue line. Dashed blue lines indicate the boundaries of the 95% confidence interval and red lines are the limits given in ISO 22241-1. Image Credit: Mettler-Toledo Ltd
In the series of refractive index measurements exhibited, a small trend towards higher nD20 values can be seen.
The evaporation of water during the time of analysis could be a determining factor. To prevent such a trend, the refractive index should be recorded immediately after the sampling, or the sample should be safeguarded against the evaporation of water.
Alkalinity
A potentiometric titration to an end point of pH 5.7, utilizing a T9 autotitrator (METTLER TOLEDO), was used to determine the alkalinity of AUS 32 sample series made up of 6 samples. The result is presented as the ammonia content in % (mass fraction). Table 5 highlights the results achieved for a series of 6 AUS 32 samples.
Table 5. Sample size and alkalinity given as content NH3 in % (mass fraction). Source: Mettler-Toledo Ltd.
| |
Sample size [g] |
Content NH3 [%] |
| 1 |
1.4708 |
0.064 |
| 2 |
1.5009 |
0.062 |
| 3 |
1.5029 |
0.062 |
| 4 |
1.4725 |
0.064 |
| 5 |
1.5198 |
0.063 |
| 6 |
1.4775 |
0.063 |
| Mean |
|
0.063 |
| s |
|
0.001 |
| r |
|
0.003 |
The ammonia content determined in this setup was as low as 0.065% (mass fraction). This conforms to the maximum level of 0.2% given in ISO 22241-1. The estimated repeatability of 0.003% (mass fraction) is clearly better than the expected repeatability of 0.077% given in ISO 22241-2.

Figure 10. Measured alkalinity of an AUS 32 sample. The average of the measured values is indicated with a solid blue line. Dashed blue lines indicate the boundaries of the 95% confidence interval and red line represents the upper limit given in ISO 22241-1. Image Credit: Mettler-Toledo Ltd
Biuret Content
A calibration curve predicated on six biuret standard solutions with various concentrations was measured on the spectrophotometer. The six basic solutions had biuret contents of 1.6, 4, 8, 12, 16 and 20 mg, each in a 50 mL volumetric flask which contained copper sulfate and an alkaline solution of potassium sodium tartrate.
The results of the calibration factor determination are presented in Table 6.
Table 6. Contents in mg and corresponding absorbances of biuret standard solutions obtained during the calibration. Source: Mettler-Toledo Ltd.
| Biuret standard Nr. |
Amount of biuret contained [mg] |
Measured absorbance [A] |
| 1 |
1.6 |
0.06078 |
| 2 |
4 |
0.10837 |
| 3 |
8 |
0.20644 |
| 4 |
12 |
0.30414 |
| 5 |
16 |
0.40685 |
| 6 |
20 |
0.49183 |
| FC |
39.0 mg |
| R2 |
0.9992 |

Figure 11. Calibration curve for the biuret determination. Image Credit: Mettler-Toledo Ltd
Before taking the sample measurement, a day-factor FD was established by measuring the absorbance of a biuret standard solution. This standard solution held 8 mg of biuret in 50 mL of an aqueous solution comprised of copper sulfate and potassium sodium tartrate.
The day-factor was immediately recorded before the sample determination and the result is exhibited in Table 7.
Table 7. Day-factor determination using a 8 mg biuret standard solution. Source: Mettler-Toledo Ltd.
| Biuret standard content [mg] |
Absorbance [A] |
| 8 |
0.21163 |
| FD |
37.1 mg |
Sample measurements were conducted using the same setup as employed for the calibration and day-factor determination. The results are exhibited in Table 8. In order to significantly reduce interferences from ammonia, the sample solution was initially neutralized with hydrochloric acid to a pH value of 7.0.
Table 8. Measured absorbances and resulting biuret contents given in % (mass fraction). Source: Mettler-Toledo Ltd.
| Sample Nr. |
Absorbance [A] |
Biuret content [%] |
| 1 |
0.18795 |
0.176 |
| 2 |
0.18523 |
0.174 |
| 3 |
0.18575 |
0.174 |
| 4 |
0.18395 |
0.173 |
| 5 |
0.18594 |
0.175 |
| 6 |
0.18799 |
0.176 |
| Mean |
0.18614 |
0.175 |
| s |
0.00158 |
0.001 |
| r |
0.00439 |
0.004 |
The calibration curve measured in this study exhibits excellent linearity with an R2 of 0.9992. The day-factor diverges from the calibration factor by 3.1%, which remains in line with ISO 22241-2. The approximated repeatability of 0.004% (mass fraction) exceeds the expected repeatability of 0.008% detailed in ISO 22241-2.

Figure 12. Measured biuret content of an AUS 32 sample. The average of the measured values is indicated with a solid blue line. Dashed blue lines indicate the boundaries of the 95% confidence interval and red line represents the upper limit given in ISO 22241-1. Image Credit: Mettler-Toledo Ltd
Aldehyde Content
Determination of the formaldehyde standard stock solution’s concentration was carried out using the sulfite procedure in a series of 6 samples which amounted to 4.59 mg/L.
A part of chromotropic acid, as well as 20 mL of concentrated sulfuric acid, were introduced to all the standards in the dilution series. The formaldehyde contents that ensued, as well as the measured absorbances of the diluted standards, are presented in micrograms in Table 9.
Table 9. Contents in μg and absorbances of the formaldehyde standards in the dilution series. Source: Mettler-Toledo Ltd.
| Formaldehyde content [μg] |
Absorbance [A] |
| 0.92 |
0.02974 |
| 2.30 |
0.04430 |
| 4.59 |
0.08202 |
| 9.18 |
0.15384 |
| 22.95 |
0.32732 |
| 45.90 |
0.64374 |
| FC |
67.01 mg/A |
| R2 |
0.9995 |

Figure 13. Calibration curve for the aldehyde determination. Image Credit: Mettler-Toledo Ltd
The calibration curve measured in this study exhibits excellent linearity with an R2 of 0.9995. The sample measurements were conducted using the same assembly as used for the calibration. The results are presented in Table 10 and Figure 14.
Table 10. Aldehyde determination in an AUS32 sample given in mg/kg Formaldehyde. Source: Mettler-Toledo Ltd.
| |
Absorbance [A] |
Aldehyde content [mg/kg] |
| 1 |
0.06664 |
0.592 |
| 2 |
0.06794 |
0.603 |
| 3 |
0.06769 |
0.601 |
| 4 |
0.06580 |
0.584 |
| 5 |
0.06756 |
0.600 |
| 6 |
0.06544 |
0.581 |
| Mean |
0.06685 |
0.594 |
| s |
0.0011 |
0.009 |
| r |
0.0030 |
0.025 |
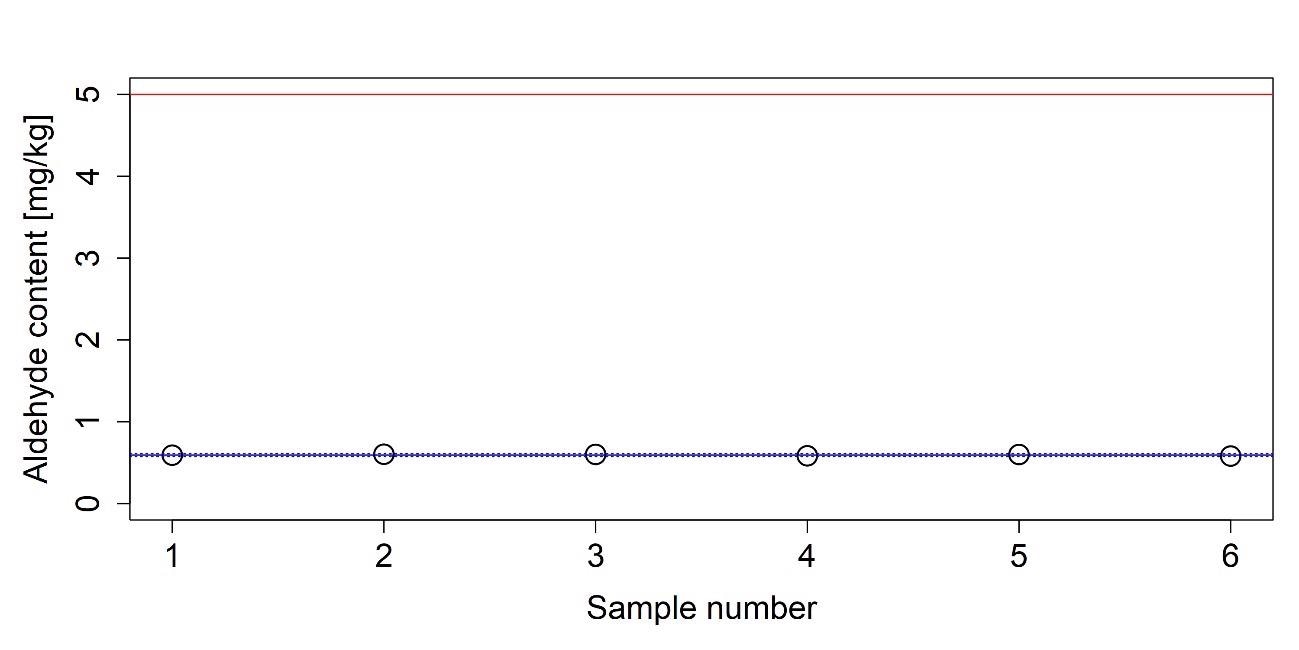
Figure 14. Measured aldehyde content of an AUS 32 sample. The average of the measured values is indicated with a solid blue line. Dashed blue lines indicate the boundaries of the 95% confidence interval and red line represents the upper limit given in ISO 22241-1. Image Credit: Mettler-Toledo Ltd
Insoluble Matter Content
The insoluble matter content was established by filtering a section of the AUS 32 sample and weighing the filter pad prior to the filtration as well as after. The results of the insoluble matter determination are presented in Table 11.
Table 11. Masses of the membrane filter before and after filtration in mg, sample size in g and resulting insoluble matter content in mg/kg. Source: Mettler-Toledo Ltd.
| |
mFL [mg] |
mFR [mg] |
mS [g] |
mINS [mg/kg] |
| 1 |
297.20 |
298.90 |
124.530 |
13.7 |
| 2 |
294.25 |
298.80 |
127.040 |
35.8 |
| 3 |
294.69 |
296.60 |
129.900 |
14.7 |
| 4 |
293.02 |
296.80 |
126.960 |
29.8 |
| 5 |
295.70 |
297.50 |
135.340 |
13.3 |
| 6 |
298.93 |
301.60 |
135.650 |
19.7 |
| Mean |
|
|
|
21.2 |
| s |
|
|
|
9.5 |
| r |
|
|
|
26.3 |
The insoluble matter content determination clearly exhibits a comparatively large standard deviation, which can be mostly attributed to the propagation of the error of the large values mFL and mFR, from which the result is evaluated.
Understanding the acceptance limit, as presented in ISO 22241-1, allows the instrument to determine the automatic out-of-limits of measured values. The results of measured values are displayed in Figure 15.

Figure 15. Measured insoluble matter content of an AUS 32 sample. The average of the measured values is indicated with a solid blue line. Dashed blue lines depict the boundaries of the 95% confidence interval and red lines are the limits given in ISO 22241-1. Image Credit: Mettler-Toledo Ltd
Two of the results are beyond the defined acceptance limits and are detailed as out-of-limit values on the instrument. The user can then determine how to advance with the measured sample, i.e., redo the measurement or label the sample as non-conforming to the acceptance criteria.
Summary
The sample of AUS 32 under evaluation was established in line with ISO 22241-2, Annex C, D, E, F and G. The methodologies of the test included various analytical techniques, including titration, refractometry, gravimetry and UV/Vis spectroscopy.
A single PC software, LabX, controlled all the recorded data. The test results were balanced with the limits given in ISO 22241-1. All instruments can be assembled to specify whether the measured results are within the specifications defined.
In the LabX software, all results are held in the same database and results that are beyond the relative limits are highlighted for easy recognition. A summary of all the results achieved in this study is presented in Table 12.
Table 12. Averages of the measured results including a comparison with the limits given in ISO 22241-1. Source: Mettler-Toledo Ltd.
| Parameter |
Result average |
Within limits |
| Refractive index |
1.38237 |
YES |
| Urea content |
32.095% |
YES |
| Alkalinity |
0.063% |
YES |
| Biuret content |
0.175% |
YES |
| Aldehyde content |
0.594 mg/kg |
YES |
| Insoluble matter content |
21.2 mg/kg |
NO |
References
- M. S. K. S. F. Kuternowski, Catalysts, vol. 10(7), p. 749, 2020.
- "ISO 22241-2, Diesel engines - NOx reduction agent AUS 32 -," 2019.
- "ISO 22241-1, Diesel engines - NOx reduction agent AUS 32 -," 2019.
- "METTLER TOLEDO Titration application note: M848," 2020.
- "METTLER TOLEDO Application note: Biuret Content in Diesel Exhaust Fluid According to ISO 22241-2".
- "ISO 11402, Phenolic, amino and condensation resins - Determination of free-formaldehyde content," 2004.
- "METTLER TOLEDO Titration application note: M789," 2019.
- "METTLER TOLEDO Application Note: Aldehyde Content in Diesel Exhaust Fluid According to ISO 22241-2," 2021.
- "METTLER TOLEDO Application note: Insoluble Matter Content of AdBlue according to ISO 22241-2," 2020.
- "METTLER TOLEDO Titration application note: M470," 2011.
- "ISO 4259, Petroleum and related products - Precision of measurement methods andr results -," 2017.

This information has been sourced, reviewed and adapted from materials provided by Mettler Toledo - Titration.
For more information on this source, please visit Mettler Toledo - Titration.