Many users gained their first practical titration experience during chemistry studies in school. A student would learn how to carry out a manual visual endpoint titration.
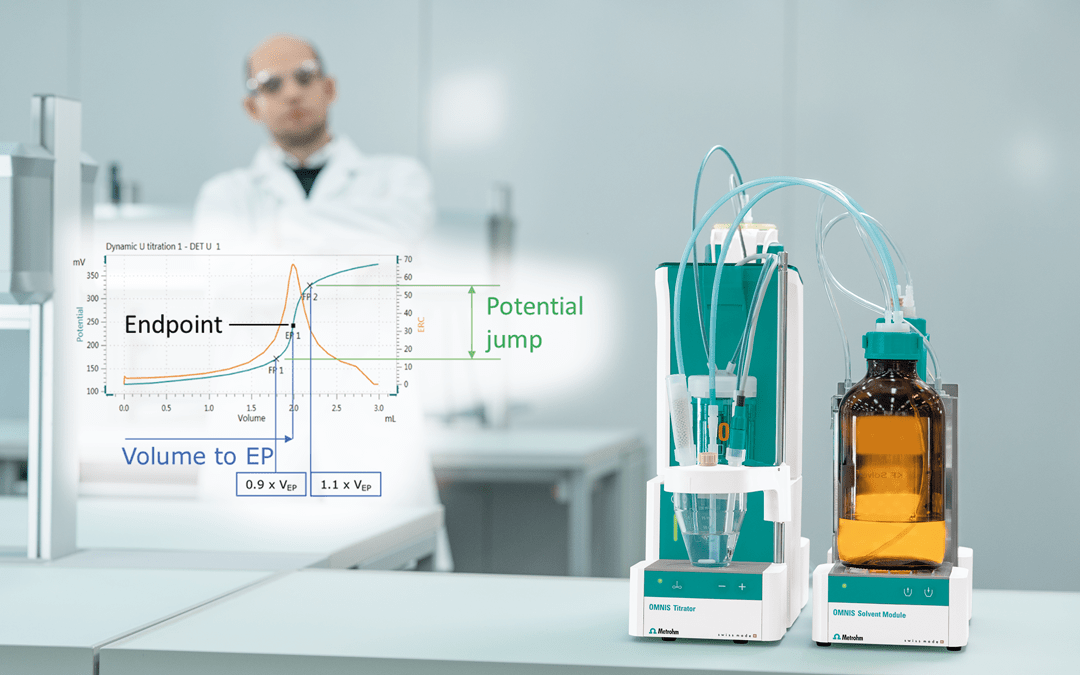
Image Credit: Metrohm AG
This was done by using a manual buret filled with titrant and adding each drop individually to an Erlenmeyer flask containing the sample solution (including the analyte to be measured) and the indicator, which was added before the titration.
Minutes pass with increasing uncertainty with each drop and even slight color change of the sample solution, and a student could wonder if they have already reached the true endpoint, whether to add another drop or if they have even over-titrated.
Metrohm offers the possibility of automated titrations. How to determine the endpoint in an automated titration is outlined in the article below.
Different Detection Principles
The endpoint (EP) can be detected in an automated titration in a number of ways.
Aside from the visual endpoint recognition (e.g., by the appearance of turbidity, a color change, or appearance of a precipitate), a titration EP can also be detected by the automated monitoring of a change in a chemical or physical property which happens once the reaction is complete.
The table below shows that there are many different detection principles:
Table 1. Source: Metrohm AG
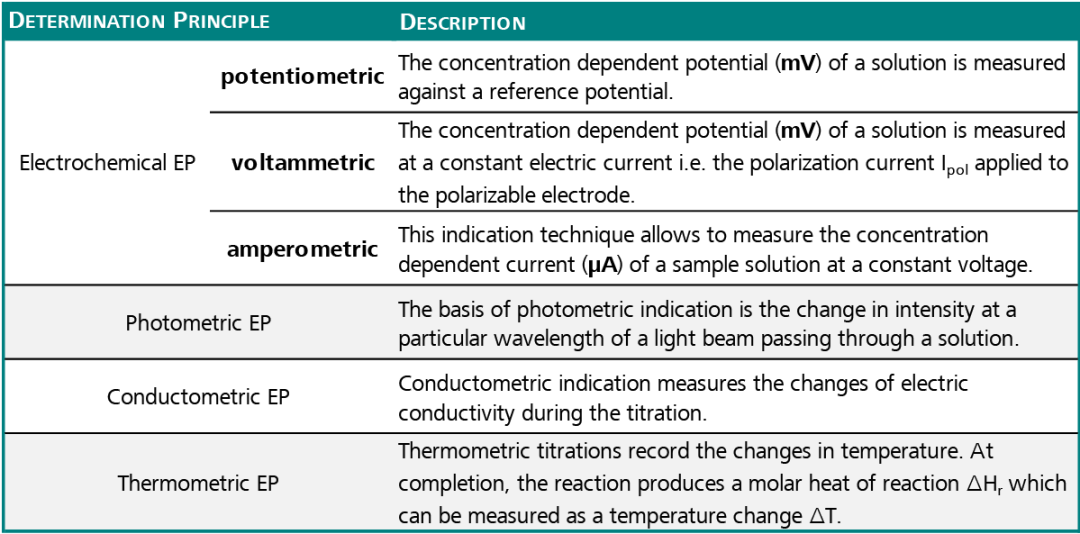
The most commonly used determination principles for automated titrations are the potentiometric and photometric EP determination in comparison to a visually recognized EP detection.
Potentiometric Principle
In the potentiometric principle, the concentration-dependent potential (mV) of a solution is measured against a reference potential, as shown in the table. So, a silver-silver chloride (Ag/AgCl) reference electrode is utilized together with a measuring electrode (pH-sensitive glass membrane or metal ring).
Typically, a combined sensor (electrode) including both measuring and reference electrodes is employed.
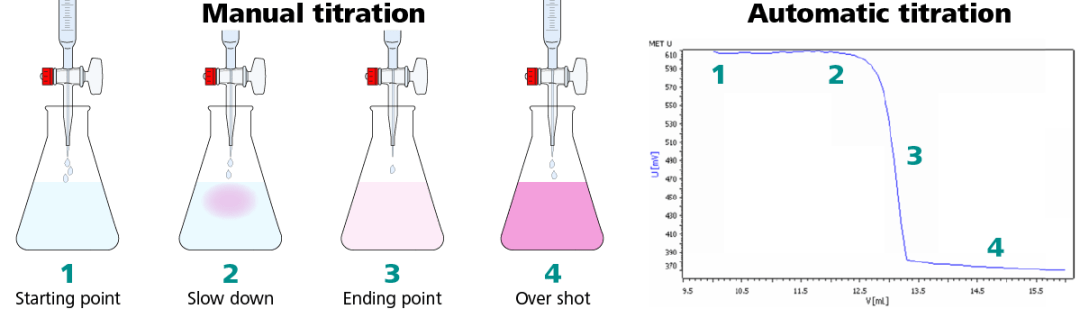
Figure 1. Illustration of the same titration performed manually (left) and automatically (right). Image Credit: Metrohm AG
Step 1: Start the titration before the titrant is added.
Step 2: Addition of titrant. As the titration nears the endpoint see signs of the color change start to be observed. At this point in an automatic titration, the sensor will detect an alteration in mV signal, and the titrator starts to dose the titrant in smaller volumes and at a slower rate.
Step 3: The EP is reached with a faint pink color that corresponds with the inflection point in the titration curve.
Step 4: Titrating beyond the endpoint results in over titration, and the mV signal is fairly constant.
The steps above outline how to achieve the characteristic S-shaped titration curve observed when carrying out an automated titration. It is not just acid-base titrations that can be converted; Figure 2 demonstrates how a simple chloride titration can be converted.
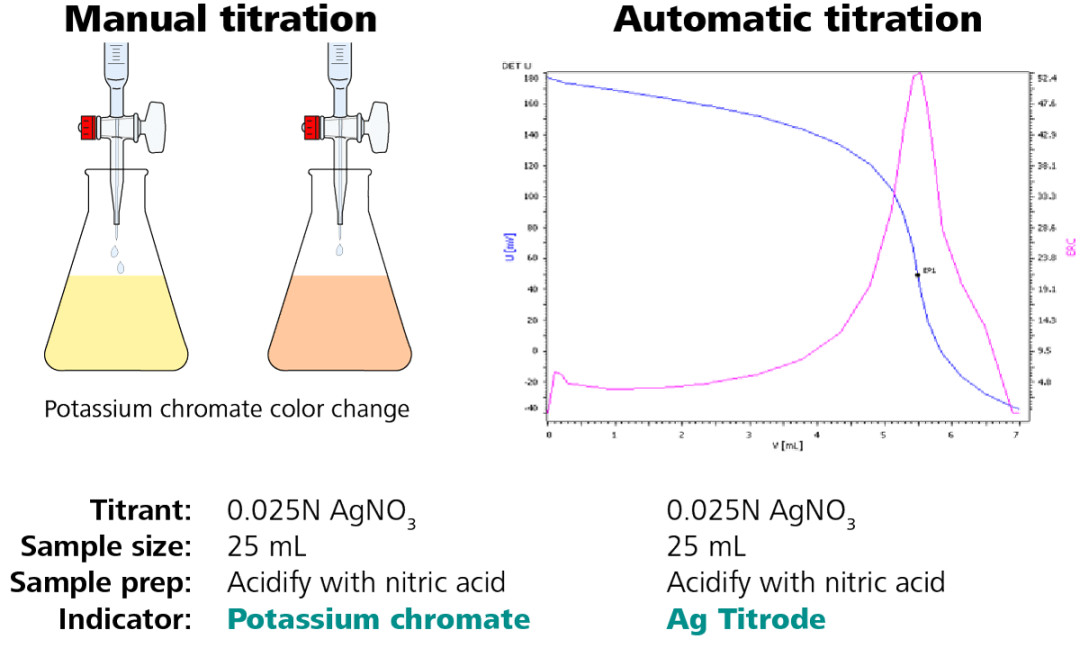
Figure 2. Illustration of a chloride titration – conversion from manual to automatic analysis. Image Credit: Metrohm AG
The sample size, titrant, titrant concentration, and sample preparation stay the same. To produce a titration curve (Figure 2, right side) with a clearly defined endpoint, only the indicator is replaced by a silver ring electrode, the Ag Titrode.
Photometric Principle
Titrations that utilize color indicators are still widely employed, e.g., in pharmacopeias. When manually performed, the results literally depend on the eye of the beholder.
Photometric titration using the Optrode makes it possible to replace this subjective determination of the equivalence point with an objective process completely independent of the human eye.
The benefit, in this case, is that the chemistry is not altered – that is, the standard operating procedure (SOP) usually does not have to be adapted. The basis of photometric indication is the change in intensity at a certain wavelength of a light beam passing through a solution.
In photometry, the transmission is the primary measured variable and is supplied by the light transmission (mV or % transmission) of a colored or turbid solution which is measured with a photometric sensor like the Optrode from Metrohm.
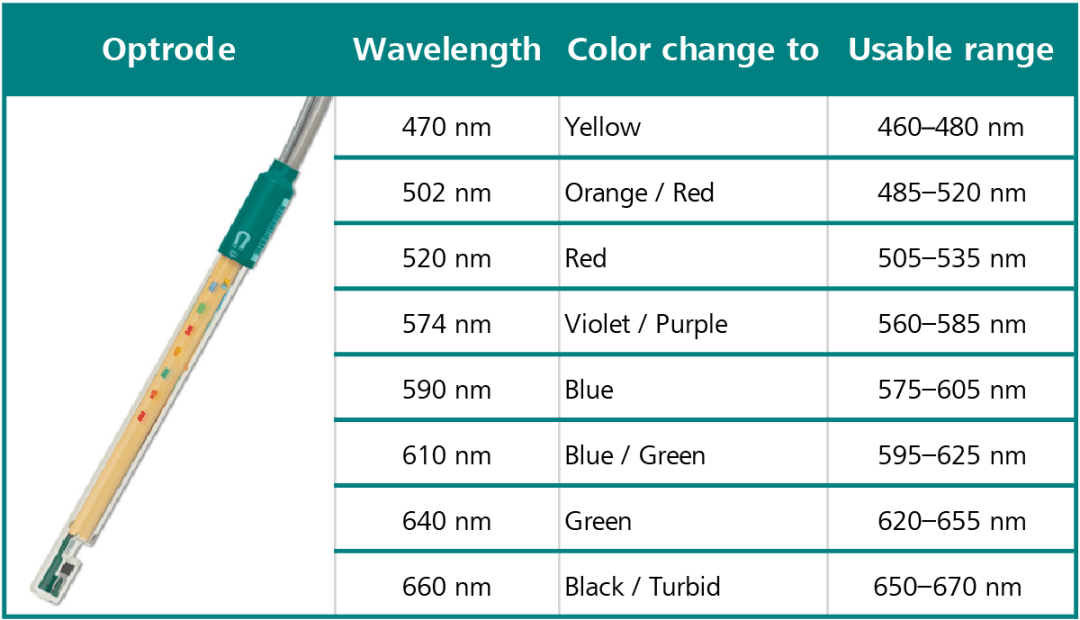
As seen in the table below, there are eight possible wavelengths to choose from that span nearly all color indicators utilized for titrations. There is no maintenance required, and the shaft is solvent resistant. It improves repeatability and accuracy of color indicated titrations and connects directly to the titrator.
Table 2. Source: Metrohm AG
An example of how to convert an EDTA titration of manganese sulfate from manual titration to automated titration is shown above, and the procedure remains the same.
One benefit of automated titration is that a lower volume of chemicals is required, resulting in less waste. The Optrode is used at a wavelength of 610 nm with the same indicator, Eriochrome Black TS.
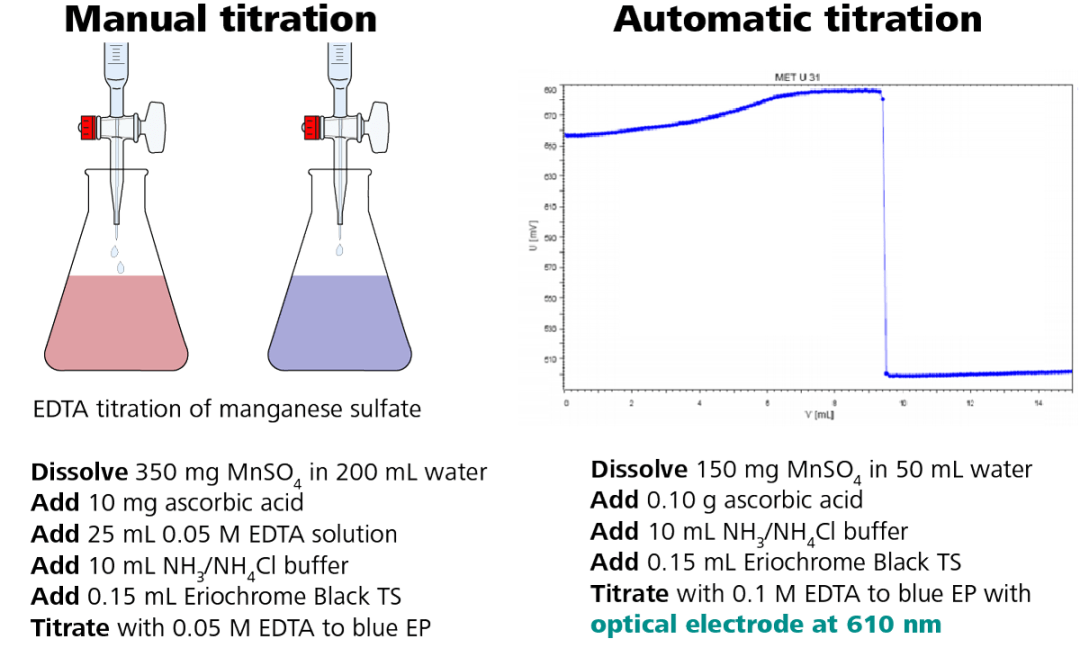
Figure 3. Illustration of the photometric EDTA titration of manganese sulfate according to USP. Image Credit: Metrohm AG
The titration curve is shown in Figure 3, right side, which demonstrates a large potential change of the mV signal, indicating a clearly defined titration endpoint.
Comparison: Optrode vs. Potentiometric Electrodes
There are some points to consider when comparing the Optrode with other Metrohm potentiometric electrodes when deciding to make the change to automated titration, and the table below lists the main criteria. An autotitration is quite simple to carry out and has the key advantage that a clearly defined endpoint is given.
Table 3. Source: Metrohm AG
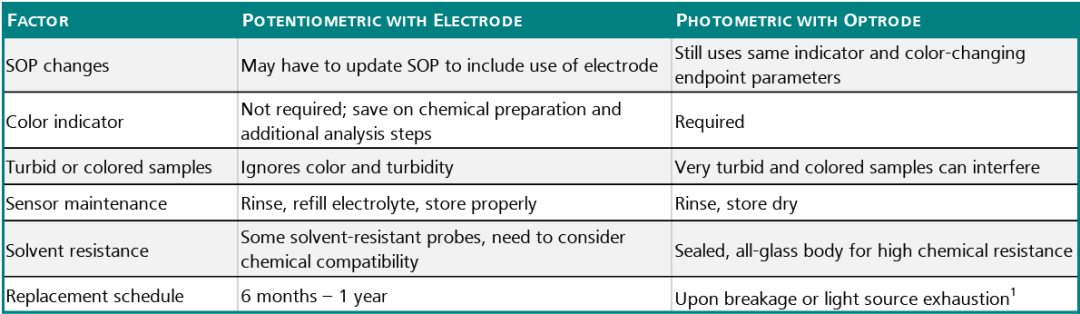
1-Optrode has a working life of tens of thousands of hours.
Acknowledgments
Produced from materials originally authored by Doris Hoffmann from Metrohm.

This information has been sourced, reviewed and adapted from materials provided by Metrohm AG.
For more information on this source, please visit Metrohm AG.