Geometry often plays a central role in fiber performance across various applications. Shape factors such as length (for example, the longest size of the fiber), width (for example, the shortest size of the fiber), and curl can have a major impact on fiber performance.
Despite this relationship between fiber geometry and performance, many traditional particle sizing measurements struggle to accurately characterize these particles’ morphology.
For example, volumetric-based particle sizing methods such as Coulter Counters and laser diffraction assume that particles exhibit spherical geometry and only return equivalent spherical diameter (ESD) measurements. While manual microscopy remains the primary approach for measuring fiber length and width, this method is labor-intensive and low-throughput.
Flow imaging microscopy (FIM) instruments such as Yokogawa Fluid Imaging Technologies’ FlowCam® offer an automated, high-throughput alternative to manual microscopy for fiber analysis.
FlowCam's VisualSpreadsheet® software captures and analyzes images of fibrils, providing users with automated measurements of fiber length, width, straightness, and curl from particle images similar to those acquired via conventional manual microscopy (Figure 1).
FlowCam represents an ideal solution for rapid, automated fiber analysis. Because FIM instruments capture fiber images in a flowing fluid, this approach offers significantly higher throughput than manual microscopy.
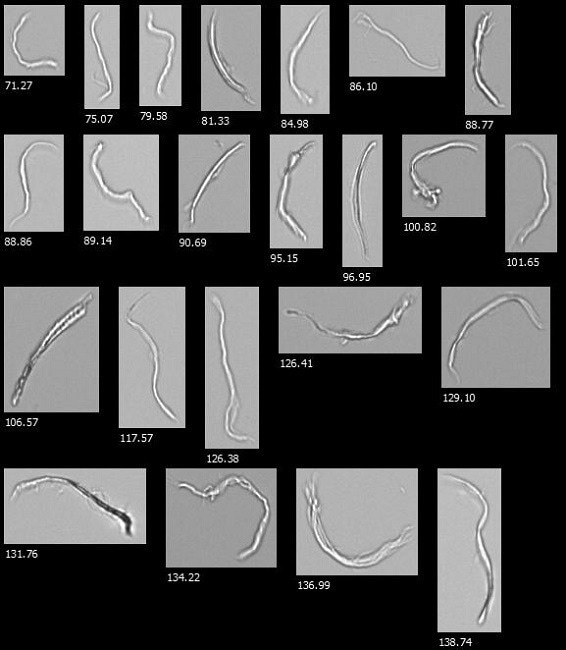
Figure 1. Example FlowCam images from a cellulose microfibril sample as seen in VisualSpreadsheet. Image Credit: Yokogawa Fluid Imaging Technologies, Inc.
Fiber Measurements in VisualSpreadsheet
Most particle imaging systems employ Feret measurements to determine particles’ length and width. Feret measurements look at parallel edges on opposite sides of a particle and measure the distance between these edges to determine length and width.
When working with Feret measurements, the shortest measurement is reported as particle width, while the longest is reported as particle length (Figure 2).
VisualSpreadsheet records and reports these Feret measurements the “Length” and “Width” parameters. While these measurements are considered to be accurate for symmetric and straight particles, it should be noted that Feret measurements are prone to dramatically underreporting the length and overreporting the width of curved particles.
VisualSpreadsheet is also capable of recording geodesic measurements of particle lengths and widths. Geodesic measurements offer a more accurate representation of fiber length and width (Figure 2) because they account for the arcing of particles like fibers.
These fiber measurements are reported as geodesic length and geodesic thickness in VisualSpreadsheet.
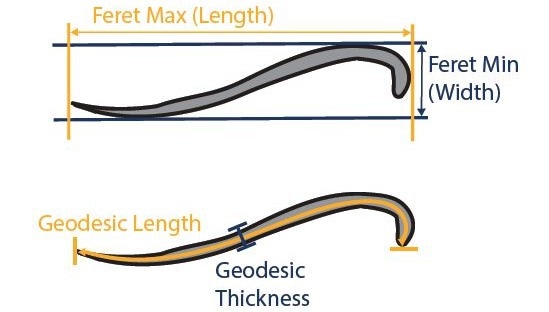
Figure 2. (right). The calculation of length and width using Feret measurements (top) and of geodesic length and thickness (bottom). Image Credit: Yokogawa Fluid Imaging Technologies, Inc.
Figure 3 compares Feret and geodesic measurements for both a straight and curved fiber. The figure confirms that the reported values for length (Feret) and geodesic length of the straight fiber are comparable, as are the values for width (Feret) and geodesic thickness.
It should be noted, however, that when values for the curved fiber are compared, the length (Feret) measurement is considerably lower than the geodesic length measurement, and the width is considerably larger than the geodesic thickness measurement.
The length (Feret) helps measure the long-axis distance covered by the particle, but the geodesic length represents a more accurate measurement because it factors the particle's curvature into its reported length. The geodesic thickness is also a more accurate measurement because it accounts for the particle's width rather than the short-axis distance covered by the particle.
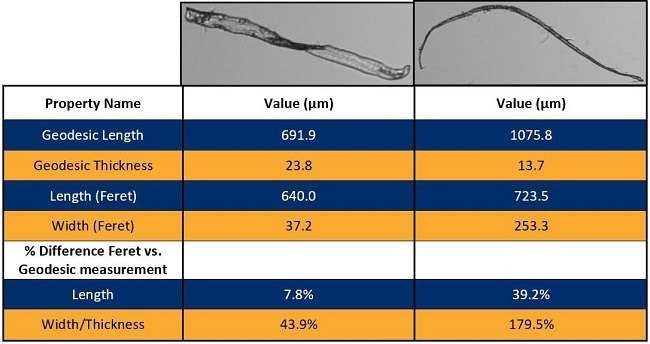
Figure 3. The straight fiber on the left exhibits relatively low percentage differences when comparing length to geodesic length (blue) and width to geodesic thickness (yellow). The curved particle to the right shows a larger % difference between length and geodesic length (blue) and between width and geodesic thickness (yellow), with length (Feret) measurements being underestimated and width (Feret) being overestimated. Image Credit: Yokogawa Fluid Imaging Technologies, Inc.
VisualSpreadsheet also offers a range of other fiber measurements, including fiber straightness and fiber curl.
In this context, fiber straightness can be understood as the ratio of length (Feret) to geodesic length. Higher straightness values show improved agreement between the Feret and geodesic length measurements, meaning that the particle exhibits straighter geometry.
Fiber curl can be calculated by dividing geodesic length by length (Feret) and subtracting one. For example, a particle with a fiber curl of zero would be considered perfectly straight, while increasing curl values would reflect higher degrees of curling.
Figure 4 provides example fiber measurement data for a curved wood fiber with a comparatively high fiber curl and relatively low fiber straightness.
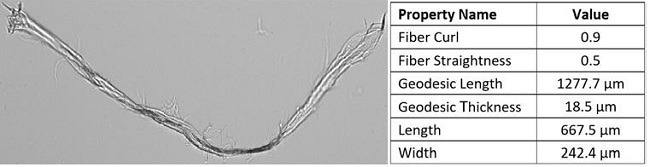
Figure 4. Fiber measurements for the particle shown at left. This particle exhibits a relatively high value for fiber curl and low value for fiber straightness, given its ~90o bend. Note the large difference between geodesic length and length (+610.2 µm) and between geodesic thickness and width (-223.9 µm) due to particle curvatur. Image Credit: Yokogawa Fluid Imaging Technologies, Inc.
Using Fiber Measurements to Evaluate Samples
VisualSpreadsheet allows users to build and save custom filters that automatically report the counts and concentrations of particles matching a designated specification. This is especially useful in applications where fiber morphology is used as a quality control metric for fibrous materials
For example, applications where fiber straightness is important can leverage pre-built filters to automatically report the percentage of fibers either meeting or exceeding a user-defined threshold for fiber straightness.
Figure 5 displays data for user-created filters designed to assess bleached softwood cellulose microfibrils at a specific stage of the refining process. In the example presented here, at least 50% of the fibers must exhibit fiber straightness ≥ 0.75 for a lot to meet quality control thresholds.
Following analysis of each lot of fibers, the filter bins instantly populate with a percentage of particles matching the passing criteria. This allows operators to rapidly assess whether or not a particular lot has passed quality control.
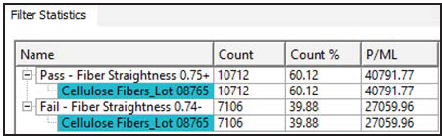
Figure 5. Custom value filters for cellulose fiber testing. In this example, a lot passes quality control if ≥ 50% of particles have a fiber straightness value of 0.75 or higher. This particular lot would pass with 60.12% of fibers meeting acceptance criteria. Image Credit: Yokogawa Fluid Imaging Technologies, Inc.
VisualSpreadsheet also offers users the option to interact directly with the filter grid and data plots. In this example, a user could select the “Pass—Fiber Straightness 0.75+” filter to automatically display particle images that match the filter in the View Window (Figure 6).
You can sort, select, and/or save these particle images. The software will also highlight any histogram regions or scatterplot containing particles matching the filter.
Once users are happy with the data presented, this can be exported into Excel or as a PDF document, affording users a virtually seamless reporting and archiving process.
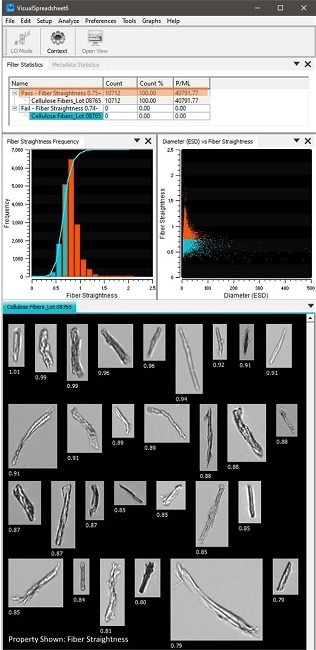
Figure 6. The “pass” filter (orange shading) has been selected, automatically highlighting and selecting matching particles in histograms and scatterplots. Images matching the filter automatically appear, allowing users to directly interact with particle images associated with specific filter parameters. Image Credit: Yokogawa Fluid Imaging TechnologiesInc.
Conclusion
FlowCam is a robust analytical tool that streamlines and expedites fiber analysis.
The software can accommodate a range of fiber morphology parameters, including geodesic length, thickness, curl, and straightness. These parameters allow it to offer more accurate and reliable data than volumetric-based methods and substantial time savings over manual microscopy.
VisualSpreadsheet’s custom filter capabilities enable instantaneous reporting of results following sample analysis, saving users time and effort when evaluating fiber quality.
Acknowledgments
Produced from materials originally authored by Yokogawa Fluid Imaging Technologies, Inc.

This information has been sourced, reviewed and adapted from materials provided by Yokogawa Fluid Imaging Technologies, Inc.
For more information on this source, please visit Yokogawa Fluid Imaging Technologies, Inc.