AuroFlow™ PR1ME™ BT Combo MRL Assay is a competitive assay in a test strip format. It has been specifically designed to enable the rapid detection of residues of β-lactams in raw commingled cow’s milk. It is also suitable for the detection of a range of metabolites, including penicillins, cefalosporins and tetracyclines.
The assay detects 17 β-lactams (including specific metabolites), and 3 tetracyclines at levels below European MRLs, providing these results in under 7 minutes.
Principle of Method
To assess the robustness of these tests, a raw milk sample at 2-15 °C was mixed to ensure sample homogeneity.
An empty tube was inserted into the AuroBLOCK™ incubator, with 200 µL of milk then added to the tube. This was followed by the test strip, inserted with the arrows pointing down.
Table 1. Instrumental reading: interpretation of test results. Source: PerkinElmer Food Safety and Quality
| Ratio (area measurement) |
Interpretation |
| ≤ 1.00 |
Negative |
| < 1.00 |
Positive |
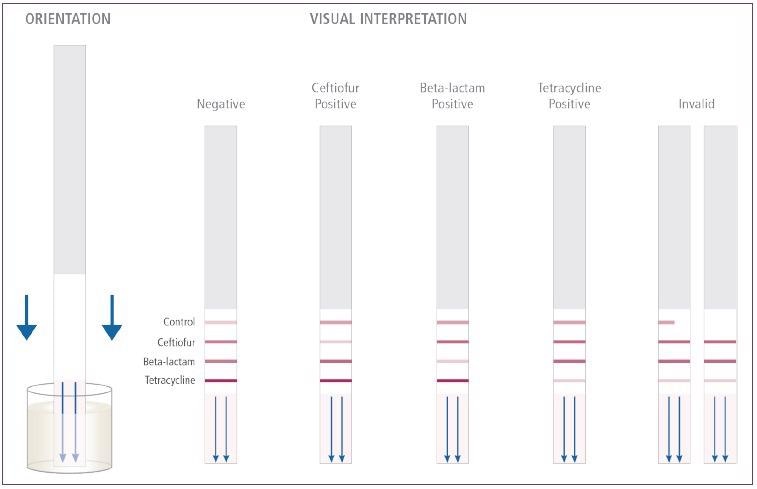
Figure 1. Visual Interpretation of the AuroFlow™ PR1ME™ BT Combo MRL Assay test strip. Image Credit: PerkinElmer Food Safety and Quality
The sample was incubated for 7 minutes at 50 °C before the test strip was removed from the tube. Results were visually interpreted by comparing intensities of β-lactam, ceftiofur and tetracycline lines with control line intensity.
Results can also be evaluated by reading the strip in the QuickSTAR™ Strip Test Reader and then applying a ratio of 1.00 to represent the cut-off value. Should an antibiotic test line appear less intense than the control line, the sample can be regarded as positive for that antibiotic.
The AuroFlow™ PR1ME™ BT Combo MRL Assay was used to determine the predicted detection capability (CCβ) for 15 β-lactams and 4 tetracycline antibiotics.
Antibiotic-free milk samples were fortified with each antibiotic at a range of concentrations. These concentrations were at, above and below the Maximum Residue Limit (MRL).
Each sample was tested using between 10 and 20 test strips (from a single lot) per concentration.
Detection capability was characterized as the lowest analyte concentration of a single milk sample tested yielding positive results for at least 19 out of 20 strips tested.
Testing was performed according to the Guidelines for Validation of Screening Methods of Veterinary Medicines (Community Reference Laboratories 20/01/2010). A total of 115 antibiotic milk samples were also tested.
Table 2. Antibiotics tested with the Maximum Residue Limit (MRL) and the concentrations tested for each. Source: PerkinElmer Food Safety and Quality
| Antibiotic |
EU MRL (μg/kg) |
Concentrations Tested (μg/kg) |
| Amoxicillin |
4 |
1, 2, 3, 4 |
| Ampicillin |
4 |
1, 2, 3, 4 |
| Cefacetrile |
125 |
|
| Cefalonium |
20 |
4, 6, 8, 20 |
| Cefazolin |
50 |
25, 50, 60, 75 |
| Cefoperazone |
50 |
1, 1.5, 2, 3 |
| Cefquinome |
20 |
5, 10, 15, 20 |
| Ceftiofur |
100 |
10, 20, 30, 100 |
| Cefalexin |
60 |
100, 500, 1000, 1500 |
| Cephapirin |
60 |
4, 5, 6, 60 |
| Cloxacillin |
30 |
2, 3, 4, 30 |
| Dicloxacillin |
30 |
1, 2, 3, 30 |
| Nafcillin |
30 |
2, 4, 6, 30 |
| Oxacillin |
30 |
2, 3, 4, 30 |
| Desfuroylceftiofur |
100 |
10, 20, 30, 100 |
| Penicillin G |
4 |
1, 2, 3, 4 |
| Desacetylcephapirin |
60 |
10, 15, 20, 60 |
| Tetracycline |
100 |
5, 10, 20, 100 |
| Oxytetracycline |
100 |
10, 20, 30, 100 |
| Chlortetracycline |
100 |
10, 20, 30, 100 |
Materials and Methods
A series of antibiotic stock solutions were prepared at 100-250 mg/L. This was done using USP grade antibiotic stocks where these were available - desfuroylceftiofur, and desacetylcephapirin were acquired from Toronto Research Chemical.
Β-lactam stock solutions were prepared in 50:50 (% v/v) methanol/water, while tetracyclines were prepared in 100% methanol (ACS grade). Solutions were mixed and sonicated until fully dissolved in every instance.
Each text was conducted using a single milk sample (Lot # 91017OP) that was stored at -80 °C in single-use aliquots. Aliquots were thawed prior to use and fortified with the proper concentration of antibiotic stock solution.
The Qiagen ESE Reader Plus was used to determine both positive and negative samples, with results regarded as positive when the antibiotic to control line ratio was < 1.00, and results regarded as negative when the antibiotic to control line ratio was ≥ 1.00.
Results
A dose response curve was generated for each antibiotic in the study. This was generated at various concentrations at or around the MRL, utilizing line intensity to determine the limit of detection (LOD).
Figures 2 through 21 highlight this response by showing the control line versus each class of antibiotics’ respective line intensity.
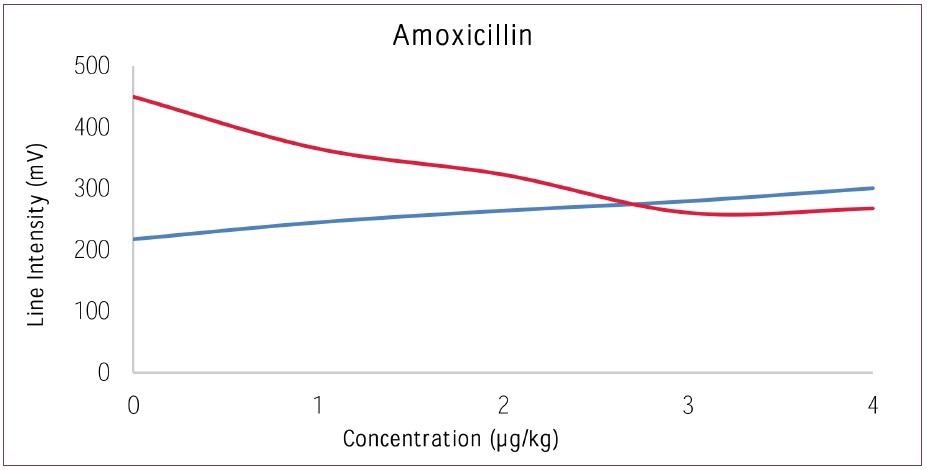
Figure 2. Dose response curve for Amoxicillin versus Control. Image Credit: PerkinElmer Food Safety and Quality
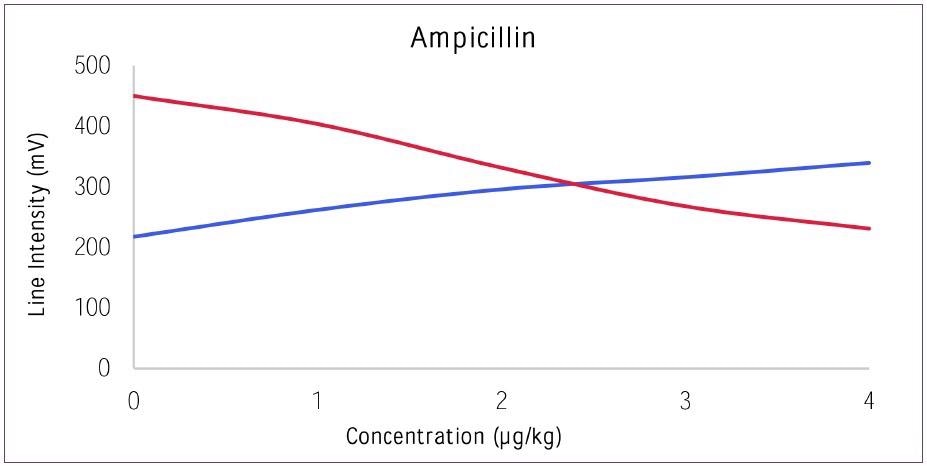
Figure 3. Dose response curve for Ampicillin versus Control. Image Credit: PerkinElmer Food Safety and Quality
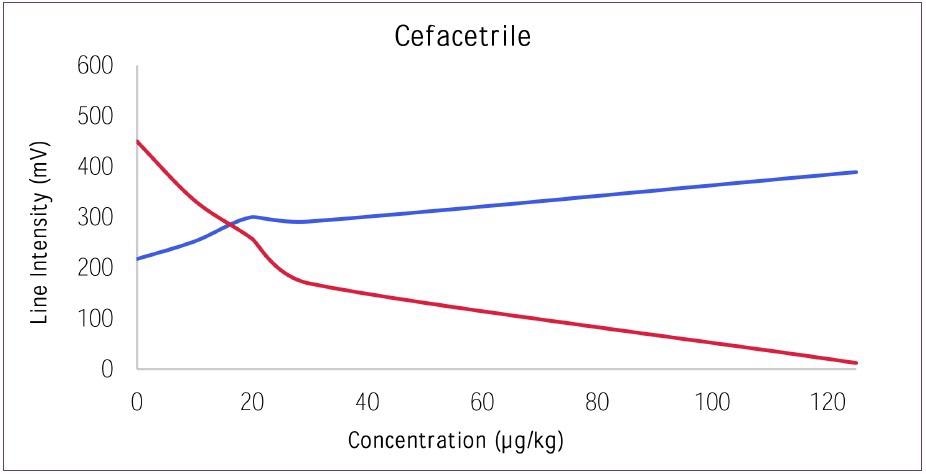
Figure 4. Dose response curve for Cefacetrile versus Control. Image Credit: PerkinElmer Food Safety and Quality
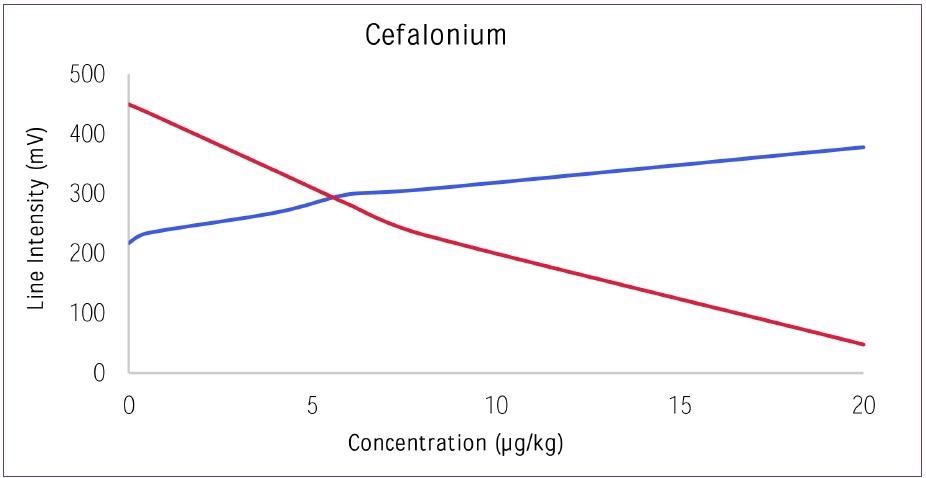
Figure 5. Dose response curve for Cefalonium versus Control. Image Credit: PerkinElmer Food Safety and Quality
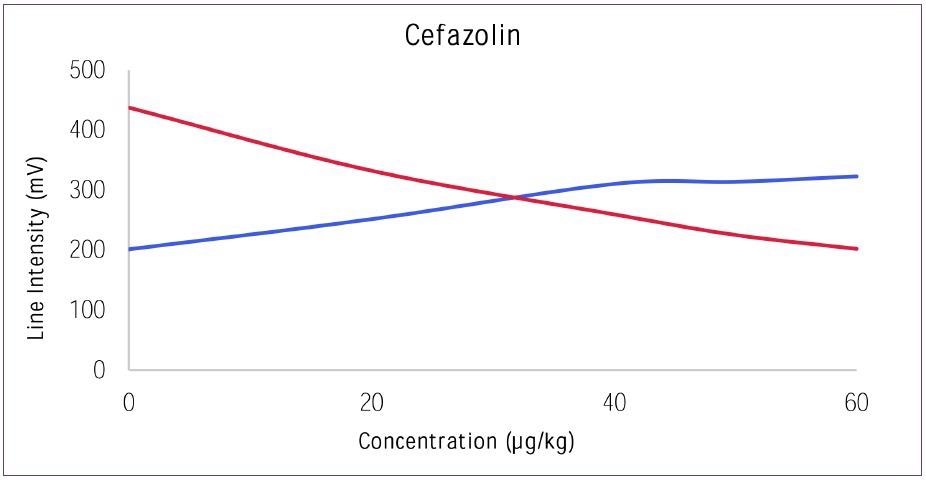
Figure 6. Dose response curve for Cefazolin versus Control. Image Credit: PerkinElmer Food Safety and Quality
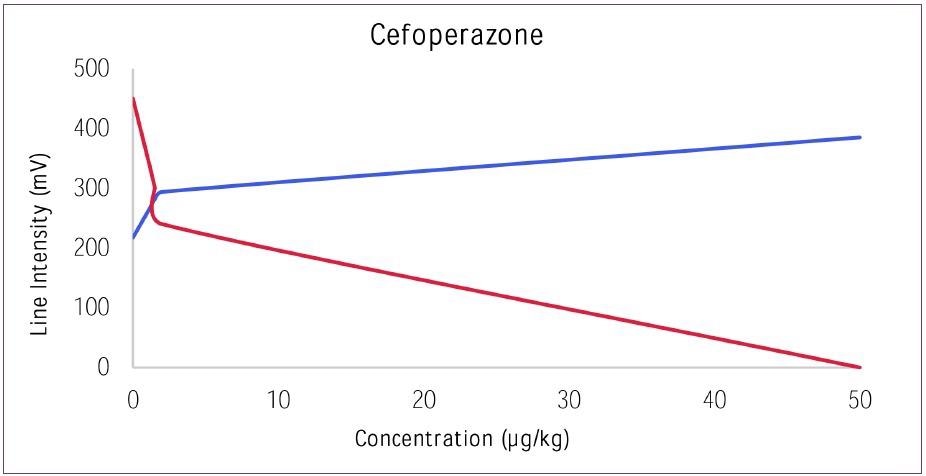
Figure 7. Dose response curve for Cefoperazone versus Control. Image Credit: PerkinElmer Food Safety and Quality
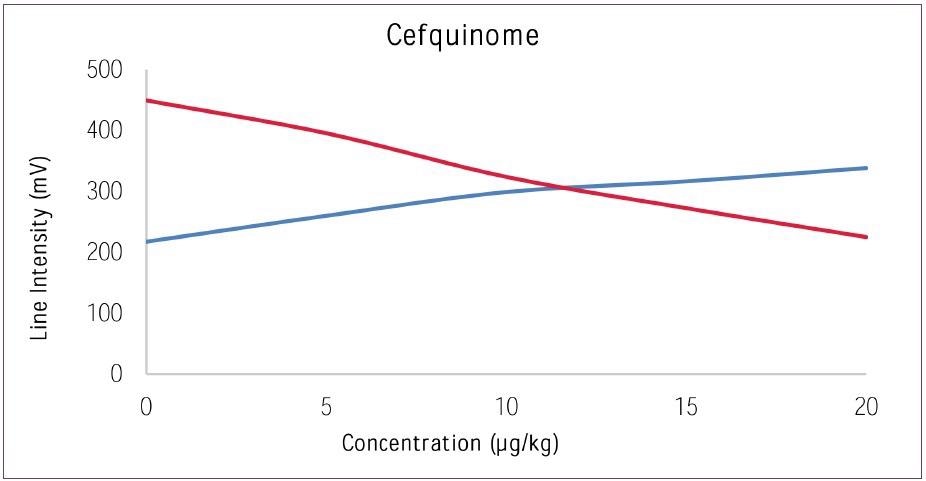
Figure 8. Dose response curve for Cefquinome versus Control. Image Credit: PerkinElmer Food Safety and Quality
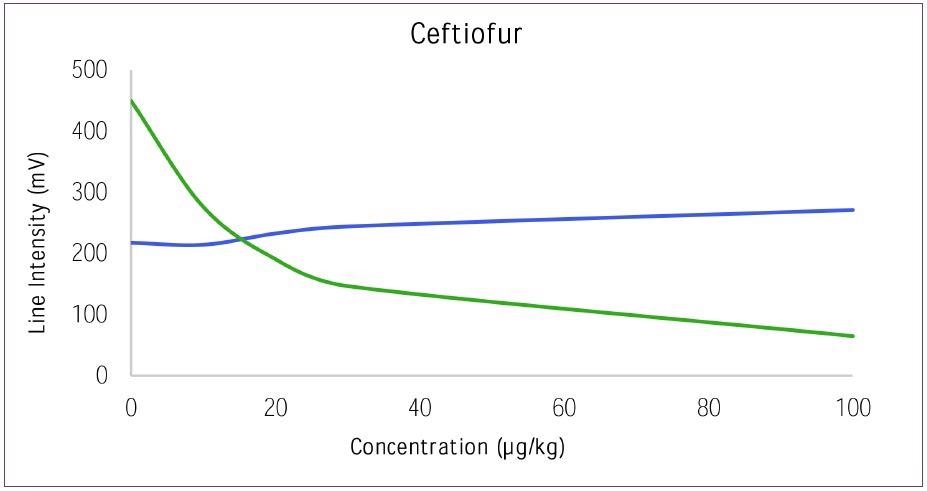
Figure 9. Dose response curve for Ceftiofur versus Control. Image Credit: PerkinElmer Food Safety and Quality
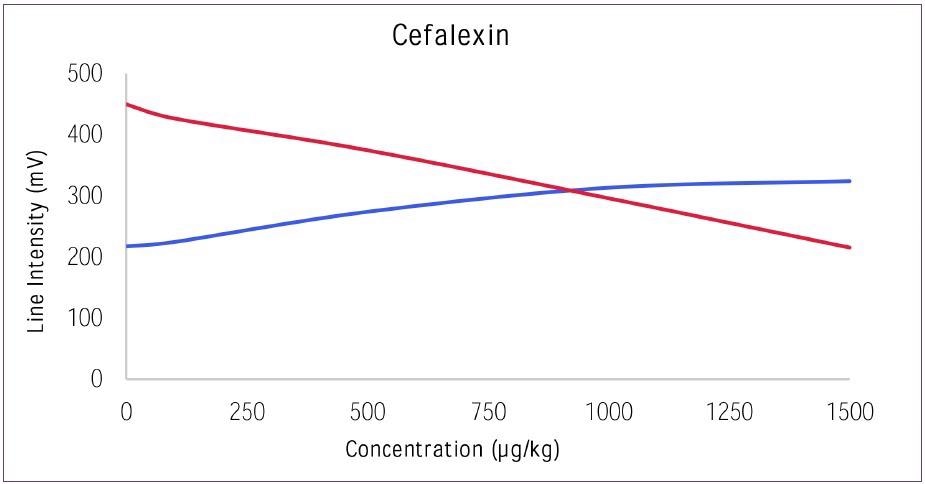
Figure 10. Dose response curve for Cefalexin versus Control. Image Credit: PerkinElmer Food Safety and Quality
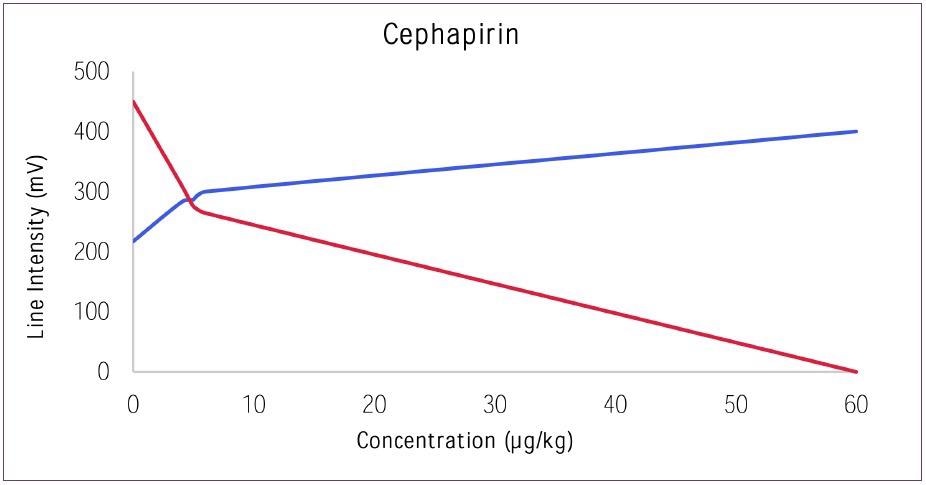
Figure 11. Dose response curve for Cephapirin versus Control. Image Credit: PerkinElmer Food Safety and Quality
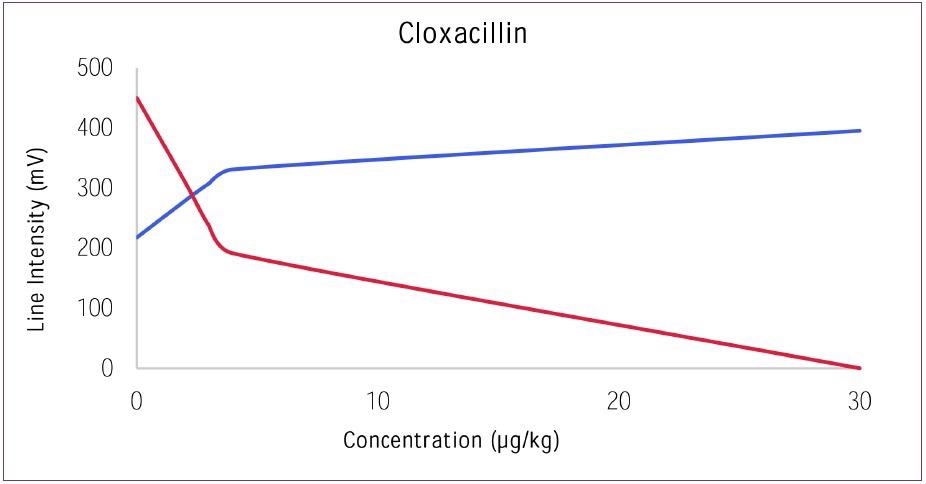
Figure 12. Dose response curve for Cloxacillin versus Control. Image Credit: PerkinElmer Food Safety and Quality
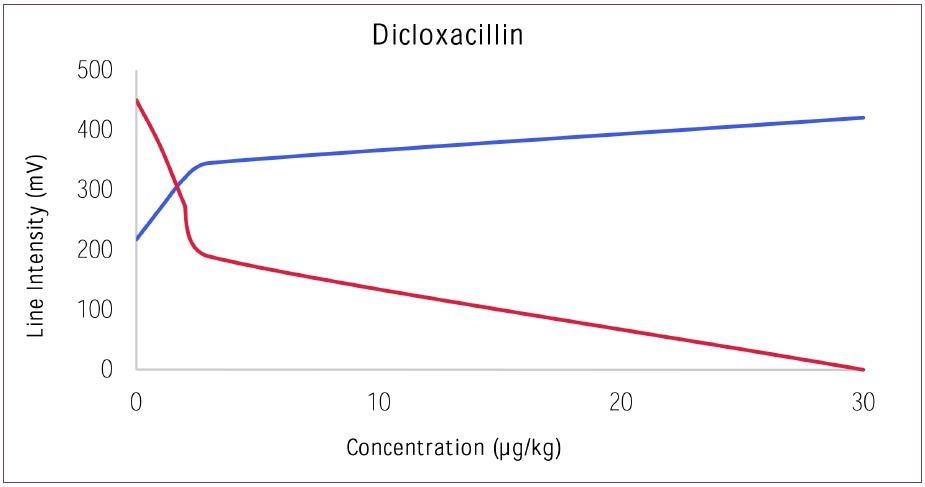
Figure 13. Dose response curve for Dicloxacillin versus Control. Image Credit: PerkinElmer Food Safety and Quality
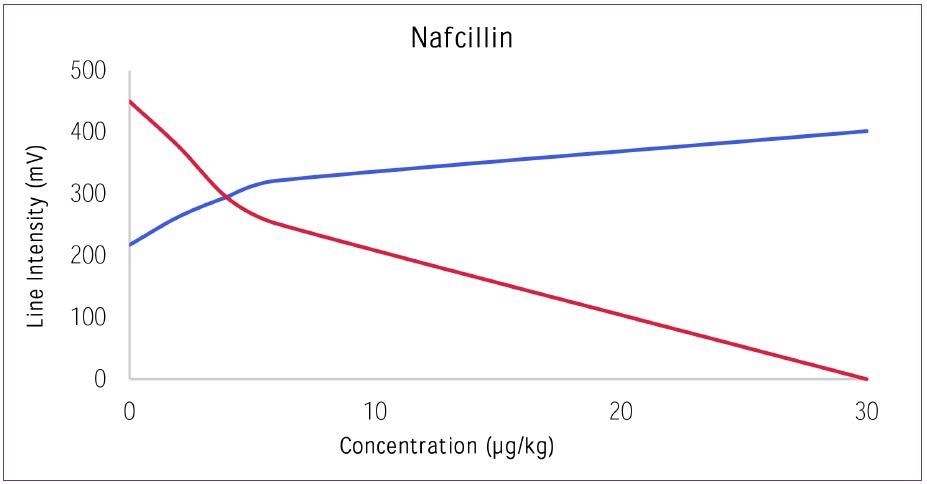
Figure 14. Dose response curve for Nafcillin versus Control. Image Credit: PerkinElmer Food Safety and Quality
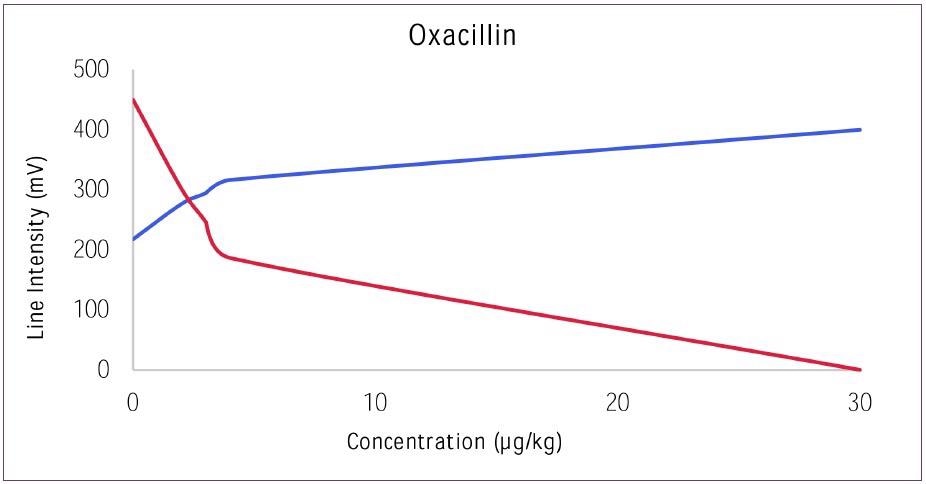
Figure 15. Dose response curve for Oxacillin versus Control. Image Credit: PerkinElmer Food Safety and Quality
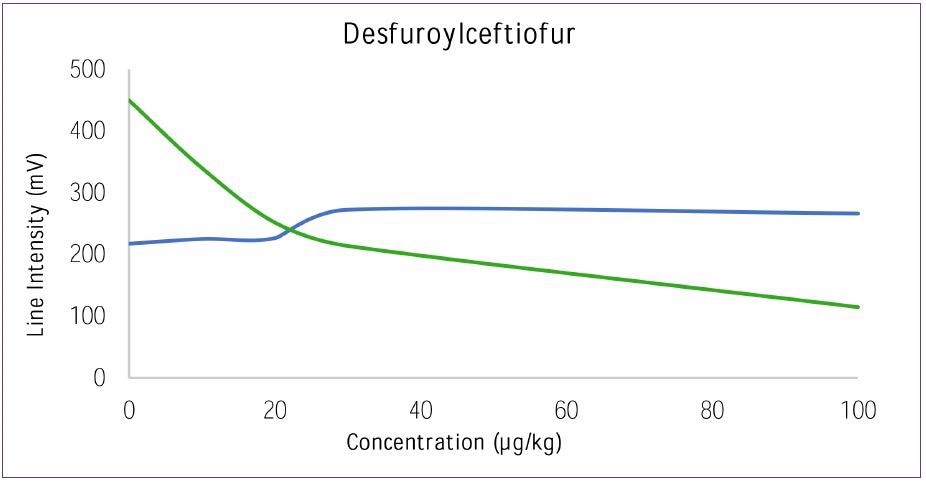
Figure 16. Dose response curve for Desfuroylceftiofur versus Control. Image Credit: PerkinElmer Food Safety and Quality
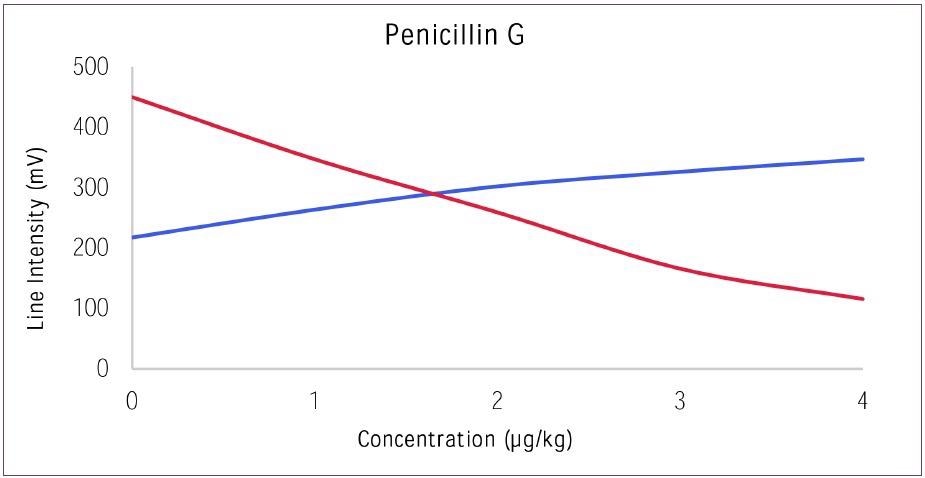
Figure 17. Dose response curve for Penicillin G versus Control. Image Credit: PerkinElmer Food Safety and Quality
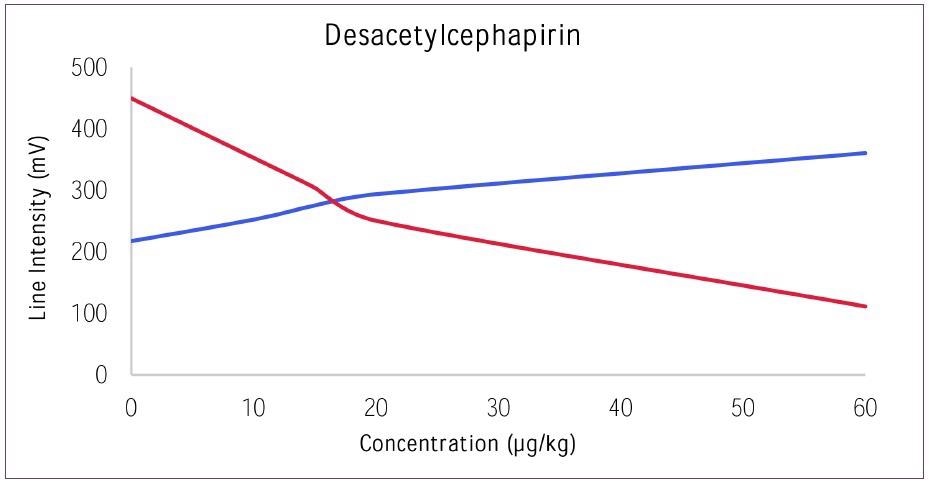
Figure 18. Dose response curve for Desacetylcephapirin versus Control. Image Credit: PerkinElmer Food Safety and Quality
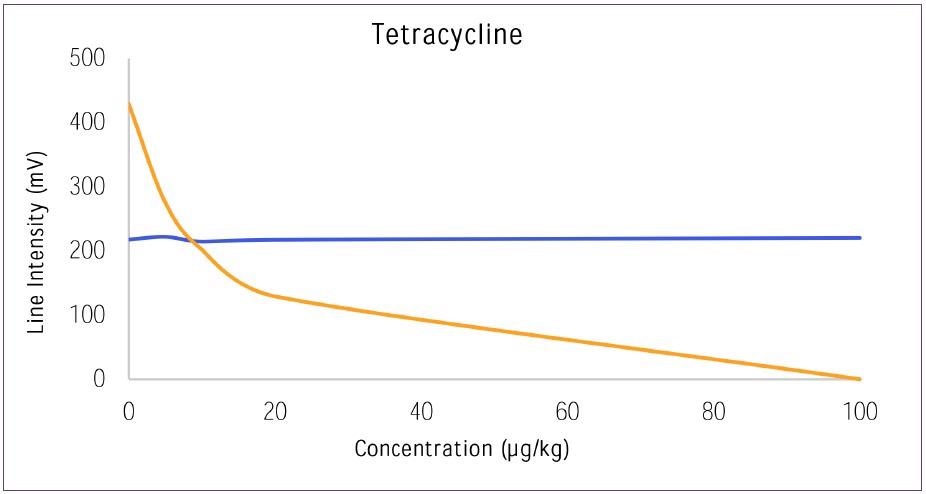
Figure 19. Dose response curve for Tetracycline versus Control. Image Credit: PerkinElmer Food Safety and Quality
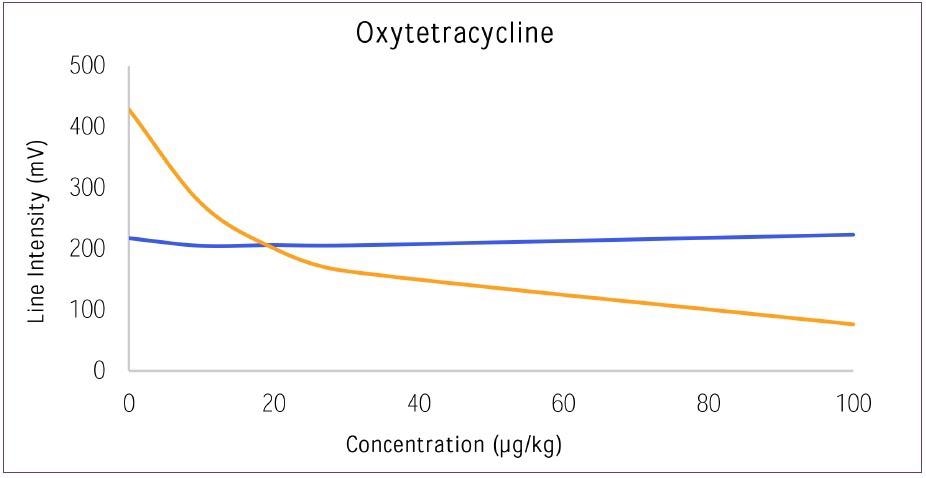
Figure 20. Dose response curve for Oxytetracycline versus Control. Image Credit: PerkinElmer Food Safety and Quality
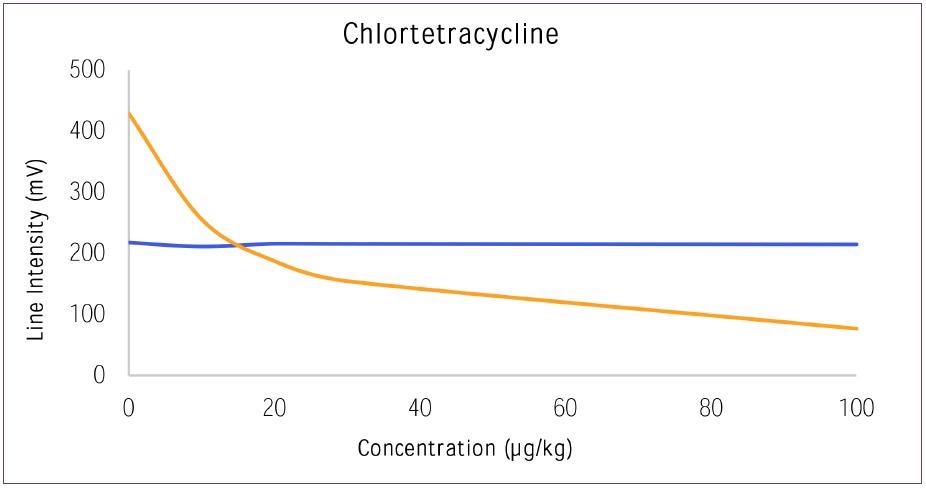
Figure 21. Dose response curve for Chlortetracycline versus Control. Image Credit: PerkinElmer Food Safety and Quality
The LOD for each antibiotic was calculated as the lowest detectable concentration at which there was a 95% chance of a positive result (Table 3). A further 115 negative milk samples were tested to ensure reproducibility (Table 4).
Table 3. Detection limit capability of the AuroFlow™ PR1ME™ BT Combo. Source: PerkinElmer Food Safety and Quality
| Antibiotic |
EU MRL (μg/kg) |
Detection Limit (LOD) |
| Amoxicillin |
4 |
3.5-4 |
| Ampicillin |
4 |
3 |
| Cefacetrile |
125 |
20 |
| Cefalonium |
20 |
8 |
| Cefazolin |
50 |
40 |
| Cefoperazone |
50 |
2 |
| Cefquinome |
20 |
12-15 |
| Ceftiofur |
100 |
20 |
| Cefalexin |
60 |
1100 |
| Cephapirin |
60 |
5-6 |
| Cloxacillin |
30 |
3 |
| Dicloxacillin |
30 |
2 |
| Nafcillin |
30 |
5-6 |
| Oxacillin |
30 |
3 |
| Desfuroylceftiofur |
100 |
30 |
| Penicillin G |
4 |
2 |
| Desacetylcephapirin |
60 |
18-20 |
| Tetracycline |
100 |
12-15 |
| Oxytetracycline |
100 |
30 |
| Chlortetracycline |
100 |
20-30 |
Table 4. Average line intensity and ratio of testing 115 negative milk samples at each respective line on the AuroFlow™ PR1ME™ BT Combo test strip. Source: PerkinElmer Food Safety and Quality
| Line Intensity (mV) |
| |
Control |
Ceftiofur |
Beta-lactam |
Tetracycline |
| Average |
217.5 |
449.3 |
449.8 |
428.8 |
| SD |
13.4 |
28.2 |
23.7 |
35.1 |
| % CV |
6.2 |
6.3 |
5.3 |
8.2 |
| Ratio |
| |
Ceftiofur |
Beta-lactam |
Tetracycline |
| Average |
449.3 |
449.8 |
428.8 |
| SD |
28.2 |
23.7 |
35.1 |
| % CV |
6.3 |
5.3 |
8.2 |
Conclusions
The AuroFlow™ PR1ME™ BT Combo MRL Assay is capable of detecting 14 β-lactam antibiotics under the European MRL levels. It can detect the metabolites of ceftiofur and cephaprin below MRL levels, as well as being able to detect all 3 regulated tetracycline antibiotics under the European MRL.
Validation results confirm that the AuroFlow™ PR1ME™ BT Combo MRL Assay is an ideal solution for users looking to screen test for β-lactams and tetracyclines in raw commingled cow’s milk.
Acknowledgments
Produced from materials originally authored by Nicolas Kosa from PerkinElmer, Inc.

This information has been sourced, reviewed and adapted from materials provided by PerkinElmer Food Safety and Quality.
For more information on this source, please visit PerkinElmer Food Safety and Quality.