Wine with grape origins may typically contain pesticides and fungicides that have been sprayed on the fruits during their growth cycle.
Additionally, wine often contains additives that have been purposefully added during production processes to enhance both flavor and color. Pesticides and illegal additives in wine can pose health risks to consumers if present at considerable levels.
Presently, identifying pesticides and illegal additives is done via different testing methodologies.1,2,3,4 This study presents a simple and sensitive LC-MS/MS method that was developed and applied for the identification of both pesticides and pigments in a single analytical run.
Experimental
Hardware/Software
Chromatographic separation was performed using a PerkinElmer UHPLC system, while detection was accomplished with a PerkinElmer QSight™ 220 triple quadrupole mass spectrometer incorporating a dual ionization source. All instrument control, data acquisition, and data processing was carried out by utilizing the Simplicity 3Q™ software.
Method
Sample Preparation
Precisely 1.0 mL of the test sample was pipetted into a centrifuge tube followed by the addition of 9.0 mL of water and the mixture subsequently blended. After five minutes of centrifugation at 6000 rpm, the supernatant was moved directly into an auto sampler vial without additional filtration for LC-MS/MS analysis.
LC Conditions
Separation of the analytes was performed using a PerkinElmer Brownlee SPP C18 column (4.6 x 100 mm, 2.7 μm). The temperature of the column oven was configured to 30 °C.
The mobile phases comprised of (A) 5 mM ammonium acetate in water and (B) acetonitrile. The flow rate was 0.8 mL/min and the mobile phase gradient is displayed in Table 1. The volume of the injection was 10 μL.
Table 1. Mobile phase gradient. Source: PerkinElmer Food Safety and Quality
| |
Time (min) |
A% |
B% |
| 1 |
0.0 |
95 |
5 |
| 2 |
3.0 |
60 |
40 |
| 3 |
5.0 |
50 |
50 |
| 4 |
8.0 |
20 |
80 |
| 5 |
9.0 |
5 |
95 |
| 6 |
11.0 |
5 |
95 |
| 7 |
11.1 |
95 |
5 |
| 8 |
13.0 |
95 |
5 |
Mass Detection Parameters
The conditions of the mass spectrometer source are detailed in Table 2, the compound dependent parameters including collision energy (CE) and the entrance voltage (EV) were augmented for each analyte by flow injection analysis.
All values are displayed in Table 3, in which the values of limit of quantification (LOQ) for the analytes determined under the enhanced conditions are also detailed.
Table 2. MS Source Conditions. Source: PerkinElmer Food Safety and Quality
| . |
. |
| ESI Voltage (Positive) |
5500 V |
| Drying Gas |
70 arbitrary units |
| Nebulizer Gas |
200 arbitrary units |
| Source Temperature |
500 ºC |
| HSID Temperature |
320 ºC |
| Detection Mode |
Time-managed MRM™ |
Table 3. Optimized MRM Parameters and the Limit of Quantifications (LOQs). Source: PerkinElmer Food Safety and Quality
| No. |
Analyte |
MRM Transition Quantifier |
RT/
min |
CE/
eV |
EV/
V |
LOQ/
μg/L |
| MRM Transition Qualifier |
| 1 |
Tartrazine |
468.9 |
451.0 |
1.45 |
-22 |
23 |
50 |
| 468.9 |
200.1 |
-33 |
23 |
| 2 |
New red |
545.9 |
504.0 |
1.85 |
-20 |
24 |
50 |
| 545.9 |
341.1 |
-34 |
24 |
| 3 |
Acid Red-27 |
538.8 |
348.1 |
1.99 |
-41 |
27 |
50 |
| 538.8 |
223.0 |
-37 |
27 |
| 4 |
Carmine |
538.9 |
158.2 |
2.29 |
-49 |
30 |
50 |
| 538.9 |
223.1 |
-37 |
30 |
| 5 |
Sunset Yellow |
408.7 |
392.1 |
2.56 |
-26 |
25 |
50 |
| 408.7 |
236.1 |
-29 |
25 |
| 6 |
Allura Red AC |
452.9 |
217.1 |
2.80 |
-30 |
17 |
10 |
| 452.9 |
202.2 |
-54 |
17 |
| 7 |
Azorubine |
458.8 |
223.2 |
3.26 |
-34 |
20 |
10 |
| 458.8 |
442.0 |
-22 |
20 |
| 8 |
Brilliant Blue |
749.2 |
306.1 |
3.45 |
-59 |
75 |
10 |
| 749.2 |
171.2 |
-71 |
75 |
| 9 |
Erythrosin B |
836.7 |
583.0 |
3.81 |
-69 |
67 |
10 |
| 836.7 |
329.0 |
-86 |
67 |
| 10 |
Methamidophos |
142.0 |
94.0 |
1.97 |
-11 |
22 |
10 |
| 142.0 |
125.0 |
-18 |
22 |
| 11 |
Thiamethoxam |
292.0 |
211.0 |
3.48 |
-17 |
20 |
0.5 |
| 292.0 |
181.0 |
-30 |
20 |
| 12 |
Carbendazim |
192.0 |
160.0 |
3.97 |
-24 |
28 |
0.5 |
| 192.0 |
132.0 |
-40 |
28 |
| 13 |
Dimethoate |
230.0 |
125.0 |
4.09 |
-29 |
22 |
0.5 |
| 230.0 |
199.0 |
-12 |
22 |
| 14 |
Acetamiprid |
223.0 |
126.0 |
4.19 |
-29 |
30 |
0.5 |
| 223.0 |
99.0 |
-54 |
30 |
| 15 |
Thiabendazole |
202.2 |
175.2 |
4.40 |
-45 |
33 |
0.5 |
| 202.2 |
131.2 |
-57 |
45 |
| 16 |
Dimethomorph |
388.0 |
301.0 |
6.87/7.11 |
-26 |
40 |
0.5 |
| 388.0 |
165.0 |
-41 |
40 |
| 17 |
Pyrimethanil |
200.0 |
107.0 |
7.48 |
-32 |
50 |
5 |
| 200.0 |
82.0 |
-32 |
50 |
| 18 |
Fenhexamid |
302.1 |
97.2 |
7.97 |
-32 |
57 |
5 |
| 302.1 |
55.2 |
-71 |
77 |
| 19 |
Azoxystrobin |
404.0 |
372.0 |
7.99 |
-19 |
25 |
0.5 |
| 404.0 |
344.0 |
-33 |
25 |
| 20 |
Epoxiconazole |
330.0 |
121.0 |
8.04 |
-22 |
25 |
0.5 |
| 330.0 |
101.0 |
-50 |
25 |
| t21 |
Triadimefon |
294.0 |
197.0 |
8.08 |
-20 |
30 |
0.5 |
| 94.0 |
225.0 |
-16 |
30 |
| 22 |
Boscalid |
343.0 |
307.0 |
8.09 |
-25 |
25 |
1 |
| 343.0 |
140.0 |
-28 |
25 |
| 23 |
Fluquinconazole |
376.0 |
349.0 |
8.16 |
-26 |
25 |
1 |
| 376.0 |
307.0 |
-34 |
25 |
| 24 |
Hexaconazole |
314.0 |
70.0 |
8.44 |
-24 |
25 |
0.5 |
| 314.0 |
159.0 |
-36 |
25 |
| 25 |
Imazalil |
297.1 |
159.1 |
8.49 |
-42 |
30 |
1 |
| 299.1 |
161.1 |
-42 |
30 |
| 26 |
Penconazole |
283.8 |
70.1 |
8.51 |
-23 |
20 |
0.5 |
| 283.8 |
159.1 |
-48 |
20 |
| 27 |
Malathion |
331.0 |
127.0 |
8.51 |
-10 |
20 |
5 |
| 331.0 |
285.0 |
-16 |
20 |
| 28 |
Prochloraz |
376.0 |
308.0 |
8.84 |
-16 |
20 |
0.5 |
| 376.0 |
70.0 |
-37 |
20 |
| 29 |
Cyprodynil |
226.3 |
93.2 |
8.87 |
-51 |
66 |
0.5 |
| 226.3 |
108.3 |
-35 |
56 |
| 30 |
Phoxim |
299.0 |
77.0 |
9.40 |
-46 |
20 |
1 |
| 299.0 |
129.0 |
-18 |
20 |
| 31 |
Trifloxystrobin |
409.2 |
186.1 |
9.52 |
-43 |
31 |
0.5 |
| 409.2 |
206.2 |
-33 |
21 |
| 32 |
Chlorpyrifos |
350.0 |
198.0 |
10.00 |
-23 |
25 |
0.5 |
| 350.0 |
97.0 |
-47 |
25 |
Results and Discussion
A recently developed UHPLC-MS/MS method was successful when applied to synchronous quantification of 23 pesticides residues and nine illegal additives of pigments.
As shown in Figure 1, all target compounds were identified with excellent peak shape and sensitivity. Utilizing this method, the range of the LOQs of the target compounds was between 0.5 to 50 µg/L in wine samples as displayed in Table 3.
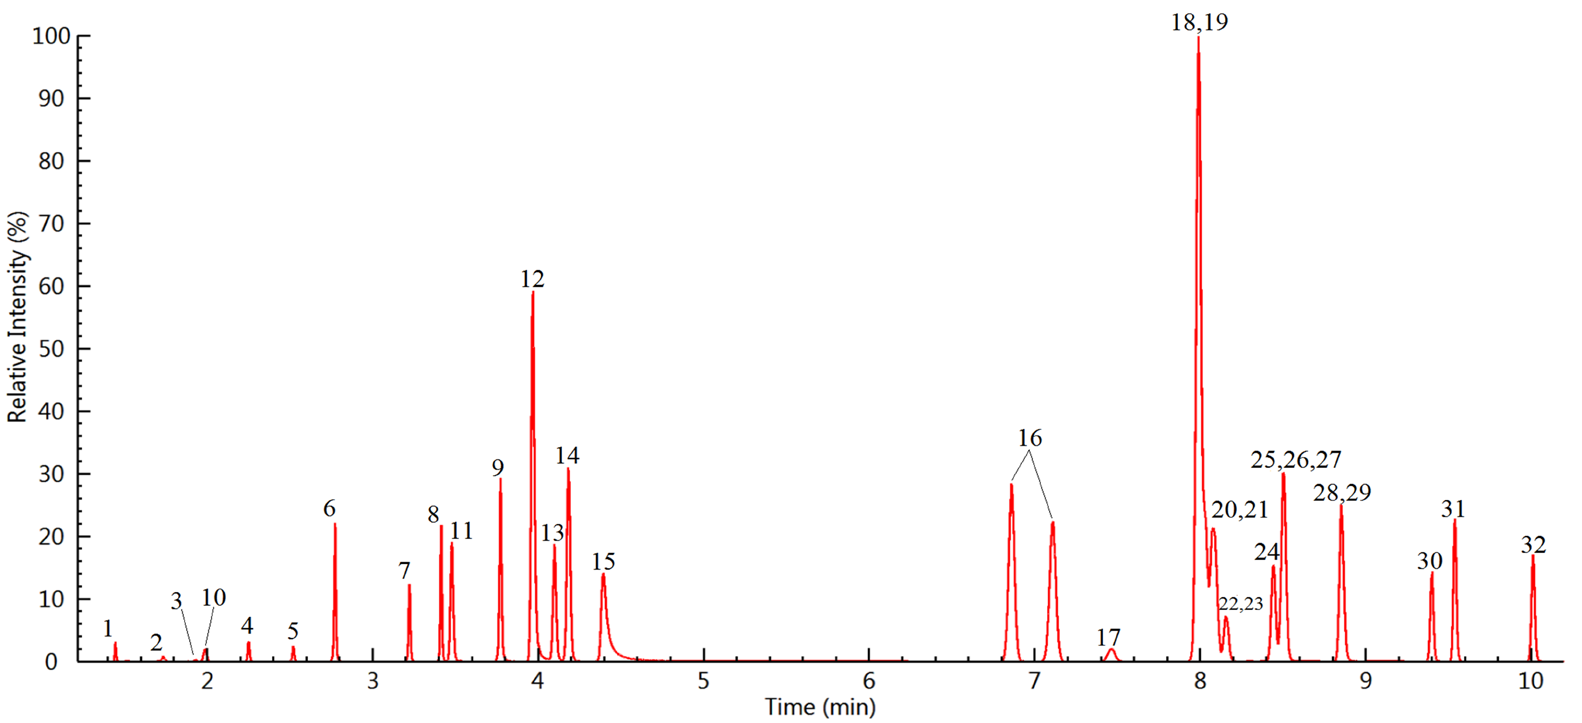
Figure 1. LC–MS/MS chromatograms of the 9 pigments (100 μg/L) and 23 pesticides (10 μg/L) spiked to a wine sample (compound names are shown in Table 3). Image Credit: PerkinElmer Food Safety and Quality
The effects of sample matrices and dilution factors on the analysis were assessed during the sample preparation process. Wine samples with varying dilution factors (1:2, 1:5, 1:10, and 1:20) and spiked with an equal number of analytes (pigments: 100 µg/L, pesticides: 10 µg/L) were then analyzed as their responses were compared.
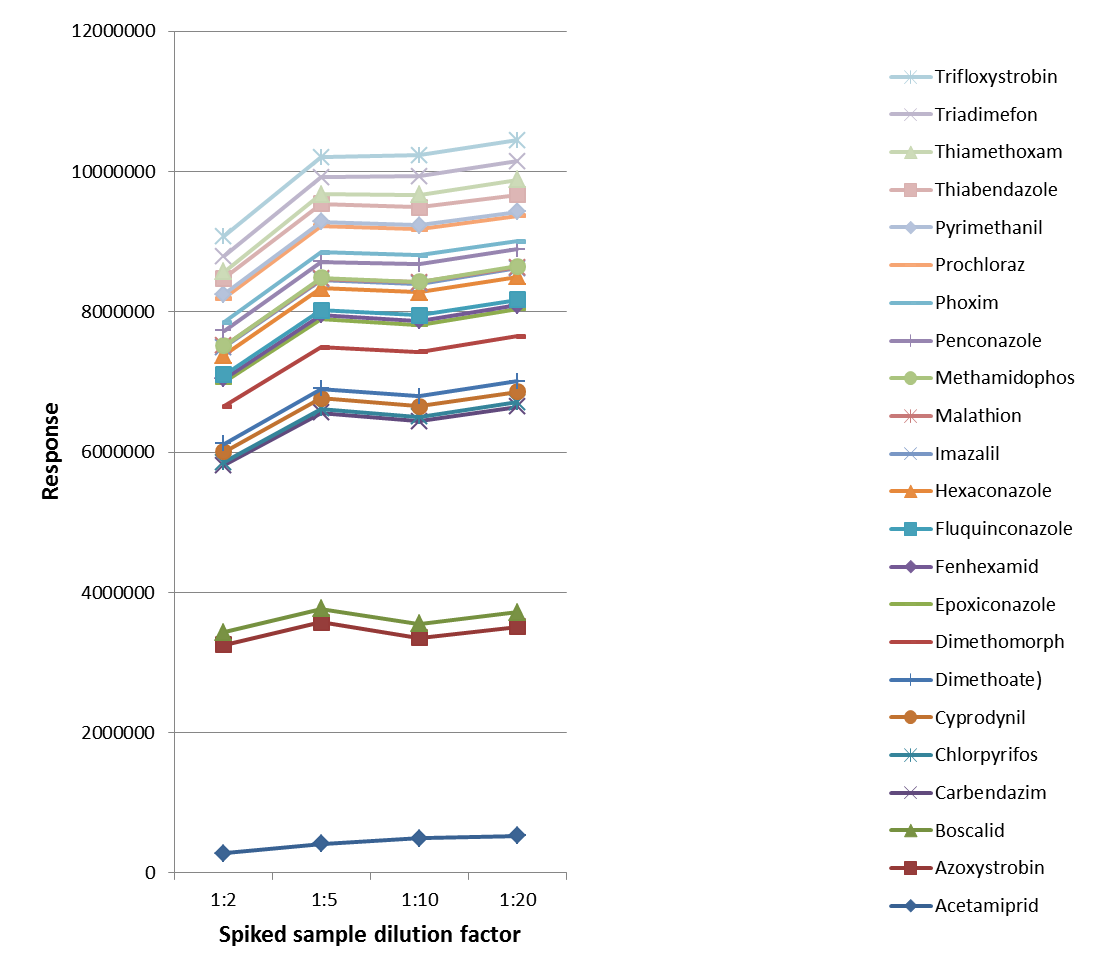
Figure 2. Result of pesticides (10 μg/L) with different dilution factors. Image Credit: PerkinElmer Food Safety and Quality
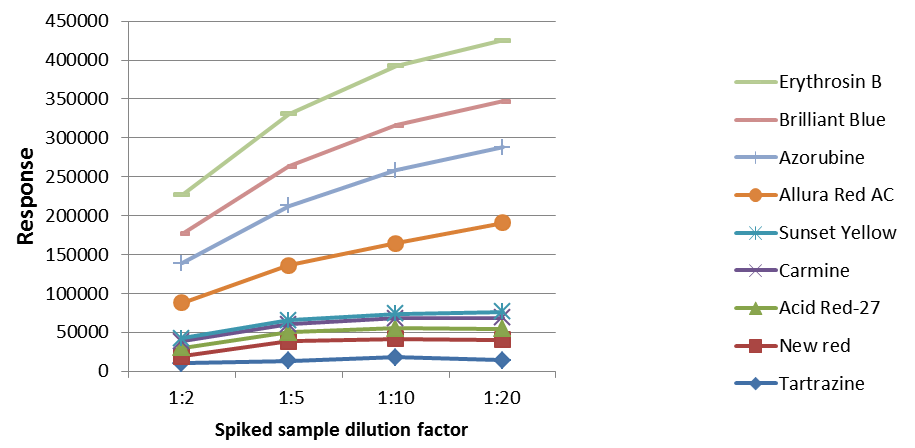
Figure 3. Result of pigments (100 μg/L) with different dilution factors. Image Credit: PerkinElmer Food Safety and Quality
As illustrated in Figures 2 and 3, the increase of the dilutions led to an increase in the responses, implying that sample matrix effects (primarily ions suppressions) could be limited by sample dilutions. Therefore, a 1:10 dilution of the sample was utilized during this study for wine analysis.
Sample clean up treatments using PSA, C18 and GCB were also evaluated for the spiked samples (pigments: 200 µg/L, pesticides: 20 µg/L) with 1:10 dilution of the samples. The results demonstrated that improved responses and recoveries were acquired for most of the analytes evaluated without clean-up, as displayed in Figures 4 and 5.
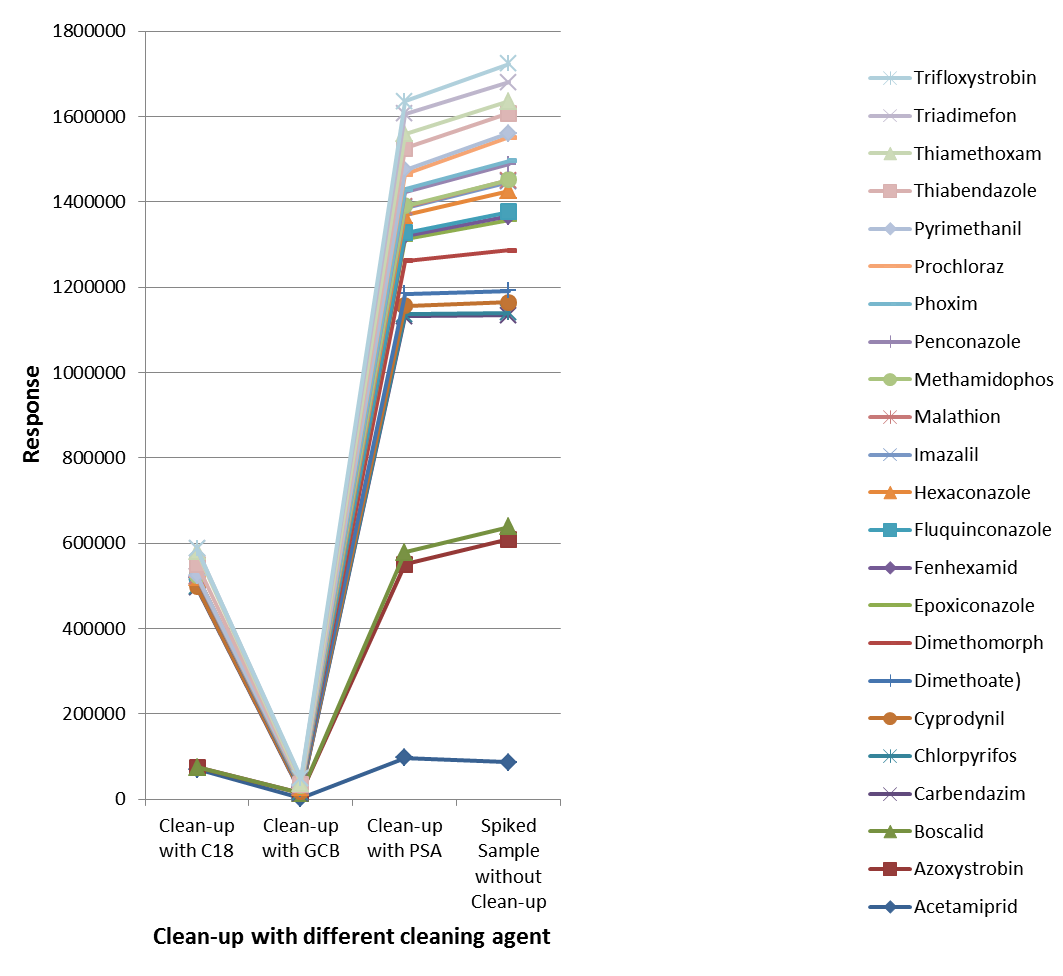
Figure 4. Effects of clean-up steps on responses of the pesticides (20 μg/L). Image Credit: PerkinElmer Food Safety and Quality
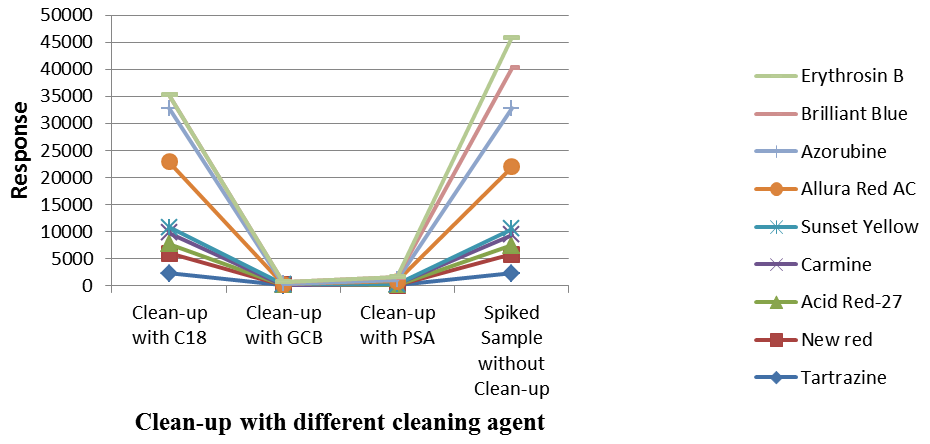
Figure 5. Effects of clean-up steps on response of pigments (200 μg/L). Image Credit: PerkinElmer Food Safety and Quality
After clean-up steps, the lower responses were acquired from the samples, particularly from samples treated with GCB and C18. This was potentially down to the fact these compounds include nonpolar components, which could be lost as a result of retention on the materials during clean up steps.
PSA (primary secondary amines) could be used to eliminate sugars, organic acids, fatty acids, and anthocyanin pigments; C18 was used to eliminate nonpolar contaminants and GCB (carbon) was used to eradicate pigments, sterols, and nonpolar contaminants.
Throughout this study, quantification was achieved using matrix-matched calibration curves. These matrix-matched calibration curves demonstrated excellent linearity across three orders of magnitudes with regression coefficients (R2) more than 0.99, from 1 µg/L to 1000 µg/L for the nine pigments and from 0.5 µg/L to 100 µg/L for the 23 pesticides, respectively.
The recoveries of the analytes were assessed at concentrations of 50, 100 and 500 μg/L, and the evaluation of mean recovery values ranged from 85.0% to 115.0% with RSD.
Table 4. Results of the analytes determined from the 10 real wine samples (in μg/L). Source: PerkinElmer Food Safety and Quality
| Compound |
Sample
01 |
Sample
02 |
Sample
03 |
Sample
04 |
Sample
05 |
Sample
06 |
Sample
07 |
Sample
08 |
Sample
09 |
Sample
10 |
| Acetamiprid |
- |
- |
4.1 |
10 |
- |
- |
- |
- |
- |
- |
| Azoxystrobin |
- |
- |
11.5 |
- |
- |
- |
- |
- |
- |
- |
| Boscalid |
- |
33.5 |
173.1 |
87.3 |
53.1 |
345.8 |
10.7 |
245.5 |
16.1 |
42.4 |
| Carbendazim |
2.8 |
- |
- |
- |
- |
- |
164 |
16 |
- |
- |
| Chlorpyrifos |
3.4 |
- |
- |
- |
- |
- |
- |
- |
- |
- |
| Cyprodynil |
33.9 |
- |
- |
10.8 |
- |
82.6 |
- |
- |
- |
- |
| Dimethoate |
- |
- |
- |
5.7 |
- |
- |
27 |
- |
- |
- |
| Dimethomorph |
- |
- |
- |
- |
- |
134.3 |
90.2 |
100.2 |
- |
- |
| Fenhexamid |
- |
- |
- |
180.3 |
- |
275.8 |
- |
434.4 |
- |
- |
| Pyrimethanil |
- |
- |
- |
43.2 |
- |
- |
115 |
136.4 |
- |
- |
| Thiabendazole |
- |
- |
- |
6.1 |
- |
- |
- |
- |
- |
- |
| Thiamethoxam |
- |
- |
- |
- |
- |
20.2 |
- |
- |
- |
- |
Conclusions
The development of a rapid, sensitive and selective ‘dilute-n-shot’ method has now been validated for the synchronous determination of 23 pesticides and nine pigments in wine. The benefits of the new method include analyzing pesticides and pigments in a single run utilizing UHPLC-MS/MS method.
The results showed that the accuracy and precision of the method were appropriate for analytical laboratories to conduct routine monitoring of these compounds.
References
- Guo J, Zhu K, Zheng S, Chen Q, Lin M. Food and Fermentation Industries, 2017, 43(1):192-198.
- Wang J, Chow W, Leung D. Anal. Bioanal. Chem., 2010, 396:1513–1538.
- Li Y, Zheng Y, Xiong C, Zeng Y,Chen S. Chinese Journal of Chromatography, 2013, 31(8):729-733.
- Gui Q, Liu H, Xu W, Gong Y. Journal of Chinese Mass Spectrometry Society, 2015, 36(2):148-155

This information has been sourced, reviewed and adapted from materials provided by PerkinElmer Food Safety and Quality.
For more information on this source, please visit PerkinElmer Food Safety and Quality.