Due to the metabolic role of some elements in the human organism, the determination of the inorganic profile of oils is vital. On the one hand, there is knowledge of the food's nutritional value referring to minor and major elements.
There is also the need to verify that the food does not contain some minerals in quantities that are toxic for consumers' health, regardless of whether this presence of minerals is due to contamination during the production processes or is naturally occurring.
The basis for further nutritional and food technological investigations such as adulteration detection is oil characterization1. An addition of cheaper vegetable oil to expensive oil is the most common adulteration.
For edible oils and fats, authenticity is a vital quality criterion as there is a big difference in the price of different types of fat and oil products. Adulteration detection is possible by establishing the ratio of the contents of some chemical constituents and assuming these ratios as a constant for a particular oil.
Methods based on atomic spectroscopy can be attractive for adulteration detection.2 With regard to storability, freshness and toxicity, the quality of edible oils can be assessed by the determination of metals.
Trace levels of metals such as Mg, Co, Ca, Fe, Cu, Ni and Mn are known to speed up the rate of oil oxidation. Metals such as Cr, As, Cd, Se etc., are known for their toxicities. The development of accurate, fast analytical techniques for trace element determination in edible oil has been difficult in food analysis and quality control.
Yet, in order to eliminate the organic matrix, sample pre-treatment procedures are needed. These include wet, dry or microwave digestion, dilution with organic solvent and extraction techniques3. The content of metals and their species (chemical forms) in edible seed oils depends on a number of factors.
The metals can be introduced during the production process or incorporated into the oil from the soil. Hydrogenation of edible seed fats and oils has been carried out by utilizing nickel catalysts. The processing equipment can also cause the presence of copper and iron.
Different digestion techniques were used for oil digestion before spectrometric measurements. Due to the associated safety hazards, many of the wet or dry digestion techniques utilized are not recommended for employment in high fat material.
Due to its simplicity, selectivity, high sensitivity and capability for determination in various matrices, GFAAS is a suitable and widely employed method for the trace level determination of metals.
This article outlines the development of a simple technique for the analysis of edible oil samples by utilizing Graphite Furnace Atomic Absorption Spectrophotometer (GFAAS).
Sample preparation has been performed utilizing a microwave digestion system. Metals such as Cr, Cd, Pb, Fe, Ni, Cu, Mn, As, Se and Zn were analyzed using the technique developed.
Experimental
The measurements were carried out using the PerkinElmer® AAnalyst™ 800 Atomic Absorption Spectrophotometer (PerkinElmer, Inc., Shelton, CT, USA) in Figure 1, equipped with WinLab32™ for AA Version 6.5 software, which features all the tools to analyze samples, report and archive data and ensure regulatory compliance.
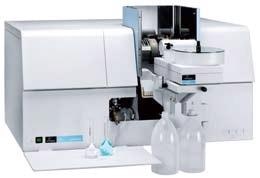
Figure 1. PerkinElmer AAnalyst 800 Atomic Absorption Spectrophotometer. Image Credit: PerkinElmer Food Safety and Quality
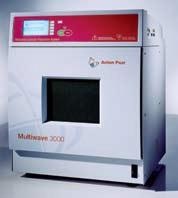
Figure 2. PerkinElmer/Anton Paar Multiwave 3000 Microwave Digestion System. Image Credit: PerkinElmer Food Safety and Quality
Outstanding signal-to-noise ratios are provided by PerkinElmer's high efficiency double beam optical system and solid-state detector. The AAnalyst 800 features longitudinal Zeeman-effect background correction for furnace and the solid-state detector, which is extremely efficient at low wavelengths.
The AAnalyst 800 utilizes a transversely heated graphite atomizer (THGA) which supplies uniform temperature distribution over the full length of the graphite tube. This eliminates the memory effect inherent in the high matrix sample analysis.
The THGA features an integrated L'vov platform which helps overcome potential chemical interference effects common to the GFAAS method. Whenever available, EDL lamps were utilized.
For the microwave-assisted digestion, a Multiwave™ 3000 Microwave system (PerkinElmer/ Anton-Paar) was employed. This is an industrial-type oven that is equipped with several accessories to optimize the sample digestion.
Rotor 8XF100 was used to digest the samples in eight 100 mL high pressure vessels made of PTFE-TFM protected with individual ceramic jackets. TFM is a chemically modified PTFE that has enhanced mechanical properties at high temperatures compared to conventional PTFE.
This vessel has a "working" pressure of 60 bar (870 psi) and temperatures of up to 260 ˚C. For this study, a Pressure/Temperature (P/T) Sensor Accessory was also employed. The P/T sensor measures temperature and pressure for one vessel simultaneously.
All vessels' temperatures were monitored using the IR Temperature Sensor Accessory. During the digestion process, this measures the temperature of the bottom surface of each vessel liner remotely to supply the over-temperature protection to each vessel.
Standards, Chemicals and Certified Reference Material
PerkinElmer single element calibration standards for Atomic Spectroscopy were employed as the stock standards for preparing working standards. All the working standards were prepared daily in Millipore® water (18.2 MΩ cm) acidified in 0.2 % Suprapur® nitric acid.
Merck® Suprapur® nitric acid was utilized for preparing the diluent for standards. By diluting with acidified Millipore® water and adding it to each standard automatically, chemical modifiers were prepared from stock solutions and blank and sample by the autosampler AS 800, an integral part of the AAnalyst 800.
Standards were prepared in polypropylene vials (Sarstedt®) and on volume-by-volume dilution. Micropipettes (Eppendorf®, Germany) with disposable tips were utilized for pipetting solutions.
For quality control, Certified Reference Standard for trace metals in soybean oil from High Purity Standards (Lot # 0827322) was utilized. Multi-element ICP standard for trace metal ions in nitric acid from Spex Certiprep® (New Jersey, USA) prepared at the midpoint of the calibration curve was employed as a quality control check standard.
Sample Preparation
Three common edible oils were bought from a local supermarket and were utilized without any pre-treatments: sunflower oil, coconut oil and soybean oil. Around 0.25 g of each sample, accurately weighed in duplicate, was transferred to the digestion vessels of the microwave digestion system and the sample digestion was performed in accordance with the program shown in Table 3.
0.2 % HNO3 was used to digest the samples, and they were made up to 25 mL in polypropylene vials. Plastic bottles were cleaned by soaking in 10 % (v/v) HNO3 for a minimum of 24 hours and rinsed abundantly in deionized water before utilization.
Table 1 shows the instrumental conditions for furnace experiments, and Appendix I shows the graphite furnace temperature programs. For all the experiments, a heated injection at 90 ˚C was employed.
Pyrolytically coated graphite tubes with integrated platforms were utilized, and to minimize sample contamination, the autosampler cups were soaked in 20 % nitric acid overnight and thoroughly rinsed with 0.5 % HNO3 acid before use.
Prior to sample analysis, five point calibration curves (four standards and one blank) were created for all the metal ions, and the calibration curve correlation coefficient was ensured to be better than 0.999. Depending on the metal ion analyzed, dilution of the order of 1000-10000 was needed.
Results and Discussion
The aim of developing this technique was to create a simple approach for the quantitative analysis of various toxic metals and other trace metals in edible oils.
By incorporating various Quality Control (QC) checks and the analysis of Certified Reference Material (CRM), the validity of the developed technique is ensured.
The QC samples supplied an excellent recovery of between 94-111 %. Excellent spike recovery for these QC samples ranged between 91-109 %. The recovery for the reference soybean oil was between 91-107 %.
Based on the standard deviation of seven replicates of the samples (student t-value of 3.14 for a confidence interval of 98 %), method detection limits (MDLs) were calculated.
The excellent detection limits gathered demonstrate the capability of the AAnalyst 800 in analyzing complex matrices at lower concentrations. For all the metal ions studied, the calibration curves had correlation coefficients as good as 0.999.
Conclusions
A simple technique for the sequential quantitative determination of trace metal impurities in edible oil samples was developed.
The patented THGA tube, which was utilized in the AAnalyst 800, supplied a uniform temperature distribution across its entire length. This removes most interference and eliminates cooler temperatures at the tube ends.
Carry-over and memory effect is eliminated as there is no re-condensation. Accuracy and sample throughput are improved with the THGA tube design by decreasing the time-consuming standard additions method requirement.
The amount of light throughput is doubled with the longitudinal Zeeman effect background correction by eliminating the requirement for a polarizer in the optical system.
All other commercial Zeeman designs incorporate inefficient polarizers, which diminish performance and decrease light throughput.
The AAnalyst 800 provides the lowest detection limits available with this unique design. The heating rate during atomization depends on the input-line voltage in conventional furnace systems. As voltage could vary day to day, season to season or among laboratory locations, so could the heating rate.
To maintain a uniform heating rate, irrespective of the location of the instrument, the high performance AAnalyst 800 utilizes enhanced power control circuitry to ensure that it supplies an outstanding and consistent performance.
The AAnalyst 800 atomic absorption spectrophotometer also generates highly accurate, fast and reproducible results for challenging matrices like edible oil.
The developed technique has been validated by utilizing reference material and the technique has been successfully applied for the analysis of different edible oil samples.
The Multiwave 3000 microwave digestion system has proven to be the perfect tool for digesting difficult matrices like edible oils.
Table 1. Experimental Conditions of AAnalyst 800. Source: PerkinElmer Food Safety and Quality
| Element |
Cd |
Pb |
As |
Se |
Ni |
Cu |
Fe |
Mn |
Cr |
Zn |
| Wavelength (nm) |
228.8 |
283.3 |
193.7 |
196 |
232 |
324.8 |
248.3 |
279.5 |
357.9 |
213.9 |
| Slit (nm) |
0.7 |
0.7 |
0.7 |
2.0 |
0.2 |
0.7 |
0.2 |
0.2 |
0.7 |
0.7 |
| Mode |
AA-BG |
AA-BG |
AA-BG |
AA-BG |
AA-BG |
AA-BG |
AA-BG |
AA-BG |
AA-BG |
AA-BG |
| Calibration |
Linear w/
Calc. int. |
Linear w/
Calc. int. |
Linear w/
Calc. int. |
Linear w/
Calc. int. |
Linear w/
Calc. int. |
Linear w/
Calc. int. |
Linear w/
Calc. int. |
Linear w/
Calc. int. |
Linear w/
Calc. int. |
Linear w/
Calc. int. |
| Lamp |
EDL |
EDL |
EDL |
EDL |
HCL |
HCL |
HCL |
HCL |
HCL |
HCL |
| Current (mA) |
230 |
440 |
380 |
280 |
25 |
15 |
30 |
20 |
25 |
15 |
| Standards (μg/L) |
0.5, 1.0
1.5, 2.0 |
20, 30
40, 50 |
20, 30
40, 50 |
25, 50
75, 100 |
20, 30
40, 50 |
5, 10
15, 25 |
5, 10
15, 20 |
2.5, 5
7.5, 10 |
4, 6
8, 10 |
0.4, 0.8
1, 2 |
| Correlation coefficient |
0.999831 |
0.999799 |
0.999656 |
0.999789 |
0.999735 |
0.999533 |
0.999035 |
0.999581 |
0.999707 |
0.999972 |
| Spike (μg/L) |
1.0 |
10 |
10 |
10 |
5 |
2.5 |
5 |
1.5 |
4 |
0.5 |
| Read time (sec) |
5 |
5 |
5 |
5 |
5 |
5 |
5 |
5 |
5 |
5 |
| Measurement |
Peak Area |
Peak Area |
Peak Area |
Peak Area |
Peak Area |
Peak Area |
Peak Area |
Peak Area |
Peak Area |
Peak Area |
| Injection Temp (°C) |
90 |
90 |
90 |
90 |
90 |
90 |
90 |
90 |
90 |
90 |
| Sample Volume μL |
20 |
20 |
20 |
20 |
20 |
20 |
20 |
20 |
20 |
20 |
| Matrix modifier |
0.05 mg NH4H2PO4 & 0.003 mg MgNO3 |
0.05 mg NH4H2PO4 & 0.003 mg MgNO3 |
0.005 mg Pd and 0.003 mg MgNO3 |
0.005 mg Pd and 0.003 mg MgNO3 |
Nil |
0.005 mg Pd and 0.003 mg MgNO3 |
0.015 mg MgNO3 |
0.005 mg Pd and 0.003 mg MgNO3 |
0.015 mg MgNO3 |
0.005 mg MgNO3 |
| Modifier volume μL |
5 |
5 |
5 |
5 |
0 |
5 |
5 |
5 |
5 |
5 |
Table 2. Program used for Edible Oil Digestion with MDS. Source: PerkinElmer Food Safety and Quality
| Sequence |
Power |
Ramp Time (min.) |
Hold Time (min.) |
Fan |
| 1 |
600 |
5 |
2 |
1 |
| 2 |
900 |
5 |
2 |
1 |
| 3 |
1400 |
15 |
20 |
1 |
| 4 |
0 |
0 |
15 |
3 |
| Weight Taken |
~250 mg |
HNO3 |
5 mL |
| H2O2 |
3 mL |
Rate |
0.3 bar/sec |
| HCl |
1 mL |
Pressure |
55 Bar |
Table 3. Results of Edible Oil Analysis. Source: PerkinElmer Food Safety and Quality
| Metal |
Coconut Oil I μg/g |
Coconut Oil II μg/g |
Sunflower Oil I μg/g |
Sunflower Oil II μg/g |
Soybean Oil I μg/g |
Soybean Oil II μg/g |
| Pb |
<DL |
<DL |
<DL |
<DL |
<DL |
<DL |
| Cd |
<DL |
<DL |
<DL |
<DL |
<DL |
<DL |
| Cr |
0.40 |
0.43 |
1.1 |
1.4 |
0.39 |
0.42 |
| As |
<DL |
<DL |
<DL |
<DL |
<DL |
<DL |
| Se |
0.08 |
0.12 |
0.10 |
0.07 |
0.05 |
0.03 |
| Zn |
0.78 |
0.79 |
0.80 |
1.5 |
3.9 |
2.26 |
| Cu |
0.12 |
0.11 |
0.14 |
0.13 |
0.09 |
0.10 |
| Mn |
0.57 |
0.60 |
0.21 |
0.19 |
0.15 |
0.18 |
| Ni |
0.24 |
0.23 |
4.16 |
5.27 |
0.37 |
0.25 |
| Fe |
7.05 |
6.75 |
3.93 |
4.3 |
4.08 |
4.6 |
Table 4. Results of CRM Analysis (Lot # 0827322). Source: PerkinElmer Food Safety and Quality
| Metal |
Certified Value (μg/g) |
% Recovery |
| Pb |
100 ±1.0 |
100.3 |
| Cd |
Not present |
– |
| Cr |
Not present |
– |
| As |
Not present |
– |
| Se |
Not present |
– |
| Zn |
100 ±1.0 |
94.0 |
| Cu |
100 ±1.0 |
96.1 |
| Mn |
Not present |
– |
| Fe |
100 ±1.0 |
91.1 |
| Ni |
100 ±1.0 |
107.3 |
Table 5. Results of QC and Spike Recovery. Source: PerkinElmer Food Safety and Quality
| Metal |
QC 1 (%) |
QC 2 (%) |
Spike Recovery (%) |
| Pb |
104.6 |
102.9 |
99.9 |
| Cd |
102.0 |
105.6 |
100.1 |
| Cr |
101.8 |
99.0 |
101.6 |
| As |
100.6 |
103.1 |
109.4 |
| Se |
104.3 |
102.5 |
97.7 |
| Zn |
97.3 |
97.3 |
111 |
| Cu |
96.0 |
98.7 |
93.5 |
| Mn |
100.7 |
104.6 |
91.2 |
| Fe |
96.1 |
94.6 |
102.4 |
| Ni |
109.1 |
101.8 |
101.8 |
Table 6. Method Detection Limits (MDLs). Source: PerkinElmer Food Safety and Quality
| Metal |
MDL (μg/kg) |
| Pb |
19.8 |
| Cd |
0.8 |
| As |
48.4 |
| Se |
167.9 |
Appendix I. Graphite Furnace Temperature Program.
Table 7. Source: PerkinElmer Food Safety and Quality
| Element |
Step |
Temp °C |
Ramp Time (Sec) |
Hold Time (Sec) |
Internal Gas Flow (mL/min) |
Gas Type |
| Se |
1 |
110 |
1 |
30 |
250 |
Argon |
| 2 |
130 |
15 |
30 |
250 |
Argon |
| 3 |
1300 |
10 |
20 |
250 |
Argon |
| 4 |
1900 |
0 |
5 |
0 |
Argon |
| 5 |
2450 |
1 |
3 |
250 |
Argon |
| Cd |
1 |
110 |
1 |
30 |
250 |
Argon |
| 2 |
130 |
15 |
30 |
250 |
Argon |
| 3 |
500 |
10 |
20 |
250 |
Argon |
| 4 |
1500 |
0 |
5 |
0 |
Argon |
| 5 |
2450 |
1 |
3 |
250 |
Argon |
| As |
1 |
110 |
1 |
30 |
250 |
Argon |
| 2 |
130 |
15 |
30 |
250 |
Argon |
| 3 |
1200 |
10 |
20 |
250 |
Argon |
| 4 |
2000 |
0 |
5 |
0 |
Argon |
| 5 |
2450 |
1 |
3 |
250 |
Argon |
| Cu |
1 |
110 |
1 |
30 |
250 |
Argon |
| 2 |
130 |
15 |
30 |
250 |
Argon |
| 3 |
1200 |
10 |
20 |
250 |
Argon |
| 4 |
2000 |
0 |
5 |
0 |
Argon |
| 5 |
2450 |
1 |
3 |
250 |
Argon |
| Ni |
1 |
110 |
1 |
30 |
250 |
Argon |
| 2 |
130 |
15 |
30 |
250 |
Argon |
| 3 |
1100 |
10 |
20 |
250 |
Argon |
| 4 |
2300 |
0 |
5 |
0 |
Argon |
| 5 |
2450 |
1 |
3 |
250 |
Argon |
| Fe |
1 |
110 |
1 |
30 |
250 |
Argon |
| 2 |
130 |
15 |
30 |
2 |
50 Argon |
| 3 |
1400 |
10 |
20 |
250 |
Argon |
| 4 |
2100 |
0 |
5 |
0 |
Argon |
| 5 |
2450 |
1 |
3 |
250 |
Argon |
| Pb |
1 |
110 |
1 |
30 |
250 |
Argon |
| 2 |
130 |
15 |
30 |
250 |
Argon |
| 3 |
850 |
10 |
20 |
250 |
Argon |
| 4 |
1600 |
0 |
5 |
0 |
Argon |
| 5 |
2450 |
1 |
3 |
250 |
Argon |
| Zn |
1 |
110 |
1 |
30 |
250 |
Argon |
| 2 |
130 |
15 |
30 |
250 |
Argon |
| 3 |
700 |
10 |
20 |
250 |
Argon |
| 4 |
1800 |
0 |
5 |
0 |
Argon |
| 5 |
2450 |
1 |
3 |
250 |
Argon |
| Cr |
1 |
110 |
1 |
30 |
250 |
Argon |
| 2 |
130 |
15 |
30 |
250 |
Argon |
| 3 |
1500 |
10 |
20 |
250 |
Argon |
| 4 |
2300 |
0 |
5 |
0 |
Argon |
| 5 |
2450 |
1 |
3 |
250 |
Argon |
| Mn |
1 |
110 |
1 |
30 |
250 |
Argon |
| 2 |
130 |
15 |
30 |
250 |
Argon |
| 3 |
1300 |
10 |
20 |
250 |
Argon |
| 4 |
1900 |
0 |
5 |
0 |
Argon |
| 5 |
2450 |
1 |
3 |
250 |
Argon |
Appendix II. Examples of Typical Calibration Curves and Atomization Profiles.
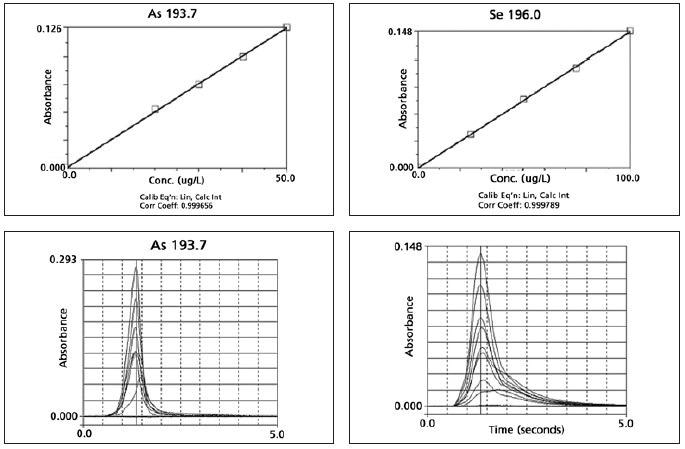
Image Credit: PerkinElmer Food Safety and Quality
References
- C. Cordella, I. Moussa, A.C. Martel, N. Sbirrazzuoli, L. Lizzani-Cuvelier, J. Agric. Food Chem. 50 (2002) 1751.
- P.L. Buldini, D. Ferri, J.L. Sharma, J. Chromatogr. 789 (1997) 549.
- A.N. Anthemidis, V. Arvanitidis, J.A. Stratis, Adnan Menderes University, 4th AACD Congress, 29 Sept. - 3 Oct. 2004.
- L. Allen, P.H. Siitonen and H.C. Thompson, J. Am. Oil Chem. Soc., 1998, 75, 477.
- I. Juranovic, P. Breinhoelder, and I. Steffan, J. Anal. At. Spectrom., 2003, 18, 54.
- P.K. Hon, O.W. Lau, S.F. Luk and C.S. Mok, Anal. Chim. Acta, 113 (1980) 175.
- EPA method 3040 a.
- I. Juranovic Cindric , M. Zeiner , I. Steffan, Microchemical Journal 85 (2007) 136-139.

This information has been sourced, reviewed and adapted from materials provided by PerkinElmer Food Safety and Quality.
For more information on this source, please visit PerkinElmer Food Safety and Quality.