The Rapid Visco Analyzer (RVA) is a cooking stirring viscometer with variable shear profiles and ramped temperature capabilities. The RVA has been optimized for testing viscous properties, making it an ideal choice for assessing the melt characteristics of processed cheese.
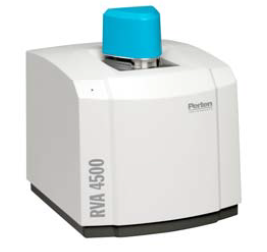
Image Credit: PerkinElmer Food Safety and Quality
The instrument features an array of international standard methods as well as the flexibility to accommodate custom-made profiles.
Its combination of flexibility, speed, precision and automation makes the RVA highly suited to product development, process control and quality assurance.
Description
Cheese viscosity and melting temperature are key quality characteristics for both the processing and consumption of cheeses, for example, mozzarella. A grated cheese’s melt characteristics can be measured in the RVA by introducing a small amount of propylene glycol.
RVA parameters, such as temperature at melting, minimum viscosity and temperature at solidification, provide a good indication of a processed cheese sample’s meltability (Rosenberg et al., 2002).
Minimum viscosity measures the cheese’s flowability when it is held at a fixed temperature, with cheeses with a lower flowability possessing a lower minimum viscosity.
Melting and solidification temperatures provide information on how soon a cheese will begin to melt during heat and how rapidly a cheese will solidify upon cooling.
It is possible for cheeses with identical minimum viscosity values to exhibit different temperatures for melting or solidification (Rosenberg et al., 2002).
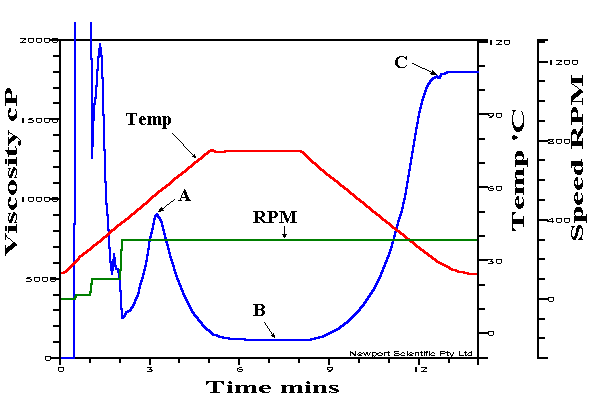
Figure 1. Typical RVA curve for processed cheese. Point A indicates melting of the cheese sample, Point B indicates flowability, and Point C indicates solidification of melted cheese when cooled. Image Credit: PerkinElmer Food Safety and Quality
Method
A 13-minute pasting profile was used for this study.
Sample Preparation
A representative amount of cheese was grated before being returned to the refrigerator for at least 30 minutes. This was done to temper the cheese prior to analysis.
The bottom of a canister was lined with 1.0 g propylene glycol before 14.00 g of grated cheese was. There is no need to use propylene glycol if a processed cheese spread is used – a 15.00 g sample of cheese should be used in this instance.
Profile
Source: PerkinElmer Food Safety and Quality
| Time |
Type |
Value |
| 00:00:00 |
Temp |
25 °C |
| 00:00:00 |
Speed |
0 rpm |
| 00:00:30 |
Speed |
20 rpm |
| 00:01:00 |
Speed |
100 rpm |
| 00:02:00 |
Speed |
300 rpm |
| 00:05:00 |
Temp |
80 °C |
| 00:08:00 |
Temp |
80 °C |
| 00:13:00 |
Temp |
25 °C |
| 00:13:00 |
End |
|
Idle Temperature: 25 ± 1 °C
Time Between Readings: 4 s |
Measure
Measurements were conducted as follows:
- V7: Viscosity at 7 minutes (cP)
- P1V: Peak 1 viscosity (cP) (the melting viscosity)
- P1Ti: Time to peak between 3-5 minutes (min) (the melting time)
- P2V: Peak 2 viscosity (cP) (the solidification viscosity)
- P2Ti: Time to peak between 10-13 minutes (min) (the solidification time)
The cheese melt viscosity index is represented by the viscosity at 7 minutes.
Cheese containing higher levels of fat or moisture will be softer, demonstrating lower values for temperature at melting, solidification and minimum viscosity.
Cheeses with higher levels of total solids and greater ash content will be harder, demonstrating higher values for temperature at melting, solidification and minimum viscosity.
Cheese that has undergone increased proteolysis will be softer and will demonstrate lower values for temperature at melting, solidification and minimum viscosity. The use of emulsifying salt in these cheeses will cause the values for temperature at melting, solidification and minimum viscosity to shift.
It should also be noted that cheeses primarily using phosphates will be firmer, exhibiting higher values than cheeses that contain citrates (Rosenberg et al., 2002).

This information has been sourced, reviewed and adapted from materials provided by PerkinElmer Food Safety and Quality.
For more information on this source, please visit PerkinElmer Food Safety and Quality.