Refractories are composite materials utilized in a range of manufacturing industries due to their excellent resistance to temperature and corrosion. Refractories are a popular choice in steel production applications as they offer protection in heating furnaces, refining vessels and systems working with flowing molten metal.
Refractory oxides are required to withstand extreme operating conditions, including high temperatures (liquid metal temperatures frequently exceed 1650 °C) and extremely corrosive environments.
Erosion and corrosion processes are common issues for any material in contact with liquid oxide slag, molten metal and abrasive surfaces. These processes have a significant impact on refractory stability throughout their service, potentially causing a reduction in service life.
The physical and chemical properties of materials employed in refractory products are, therefore, vitally important in ensuring stability and wear resistance during use. Proper, considered and evidenced material selection is crucial.
Most final refractory products are fabricated using a combination of material types; for example, ceramic (oxide) powders, reactive metals, or carbides and carbon/graphite flakes (though these are less common).
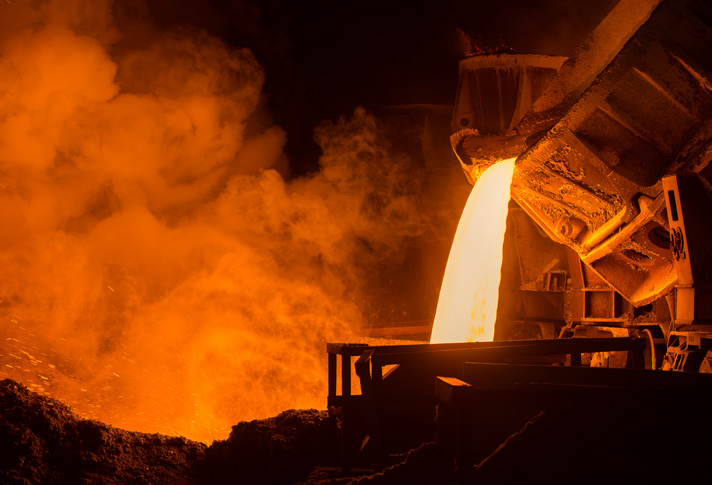
Figure 1. Refractories are used to contain the molten steel. Image Credit: Thermo Fisher Scientific – Electron Microscopy Solutions
Complex Refractories – A Large-Scale Overview
This article explores the characterization of a range of refractory materials. These may be employed in monolithic linings, pressed bricks or in specific carbon-bonded products, such as the stopper rod or submerged entry nozzle used in continuous steel casting.
An example refractory mixture containing zirconia mullite (ZM), brown fused alumina (BFA) and fine-grained fused silica was analyzed, with the different grains mounted in epoxy and polished in order to facilitate analysis.
A large area of the polished section was characterized to provide a good overview of the distribution of various materials. A traditional approach to this task would generate a backscattered electron (BSE) image or a secondary electron (SE) image, but these approaches would fail to illustrate the composition of the grains.
BSE contrast sees grayscale levels altered according to the average atomic number of the material, but this does not provide enough detail to distinguish specific phases or possible contaminations within a mixture of complex refractories.
This article demonstrates a new approach to elemental analysis. This is commonly provided using energy dispersive X-ray spectroscopy (EDS) in a scanning electron microscope (SEM).
However, utilizing the Thermo Scientific™ Axia™ ChemiSEM, the new approach is no longer guided by information retrieved from the SEM image.
The approach is instead guided by elemental information provided in combination with the SEM image (either BSE or SE image) and is displayed instantaneously, thanks to the new ChemiSEM workflow.
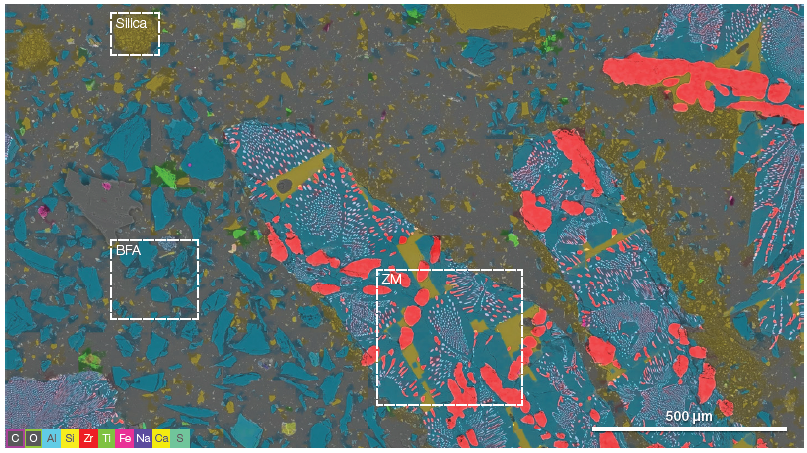
Figure 2. A modern refractory system often contains a range of different grain materials to achieve the desired properties. Being able to easily unravel the distribution of the different materials is important. The three boxes highlight the ZM, BFA, and fine-grained silica grains (acc voltage 15 keV, beam current 0.85 nA). Image Credit: Thermo Fisher Scientific – Electron Microscopy Solutions
Figure 2 displays a ChemiSEM large-area overview with a field of view of over 2 mm. The overview was generated by combining neighboring frames and collecting the EDS signal for every single frame. This was then processed to deliver quantitative information.
The ChemiSEM map provides chemical information on the distribution of the various elements present in the scanned area, enabling discrimination between the different refractories. The potential of this tool to discover unknown elements in the analyzed area offers a rapid, straightforward means of detecting contaminants.
The total acquisition time for the large-area overview map is between 20 and 30 minutes – saving a notable amount of time. It should be noted that the acquisition time depends on the beam current applied and on the number of frames summed for each RoI to increase the EDS signal.
The image highlights three different materials: ZM, BFA and fused silica.
Zirconia Mullite
Zirconia mullite (ZM) compounds offer a range of beneficial properties, prompting their routine use as a raw material in refractory products. Zirconia boasts high refractoriness (Tmelting = 2715 °C) and excellent corrosion resistance against slags.
Both zirconia and mullite (Al2O3.SiO2) exhibit lower thermal expansion coefficients than the more frequently employed alumina or magnesia, resulting in ZM being the material of choice in thermal shock-prone applications like continuous casting nozzles.
ZM is produced via the fusion of zircon sand (ZrO2.SiO2) and alumina (Al2O3) in an electric arc. The liquid oxide is then cooled and pure ZrO2 is partitioned out of the lower melting point mullite matrix.
The large-scale overview (Figure 2) has been utilized as a map to guide additional characterization of the different refractory materials.
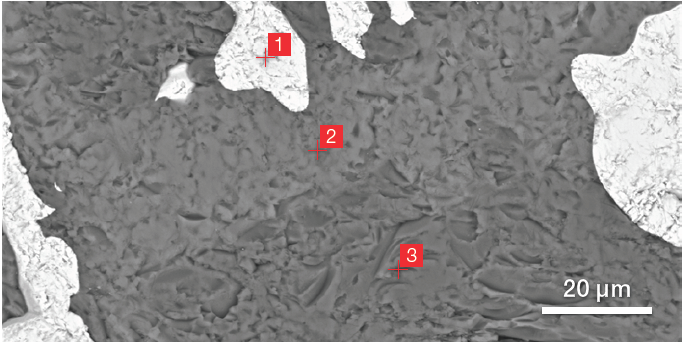
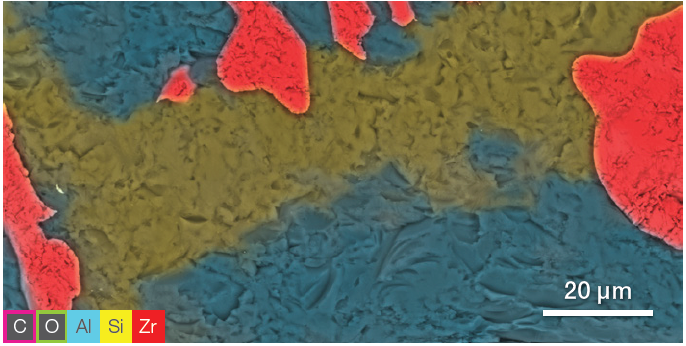
Figure 3. BSE image of ZM (top) and related ChemiSEM image (bottom) (acc voltage 15 keV, beam current 0.44 nA, acquisition time 60 s). Image Credit: Thermo Fisher Scientific – Electron Microscopy Solutions
Figure 3 highlights the primary advantage of a ChemiSEM image over a traditional BSE image - the compositional contrast provided by the BSE detector is only part of the information required to elucidate ZM’s different phases.
Quantitative elemental information coupled to the SEM image helps facilitate complete characterization within a minute. This also involves fewer steps than a conventional EDS workflow.
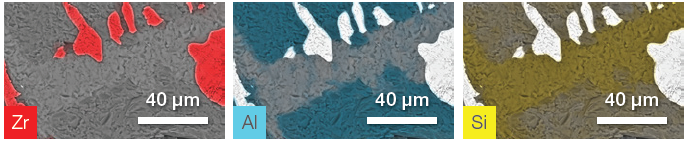
Figure 4. ChemiSEM image showing the Zr, Al, and Si distribution. The other elements have been hidden for a clearer view of the element of interest. Image Credit: Thermo Fisher Scientific – Electron Microscopy Solutions
Using selective visualization, it is possible to determine the distribution of the different elements. ChemiSEM images (Figure 4) highlight Zr, Al and Si distribution. These were saved after the first SEM image acquisition – there was no need to further process or re-acquire the EDS data.
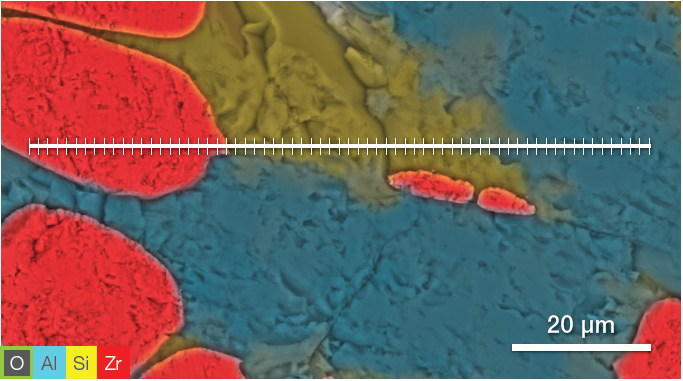
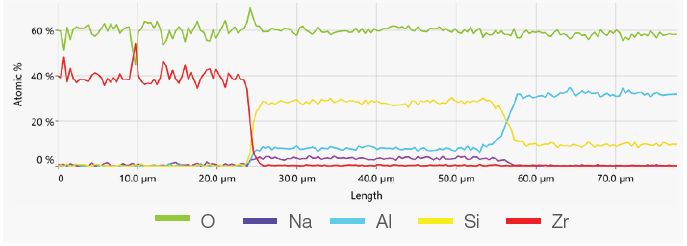
Figure 5. ChemiSEM image showing the position where the linescan has been acquired (top). A 400 s linescan acquired at 15 keV and 0.44 nA beam current (bottom). Image Credit: Thermo Fisher Scientific – Electron Microscopy Solutions
The point analyses and linescan verified the presence of three phases: the zirconia, a silicate phase and the mullite. Point quantifications (Table 1) involved the acquisition of 30-second point analyses in the points indicated in Figure 3 as 1, 2 and 3. The linescan presented in Figure 5 was acquired on a different area.
Table 1. Results of the point quantifications (Atomic %). Source: Thermo Fisher Scientific – Electron Microscopy Solutions
| Element |
Point #1 |
Point #2 |
Point #3 |
| O |
61.2 |
57.3 |
56.1 |
| Zr |
38.8 |
- |
- |
| Al |
- |
8.0 |
33.9 |
| Si |
- |
32.1 |
10.0 |
| Na |
- |
2.6 |
- |
A different phase was identified between the zirconia and the mullite phases. This contaminant oxide phase was found to be primarily composed of silicon (Si), with smaller amounts of sodium (Na) and aluminum (Al).
Sodium was not expected to be present in the ZM. This may have been added to assist melting and was not intended to become part of the product. In this instance, it became incorporated into the material and generated an impurity phase.
The presence of sodium could also be related to the source of alumina employed in the production of the ZM. White fused alumina (WFA) is a potential alumina source and is expected to contain a small amount of sodium (around 0.1%). Sodium is used during the Bayer process to refine the alumina from the bauxite.
Brown Fused Alumina
Brown fused alumina (BFA) is a popular choice for refractory applications; for example, bricks, monolithic and the carbon-bonded nozzles used in continuous casting.
Bauxite consists of aluminum hydroxides and a range of impurities (Na, Ti, Fe and Si). Its ore is employed in the production of alumina and aluminum.
Bauxite’s impurities stem from the fact that it is naturally mined with hematite (Fe2O3), anatase (TiO2), kaolin clay and ilmenite (FeTiO3).
The refinement of alumina from bauxite is achieved via a combination of dry separation and the Bayer process – a process that involves dissolving ores in sodium hydroxide to remove most of the impurities.
It is then possible to fuse this alumina product via electric arc furnace into BFA, or white fused alumina (the more expensive, more refined version of BFA). Characterization was performed on the BFA in a similar manner to the characterization performed on the zirconia mullite.
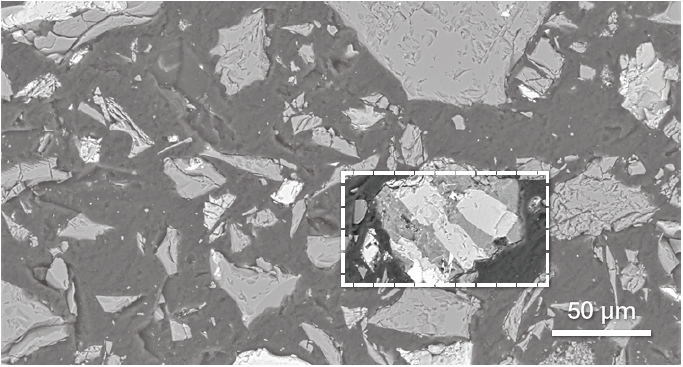
Figure 6. Low-magnification BSE image of BFA. Image Credit: Thermo Fisher Scientific – Electron Microscopy Solutions
Figure 6 displays a representative image of BFA from an SEM. BSE imaging was employed in the main point of this characterization to highlight any compositional differences and determine the presence of contaminants originating from the bauxite ore.
The image highlights the presence of different materials, illustrated by different grayscale levels. One of the grains (signified using a white box) seems to contain different phases.
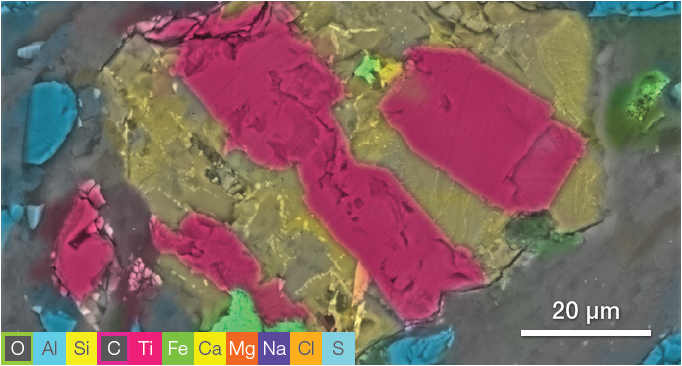
Figure 7. ChemiSEM image acquired at 15 keV (beam current 0.44 nA, acquisition time 60 s). Image Credit: Thermo Fisher Scientific – Electron Microscopy Solutions
ChemiSEM characterization (Figure 7) offers an intuitive distinction between the different elements, allowing the discovery of any contaminants present.
The immediate selection of the elements of interest allowed for the detection of at least three phases:
- The first phase is a Si-Al and Na-rich material (distribution shown in the first row of Figure 8).
- The second phase can be identified as titanium oxide (TiO2) – this was intertwined with the first phase.
- There is also a smaller grain containing Fe and S.
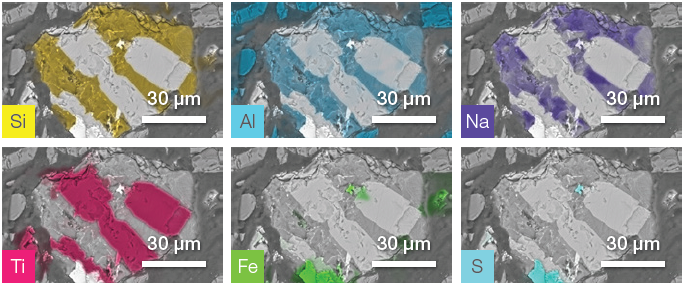
Figure 8. ChemiSEM images of the impurity shown in Figure 7. Image Credit: Thermo Fisher Scientific – Electron Microscopy Solutions
Analysis was rapid, as no post-processing was required to obtain quantitative information. This allowed a further unique impurity to been imaged and characterized.
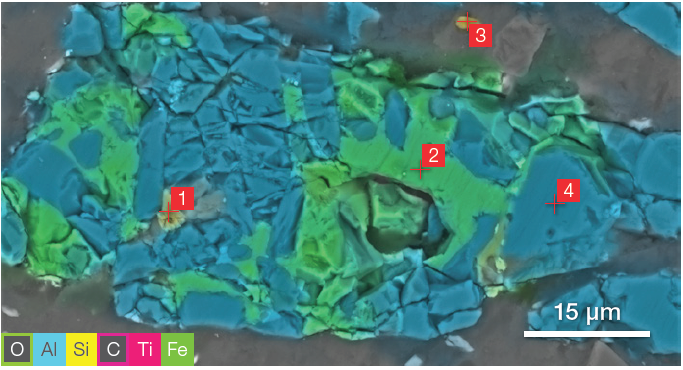
Figure 9. ChemiSEM image (acc voltage 15 keV, beam current 0.44 nA, acquisition time 60 s). Image Credit: Thermo Fisher Scientific – Electron Microscopy Solutions
The distribution of the carbon and oxygen was hidden to avoid potential confusion with the overlay of the different colors and to provide more clarity to the other elements. Different point analyses were acquired in the points marked in Figure 9 for the ZM.
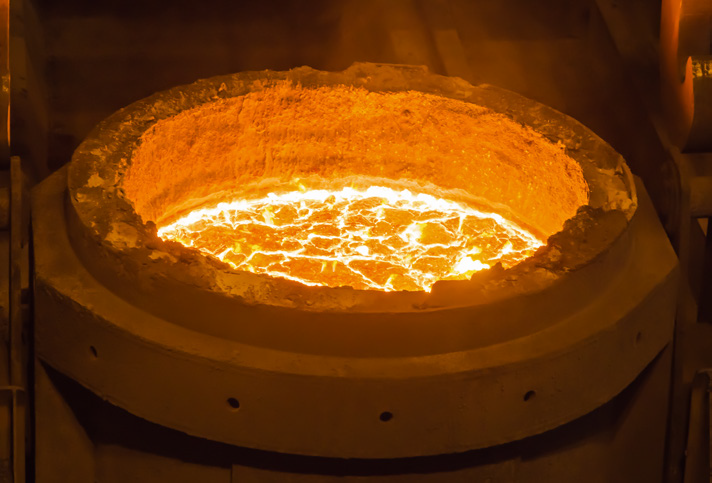
Figure 10. Refractory bricks line this ladle of molten steel at temperatures higher than 1,550 °C while being corroded by slag. Image Credit: Thermo Fisher Scientific – Electron Microscopy Solutions
Point quantifications (Table 2) verified the presence of contaminants in the main phase – alumina – identified in Point 4. It was also noted that silica, Al-Fe oxide and ilmenite (FeTiO3) were also present.
Table 2. Results of point analyses (Atomic %). Source: Thermo Fisher Scientific – Electron Microscopy Solutions
| Element |
Point #1 |
Point #2 |
Point #3 |
Point #4 |
| O |
51.9 |
47.8 |
66.5 |
55.0 |
| Al |
1.1 |
32.5 |
- |
45.0 |
| Si |
- |
- |
33.5 |
- |
| Ti |
24.0 |
1.1 |
- |
- |
| Fe |
23.0 |
18.6 |
- |
- |
Conclusion
Refractory materials are a key component of the steelmaking process and related applications. These applications feature an array of harsh conditions and extreme working environments, requiring the use of refractories that offer consistently high performance throughout their service lives.
The primary requirements for refractory linings and shaped products are exceptional resistance to corrosion and high thermal shock resistance.
A range of methods will be used to guarantee these specifications are met, but these materials must be robustly characterized prior to their use to ensure the proper distribution of phases within the final composite.
Each material characterized will likely include different types of contaminants, dependent upon its specific manufacturing process.
The novel approach to chemical identification made possible by the Axia ChemiSEM’s ‘always on’ chemical analysis offers new potential for the rapid, straightforward discovery of unknown elements and materials.

This information has been sourced, reviewed and adapted from materials provided by Thermo Fisher Scientific – Electron Microscopy Solutions.
For more information on this source, please visit Thermo Fisher Scientific – Electron Microscopy Solutions.