There has been a significant interest in and investigation into the effects of introducing carbon-fluorine bonds into organic compounds. This process can substantially affect organic compounds’ physical and chemical properties, particularly when compared to their non-fluorinated analogs.1
Image Credi: Analytik Jena US
Most of the critical products in the chemical and life-science sectors depend on organic fluorine chemistry for their functional and beneficial properties, including pharmaceuticals, polymers and both fine and specialty chemicals.
Fluorinated organic substances are being produced in increasingly large volumes, resulting in their increasing release into the environment, with both the Stockholm Convention (Annex B-restriction) and the European water framework directive (WFD) already listing these substances as persistent organic pollutants.
Per- and polyfluoroalkyl substances (PFAS) represent a wide-ranging class of synthetic chemicals that present a range of analytical challenges, including their widespread presence in environmental samples.2
PFAS have the potential to contaminate public drinking-water systems serving an estimated 19 million people in the US, prompting the United States Environmental Protection Agency (EPA) to implement a robust and urgent PFAS Action Plan – the most detailed and far-reaching cross-agency plan to date aiming to address an emerging chemical of concern.2,3
The EPA has established a non-enforceable health advisory level of 70 parts per trillion (ppt) in drinking water for the total amount of pentadecafluorooctanoic acid (PFOA) and heptadecafluorooctanesulfonic acid (PFOS).
Throughout 2021, the EPA has been working to develop a rapid screening tool able to identify total PFAS presence and absence. This upcoming standard operating procedure (SOP) will be suitable for quantifying Total Organic Fluorine (TOF).4
This has necessitated the development of a sensitive, rapid and straightforward TOF detection method suitable for monitoring and managing environmental pollution.
This method makes use of solid-phase extraction (SPE) and high-resolution–continuum source graphite furnace molecular absorption spectrometry (HR-CS GF MAS).
The solid phase extraction (SPE) procedure has been fully discussed in other studies, detailing its potential for the extraction of fluorinated compounds. These studies saw HR-CS GF MAS employed in the detection of total fluorine via in-situ formation of gallium(I) fluoride (GaF) molecules.
The study presented here aimed to enhance the performance of Total Florine (TF) analysis in wastewater using a combination of novel calibration strategies and the optimization of the HR-CS GF MAS method.
Method Development Strategy
It was necessary to develop and optimize a species-unspecific response for HR-CS GF MAS to enable the quantification of fluorinated organic compounds as a sum parameter.
Previous research had highlighted the suitability of gallium in enabling the most sensitive fluorine detection via diatomic GaF formation. GaF’s characteristic molecular absorption can be detected via HR-CS GF MAS.
The furnace tube was conditioned with the molecule forming agent (Ga) and modifiers (Pd/Mg/Zr/Ba) prior to sample injection to achieve an optimal signal.
Existing literature confirms that the melting point and vapor pressure of fluorinated compounds can have a considerable effect on different compounds’ recovery rates. To account for this, the furnace program’s drying and pyrolysis procedures were optimized to help minimize the potential losses of fluorinated compounds.
To enable the effective evaluation of the optimization approach, a total of 24 different fluorine compounds were mixed to act as a QC sample. These 24 compounds were selected to include varying numbers of fluorine atoms and boiling points.
Using this QC sample, it was possible to develop calibration strategies to obtain the best recovery rate.
Materials and Methods
Reagents
- Ultrapure grade HNO3
- 0.05% TritonX-100
- Pd/Mg/Zr modifier (1 g/L Pd, 0.5 g/L Mg, 0.02 g/L Zr)
- Ba modifier (10 mg/L)
- Ga solution (10 g/L)
- Zr stock solution (1 g/L)
- Certified F stock solution (0.1 g/L F ICP standard as NaF)
- Heptadecafluorooctanesulfonic acid solution (PFOS, 100 μg/mL in methanol, analytical standard)
- Pentadecafluorooctanoic acid solution (PFOA, 100 μg/mL in methanol, analytical standard)
Samples
- QC sample: 24 fluorinated organic compounds mixture (TOF about 128 µg/L)
- Wastewater sample
Instrumentation
A contrAA® 800 G graphite furnace AAS with AS-GF autosampler was employed throughout this study. This was controlled using the ASpect CS software, enabling the determination of fluorine.
Prior to use, the graphite tube was coated six times with zirconium (35 µL stock solution). It was then possible to determine fluorine content by measuring the intensity of the gallium monofluoride absorption band.
Fluorine is converted stoichiometrically to GaF in the presence of gallium throughout the analysis process. A conditioning procedure was included in the furnace program to improve sensitivity, and each individual sample was analyzed with three replicates.
Table 2 and Table 3 provide details of both the method settings and furnace program.
Table 1. Instrument specifications. Source: Analytik Jena US
| Parameter |
Specification |
| Instrument |
contrAA 800 G |
| Furnace tube type |
PIN platform |
| Autosampler |
AS-GF |
| Injected volume |
4-20 µL (standards), 20 µL (sample) |
| Rinsing solution |
2% HNO3, 0.05% TritonX-100 |
Table 2. Method settings and evaluation parameters. Source: Analytik Jena US
| Molecule |
Wave-length [nm] |
No. of eval. pixels |
T Pyr. [°C] |
T Atomis. [°C] |
Ramp [°C/s] |
Meas. Time [s] |
Modifier |
Baseline correction |
| GaF |
211.248 |
5 |
500 |
1450 |
1200 |
5 |
5 µL Pd/Mg/Zr modifier*
5 µl Ga solution*
3 µl Ga solution
5 µl Ba solution |
IBC |
Note: *-use in the conditioning step
Table 3. Furnace program for detection of GaF molecule. Source: Analytik Jena US
| Step |
Name |
Temp (°C) |
Ramp (°C/s) |
Hold (s) |
Gas purge |
| 1 |
Drying* |
80 |
6 |
5 |
max |
| 2 |
Drying |
100 |
6 |
5 |
max |
| 3 |
Drying |
160 |
10 |
5 |
max |
| 4 |
Drying |
350 |
25 |
10 |
max |
| 5 |
Drying |
1100 |
500 |
12 |
max |
| 6 |
Drying |
70 |
NP |
10 |
max |
| 7 |
Drying^ |
80 |
2 |
10 |
max |
| 8 |
Drying |
110 |
5 |
15 |
max |
| 9 |
Pyrolysis |
250 |
50 |
5 |
max |
| 10 |
Pyrolysis |
500 |
200 |
5 |
max |
| 11 |
Gas adaption |
500 |
0 |
5 |
stop |
| 12 |
Atomization |
1450 |
1200 |
5 |
stop |
| 13 |
Clean |
2450 |
1200 |
4 |
max |
Note: *-modifier injection for pretreatment, ^-sample injection
Calibration Strategy
The melting point and vapor pressure of the fluorinated compounds play an important role in the analysis of total fluorine.
Should the vapor pressure at a given temperature of the respective substance be high, the analyte may be transferred into the gas phase and transported via the furnace program’s argon stream before it can be detected and analyzed.
To mitigate this risk, it is important that calibration standards be selected to ensure these exhibit similar behaviors to the samples themselves. Three different calibration sets were, therefore, prepared to find the best calibration strategy for the wastewater (Table 4).
Table 4. Concentration sets. Source: Analytik Jena US
| Calibration Set |
F Compounds |
Ratio |
| Inorganic F |
NaF |
|
| Organic F |
PFOS, PFOA, HFPO-DA |
1:1:1 |
| Inorganic and organic F mixture |
NaF, PFOS, PFOA, HFPO-DA |
1:1:1:1 |
A 1000 ppm NaF stock solution was used to prepare calibration standards for the inorganic fluoride calibration (inorganic F).
A total of three frequently encountered fluorinated compounds - PFOS, PFOA and HFPO-DA - were used to generate organic fluorine (organic F) standards, while the inorganic and organic mixture standard was generated using NaF, PFOS, PFOA and HFPO-DA.
Table 5 displays the standards’ concentrations, absorbances and the overall linearity of calibration. The calibration curve and measured blank values revealed that it was possible to achieve the lowest LOD (4.00 µg/L) using the inorganic and organic mixture calibration.
Inorganic fluoride calibration standards exhibited the highest signal, while the organic calibration standards showed the lowest (Table 5). It was determined that the thermal stability of organic and inorganic substances impacted their different signal responses.
Table 5. Type and quality of calibration. Source: Analytik Jena US
| Name |
Conc. |
Inorganic F |
Organic F |
Inorganic and organic mixture |
| Unit |
µg/L |
Abs |
Abs |
Abs |
| Cal-Zero1 |
0 |
0.1726 |
0.1153 |
0.1709 |
| Cal-Std1 |
125 |
1.6650 |
0.5177 |
1.1601 |
| Cal-Std2 |
250 |
3.0402 |
1.0367 |
1.7833 |
| Cal-Std3 |
375 |
4.4542 |
1.4847 |
2.4628 |
| Cal-Std4 |
500 |
5.9955 |
1.9403 |
3.0694 |
| R2 |
|
0.9993 |
0.9999 |
0.9808 |
| LOD (µg/L) |
|
7.74 |
12.58 |
4.00 |
A number of volatile PFAS are lost to a degree throughout the furnace program’s drying and pyrolysis steps, but inorganic fluoride remains thermally stable during this process.
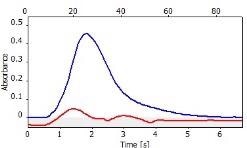
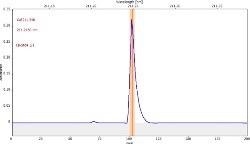
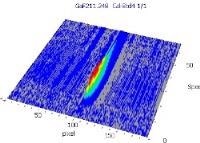
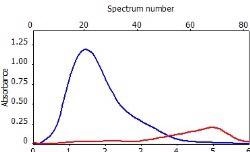
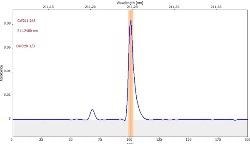
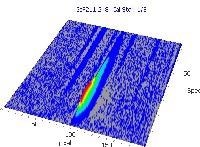
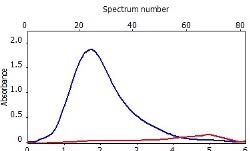
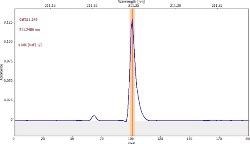
Table 6 displays clear, interference-free GaF absorbance spectra (blue) at 211.248 nm from the three calibration sets.
Table 6. Characteristic signal shape and spectral vicinity of the analyte line. Source: Analytik Jena US
| Element |
Signal profile* |
Spectral vicinity |
3D spectrum |
| Inorganic F Cal 4 |
 |
 |
 |
| Organic F Cal 4 |
 |
 |
 |
| Inorganic and organic mixture Cal 4 |
 |
 |
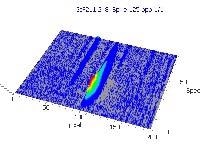 |
*-blue: GaF analyte signal, red: background signal
Results and Discussion
Inorganic F Calibration Strategy Results
The QC standard of 24 fluorinated organic compounds shows a 38% recovery rate throughout the inorganic F calibration strategy (Table 7).
Variations in signal response result in low PFAS recovery rates when employing NaF solutions as the calibration standard. The QC sample demonstrates a good spike recovery rate of 114% when spiked with 100 µg/L F (as NaF).
Table 7. Measurement results by inorganic F calibration. Source: Analytik Jena US
| Samples |
Conc. (µg/L) |
Recovery (%) |
| Blank water |
<LOQ |
|
| QC sample |
48.9 |
38 |
| QC sample spiked with 100 µg/L (NaF) |
162.5 |
114 |
| Wastewater |
348.2 |
|
Organic F Calibration Strategy Results
The QC sample’s recovery is 190% with the organic F calibration strategy. This overestimation of PFAS is the result of the varying thermal stabilities of the different organic fluorinated compounds.
Spiking the QC with 100 µg/L NaF yielded a 275% spike recovery rate due to the more robust stability and the improved signal response of NaF.
The QC and wastewater samples were both spiked with 125 µg/L F from the TOF mixture; a mixture made up of the same compounds as the organic calibration standards. Spike recovery rates for both the QC and wastewater were found to be 74%.
Table 8. Measurement results by organic F calibration. Source: Analytik Jena US
| Samples |
Conc. (µg/L) |
Recovery (%) |
| Blank water |
<LOQ |
|
| QC sample |
224.7 |
174 |
| QC sample spiked with 125 µg/L F (TOF*) |
316.7 |
74 |
| QC sample spiked with 100 µg/L F (NaF) |
628.1 |
275 |
| Wastewater |
4882.5 |
|
| Wastewater (1:50 dilution) spiked with 125 µg/L F (TOF*) |
|
74 |
*TOF = PFOS, PFOA, HFPO-DA (ratio 1:1:1)
Inorganic and Organic Mixture Calibration Strategy Results
The organic and inorganic F mixture calibration strategy was determined to offer the best approximation of sample analyte characteristics, as illustrated in Table 9.
QC sample recovery rate was determined to be 100%. Both the QC sample and wastewater sample were spiked with 125 µg/L F from the TF mixture.
Compounds in the TF mixture are identical to those in the inorganic and organic mixture calibration standards.
Spike recovery rates were determined to be 85% and 86% for the QC sample and wastewater sample, respectively.
The QC sample was also spiked with inorganic F, yielding an overestimated recovery rate of 167% due to the increased thermal stability of inorganic NaF.
A comparison was performed between the three calibration strategies. This highlighted the significant impact of calibration components on analysis results, further highlighting that the inorganic and organic F mixture calibration strategy was the optimal choice for this specific QC sample.
Table 9. Measurement results by inorganic and organic mixture calibration. Source: Analytik Jena US
| Samples |
Conc. (µg/L) |
Recovery (%) |
| Blank water |
<LOQ |
|
| QC sample |
127.6 |
100 |
| QC sample spike with 125 µg/L F (TF*) |
252.6 |
85 |
| QC standard spike with 100 µg/L F (NaF) |
380.9 |
167 |
| Wastewater |
1936.5 |
|
| Wastewater (1:50) spike with 125 µg/L F (TF*) |
|
86 |
*TF = NaF, PFOS, PFOA, HFPO-DA (ratio 1:1:1:1)
Long-Term Stability Test
To assess the long-term stability of this method, tests were performed on the QC sample on three separate days, each one week apart.
These three tests utilized Test 1’s calibration curve with no recalibration, yielding an RSD of 5.7% of those three tests during this period (Table 10). This confidently establishes the method’s long-term stability.
Table 10. Long-term stability test. Source: Analytik Jena US
| |
Conc. (µg/L) |
RSD (5 Replicates) |
| Test 1 (week 1) |
127.6 |
3.8 % |
| Test 2 (week 2) |
113.8 |
3.0 % |
| Test 3 (week 3) |
120.2 |
2.7 % |
| Average Conc. |
120.5 |
|
| RSD |
5.7 % |
|
Blank Value
Relatively high blank values were observed during method optimization. This was largely due to the carry-over effect in the sample introduction system.
The addition of HNO3 and TritonX-100 to the rinsing solution resulted in a lower blank value. It is important to utilize F-free modifiers throughout this process, and it is advisable to use high purity salt to prepare these, such as Gallium (III) nitrate hydrate.
Conclusion
The study presented here demonstrated a rapid, straightforward and sensitive complementary method for total fluorine analysis in wastewater.
The study illustrated the successful application of the MAS method using the contrAA 800 G instrument for measurements. The optimized furnace program and calibration strategy were found to provide high sample throughput, sensitivity and accuracy.
A period of 3.5 minutes per replicate is required per sample, with a 100% QC sample recovery rate achieved using an inorganic and organic mixture calibration strategy. It was also possible to achieve the lowest LOD (4 ppb) using an inorganic and organic mixture calibration strategy.
Results of fluorine determination via HR-CS GF MAS exhibit good reproducibility and long-term stability. This method did not require any additional cleaning steps, and it was demonstrated that sample dilution and spiking could be easily achieved using an AS-GF autosampler.
References
- Richard, D.; Chambers, F.R.S.; FLUORINE IN ORGANIC CHEMISTRY. Blackwell Publishing Ltd. 2004
- EPA Press Office; AGGRESSIVELY ADDRESSING PFAS AT EPA; https://www.epa.gov/; 2020 Jan
- Cheryl H.: WHY LIMITING PFAS IN DRINKING WATER IS A CHALLENGE IN THE US. Chemicals and Engineer News. 2020 Jul; 98 (27)
- https://www.epa.gov/water-research/pfas-analytical-methods-development-and-sampling-research
- Metzger, M.; Ley, P.; Sturm, M. and Meermann, B.; SCREENING METHOD FOR EXTRACTABLE ORGANICALLY BOUND FLUORINE (EOF) IN RIVER WATER SAMPLES BY MEANS OF HIGH-RESOLUTION-CONTINUUM SOURCE GRAPHITE FURNACE MOLECULAR ABSORPTION SPECTROMETRY (HR-CS GFMAS). Anal Bioanal Chem. 2019 Jul; 411 (19): 4647-4660

This information has been sourced, reviewed and adapted from materials provided by Analytik Jena US.
For more information on this source, please visit Analytik Jena US.