The pervasive presence of microplastics is now well-documented. Many projects are currently evaluating the complete scope of microplastic pollution and its potential risk to both humans and the environment.
The quantity, composition and size distribution of encountered particles are primary factors in most studies. Efforts are being made toward establishing standardization of the core analytical methods, but a general consensus has not yet been achieved.1,2,3
Methods for Microplastic Analysis
There are two main approaches to microplastic analysis: Mass-focused techniques rely on mass-spectrometry and offer precise mass distributions for the most frequently encountered polymer types.
Particle-driven techniques are concentrated on the number, identity and size distribution of particles and are predicated on various microscopic methods.

Real-life microplastic sample: Filter loaded with all kinds of sample material. Image Credit: Bruker Optics
This article will focus on the latter of these techniques. The most straightforward method to locate particles is visual microscopy.
While it can indicate the presence of particles, it does not yield information on particle composition since it does not have the capacity to differentiate between materials eg. naturally occurring and synthetic particles.
Nile red staining can assist in distinguishing plastic from non-plastic. However, ascertaining the polymer type remains impossible, and it is not possible to stain every polymer type.
It should be highlighted that identification is the most critical part of understanding the origin of the contamination. While visual microscopy can offer an initial indication, a method that not only finds particles but also precisely identifies them is much needed.4, 5
Microspectroscopy offers a straightforward solution to these problems. Here, microscopy is paired with single-point spectroscopic methods, including Raman, FT-IR or IR laser spectroscopy.
By analyzing particles individually, details on the chemistry and composition of the sample are acquired, facilitating the identification of the polymer.
Unfortunately, single-point microspectroscopy and visual microscopy share a major drawback; particles must first be visually recognizable prior to analysis.
Therefore, tiny and transparent particles may be overlooked, and any particle agglomerates, which are not separated properly, are typically detected as one big particle.
With the extensive availability of FT-IR FPA imaging technology, the detection and identification of particles can be solely based on spectral information.
Evaluating the complete sample in this way gets rid of the need for prior particle detection, ensuring every particle on the filter is captured. Samples are measured at extremely high speeds, in their whole, and with exceptional spatial resolution.
In this article, it is argued that combining micro FT-IR imaging and automated data analysis offers a practical solution ideally suited to conducting comprehensive, quantitative microplastic particle analysis.
A fully automated measurement and evaluation approach eliminates human error while representing the most effective and reproducible method available to date.6

Figure 1. FT-IR spectrum of ABS. The spectral range accessible by QCL is marked in red. The nitrile band (2250 cm-1, blue) is not accessible as well as the C-H and N-H region (green) that holds further important information about the particle identity. Image Credit: Bruker Optics
Plastic Identification by (FT-)IR
When it comes to the identification of unknown substances, FT-IR spectroscopy is a well-established method. It is particularly good for organic compounds, such as the polymers that microplastics are made of.
Each polymer has a specific absorption pattern of IR radiation and can be identified by comparing this pattern to a reference.
Classical FT-IR can be universally applied and covers the mid-infrared region from 600 – 4000 cm-1, enabling the identification of almost every polymer that exists.
Distinct features such as a nitrile band (around 2250 cm-1, marked in blue) or C-H and N-H stretching bands (2700 – 3600 cm-1, marked in green) are readily available, assisting the distinction of copolymers with a similar backbone (e.g., PS/ABS/SAN).
IR techniques that utilize a laser source (QCL) have a spectral range limited to about 950 – 1800 cm-1 (marked in red). They therefore lack the ability to detect the key spectral signatures in the higher wavenumber range.
FT-IR Measurement Techniques
In principle, there are three fundamental measurement techniques in FT-IR microscopy:
- Transmission mode, which is the method of choice for IR transparent materials. This approach is non-contact and generates good spectral quality and rapid measurement speeds.
- ATR delivers exceptional spectral quality but necessitates contact. This ATR-crystal, which acts as a measurement interface, must be cleaned manually to prevent particle cross-contamination. This is not only labor-intensive but also complicates automation. In addition, harder particles, including glass, carbonates or sand can cause damage to the crystal.
- Transflection presents a greater challenge. Since the IR light passes through the sample twice, total absorption is achieved twice as fast, limiting the maximum size of particles that can be identified. Furthermore, IR spectra in transflection are known to demonstrate complex mixtures of specularly and diffusely reflected light that impede the identification of transflection spectra by established ATR libraries.
Sample Preparation and Particle Recognition
After using the initial pre-treatment to remove organic and inorganic residues (e.g., sand and plant material), the particles are usually suspended in water and filtered onto an appropriate IR transparent filter (e.g. aluminum oxide).
Subsequently, contactless measurements in transmission can then be to obtain clean spectra, clean spectra ideal for evaluation.
Note that even with elaborate pre-treatment, for many samples it is virtually impossible to eradicate all debris and residues from the environmental matrix. So, not everything that is found on a filter is also a microplastic particle.
For FPA IR imaging techniques, this does not present issues, but for single-point IR & Raman methods, this is a significant drawback since the more residue left behind, the more difficult the visual-contrast-based detection of particles is.
In fact, particles might be missed entirely (like the transparent particle in Figure 4), or user time is wasted measuring non-plastic particles that, in the worst case, end up polluting the particle statistics.
Assessing Applicability and Constraints
Generally, visual (Fig. 2) particle recognition is extremely unspecific and lacks the capacity to distinguish between particles and surface alterations (e.g., fibers/scratches).

Figure 2. Individual particle recognition. Image Credit: Bruker Optics
Likewise, QCL methods predicated on the contrast of IR scattering at a single wavenumber also encounter such difficulties. The dependence on an arbitrary threshold means that both are not able to detect transparent or low-contrast particles.
Single wavenumber scanning QCL systems that follow a pointwise measurement approach, show a strong drop in particle detection efficiency below 60 microns.10 These systems are commercially available but underestimate the fraction of small particles with varying levels of unpredictability.
Microplastic particles also tend to agglomerate in concentrated suspensions and will overlap on the filter. Here, non-specific contrast methods will detect such agglomerates as a single particle, offering only a single measurement point, although multiple would be required (Fig. 3).

Figure 3. Particle agglomerate. Image Credit: Bruker Optics
At low particle load, results are still passable, but with overcrowded filters (Fig. 4), contrast-based methods break down completely.

Figure 4. Densely loaded filter. Image Credit: Bruker Optics
Accordingly, these techniques present stringent requirements for sample preparation and may necessitate total removal of the sample matrix (e.g., sediment). Thus, dilution, aliquot sampling and preparation on dedicated sample carriers might be needed.
Ultimately, the application of visual and QCL contrast methods is severely restricted.
The Role of Raman Spectroscopy
Due to the lack of array detectors, Raman microspectroscopy is reliant on particle recognition by visual contrast and subsequent single-point Raman measurements.
All of the limitations mentioned in relation to contrast-based particle detection apply, leading to a significant increase in the time required to measure entire filters.
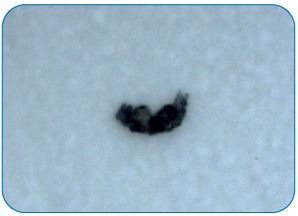
Figure 5. Dark microplastic on filter. Image Credit: Bruker Optics
Still, Raman has the capacity to analyze particles as small as 1 µm, while the diffraction limit limits IR measurements to particles around 5 µm in size.
For microplastics of this size, however, the Raman signal-to-noise ratio is inherently low, and the measurement parameters (excitation lasers, integration times, laser power, etc.) must be matched individually to the particle of interest, hindering measurement automation.4
Furthermore, Raman spectroscopy presents exceptionally stringent requirements for sample cleanliness.
Real environmental samples such as the filter displayed in Figures 8 (IR) and 13 (visual) cannot be measured with Raman. This can be put down to the reasons concerning particle detection, as detailed earlier.

Figure 6. Fluorescence dominates the Raman spectra of the particle in Fig 5. Image Credit: Bruker Optics

Figure 7. Filter and particle were burned during Raman measurement. Image Credit: Bruker Optics

Figure 8. FT-IR image of a complete filter (diameter of ~18 mm), measured with 5 μm pixel resolution and 8 cm-1 spectral resolution in ~3.5 hours. Image Credit: Bruker Optics
Moreover, the measurement process is significantly impacted by the presence of (organic) matrices, which can lead to fluorescence or artifact signals. In the end, Raman microscopy for microplastic analysis is limited to few specific cases, and broad applicability is prevented.
Reasons why Raman typically falls short in particle analysis are:
- Agglomeration and overlapping of particles
- Raman spectra are influenced by fluorescence effects (Fig. 6)
- Sample destruction due to dark particles being burnt by the laser (Fig. 7)
- Polymer fillers may impede the base polymer spectrum
- Difficulty identifying distinct polymers with a similar backbone (e.g., ABS/SAN)
Why FPA IR Imaging Shows No Drawbacks
FT-IR (FPA) imaging avoids the obstacles of visual particle detection entirely. True FPA IR imaging enables the measurement of completely filters (Fig. 8) in a short period of time.
With no visual selection required, evaluation is based solely on spectral data and makes sure that all particles present on the filter are measured and evaluated.
This method is not impacted by particle load and has the capacity to tolerate the presence of (organic) sample matrices.
Each and every particle on a filter is analyzed. If there is an overlapping of particles, they can be distinguished directly by their spectra, or if they are comprised of identical polymers, the software can facilitate separation.
Figure 9 demonstrates how FPA imaging correctly and automatically decomposes a complex agglomerate into individual particles. All other methods would not be able to perform this separation.

Figure 9. RGB image based on the FPA IR data acquired by LUMOS II. Particles are clearly separated. Image Credit: Bruker Optics

Figure 10. Visual image of a particle of 4x5 μm in size. Image Credit: Bruker Optics
Although numerous studies do not account for particles <300 µm, these are by far the most abundant. The highest number is typically found in the range of 100 µm and below.8,9
Capturing the complete scope of microplastic contamination thus requires an analytical technique that can detect and identify particles reliably, down to single-digit micrometer size.
FT-IR imaging with a focal plane-array detector (FPA) facilitates the collection of chemical images with a high spatial resolution near the diffraction limit (5 µm/pixel).
It does this at rapid speeds of up to 900 spectra / second, making it possible to detect the smallest of particles in the shortest amount of time. Only an FPA can offer this much information at such speeds.
Limits of Detection and Automation
The detection limit refers to the smallest possible particle that can be detected by an instrument. To understand this, the diffraction limit and the role it plays in micro FT-IR imaging must be known.
The diffraction limit is a wavelength-dependent, physical phenomenon that refers to the smallest structure that can still be resolved fully by an instrument or particular technique.
Under optimum conditions, this is precisely half the wavelength. For FT-IR, it is generally stated as 10 µm. However, to resolve these 10 µm fully, a pixel size of 5 µm or smaller is necessary according to the Nyquist criteria.
Therefore, a focal-plane imaging detector operates at the edge of what is physically possible in microplastic particle analysis. But there is a lot more to take into account when analyzing the best possible analytical approach, specifically automation.
Though the diffraction limit of FT-IR is about 10 µm, FPA imaging is able to detect particles smaller than 5 µm routinely (Fig. 11) and offers an outstanding IR spectra quality that is perfect for identification purposes (Fig. 12).

Figure 11. FPA detector image of the same particle (green, mid). Image Credit: Bruker Optics
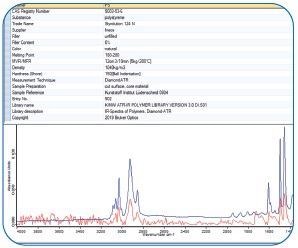
Figure 12. IR spectrum (red, bottom) of that individual pixel identified by a spectral library search. Image Credit: Bruker Optics
However one should not forget automation as a crucial factor in taking microplastics analysis towards standardization. While Raman microscopy might enable the measurement of extremely small (sub-micrometer) particles, it is not possible to automate the analysis.
Automation is also where single-point QCL measurements fail. For small particles (<60 µm), detection is not trustworthy, ushering in an unpredictable, systemic bias in the statistics. As this, however, is the most interesting size fraction in particle analysis, this method is not suitable for automation.10
This makes FT-IR imaging the optimal choice.
Automated Measurement and Evaluation
Understanding the entire scope of the global microplastics problem necessitates automated, reproducible processes for the measurement as well as the analysis. Concurrently, hardware should remain simple, offering routine users absolute control, and must ensure interconnectivity.
By eradicating the pre-selection of particles, FPA imaging enables users of varying skill levels to conduct comparable measurements - with minimal training.
As far as analysis goes, the most frequently applied approach is a comparison of the spectral data with a reference library. Several libraries and matching algorithms can be accessed for this purpose.
Various parameters can be chosen to acquire a meaningful result, and automation is possible.4 But for standardization, it is absolutely vital that the same measurement conditions and parameters are applied every time to ensure comparability between different laboratories.
This can be achieved by either simply agreeing on a common reference database-defined search parameters or by using a standardized machine learning model that was trained on a complete and detailed set of reference spectra.
To sum up, automation is crucial when attempting to achieve standardization. With it, users of various skill levels can operate instruments, collecting and analyzing FPA IR data in short time periods, thus eliminating personal bias as a source for errors.6, 7
Real-World Scenario: Sediment Sample
In the perfect scenario, measurement data will readily match the reference spectra. However, in real-world scenarios, users are often faced with major challenges:
- Samples are also comprised of other naturally occurring substances, including plant material, sand and remains of living organisms that have IR signatures.
- The smallest particles are also the most abundant, making it extremely difficult to detect and identify them accurately.
Contamination, as stated in item 1), can be limited by increasingly intricate sample pre-treatment, but it is not possible to completely remove it, particularly when analyzing environmental or food samples.
Again, approaches such as single-point Raman or FT-IR measurement based on visual detection are not practical for real environmental samples.
Figure 13 displays a Ø25 mm Anodisc filter with a filter area of ~300 mm2. It was completely measured with FPA FT-IR imaging at 5 µm pixel size and 8 cm-1 spectral resolution, which took ~3.5 hours at 750 IR spectra per second.

Figure 13. Example of a real environmental sample that was measured with FPA imaging. An ABS particle was identified based on the IR chemical image. For emphasis, the chemical image of the particle was superimposed on the visual image (green). Image Credit: Bruker Optics
Other techniques besides FPA imaging, which cover the complete spectral range, would necessitate a period spanning several days (~60 hours) while delivering sub-par spatial resolution.
The IR data was evaluated with the Microplastics Finder (by Purency) and generated a detailed particle list and a statistical report (Figures 14 and 15).
While particles are partly wedged between plant material and a sand layer, the identification is effective and offers accurate pixel size information.11

Figure 14. List of all identified particles with their size information. Image Credit: Bruker Optics

Figure 15. Statistical size distribution overview of particles found on the filter. Image Credit: Bruker Optics

Figure 16. LUMOS II FT-IR microscope on the left and FPA imaging version on the right. It allows analysis in transmission, reflection and ATR. Image Credit: Bruker Optics
Conclusion: FPA FT-IR Imaging is King
The critical analysis of single-point Raman, FT-IR and QCL approaches clearly indicates that these methods are limited in application to rare cases where samples remain clean while particle size is not too small and particle load is sufficiently low, potentially requiring aliquotation in some cases.
Automation can be achieved to some degree but is severely limited in regard to spectral quality (Raman) or particle size (QCL).
The detection limit offered for single point FT-IR is typically around 10 µm, and 60 µm for single point QCL - if measurements are automated. Measurement times can be intensive as the number of particles increases and can even reach 7-8 hours per sample.
In the case of QCL transflection, identification lacks reliability due to comparison with spectra of a different technique. These methods will completely fail when particles are overlapping or adjacent or when there is residue from the sample matrix (like river sediment) present.
While Raman has the capacity to measure particles down to 1 µm, automating the process with a suitable level of reliability is not possible.
Numerous physical effects can prevent effective measurements or prevent identification altogether and different particles even necessitate different parameter settings.
Ultimately, FPA FT-IR imaging reigns supreme because particle detection is independent of visual contrast, identification is not influenced by polymer type, fillers or sample matrix, and complete filters are covered at maximum speeds and optimal spatial resolutions.
References
- Journal of Great Lakes Research 2016 42 (5), 921-925.
- Marine Policy 2019 104, 103-107.
- Science of The Total Environment 2019 691 (15), 848-857.
- Applied Spectroscopy 2020 74 (9), 1012-1047 & 1127-1138.
- Environ. Sci. Technol. Lett. 2019 6 (10), 606–611.
- Anal. Methods 2019 11, 2277-2285.
- Environmental Science & Technology Letters 2022 9 (1), 90-95.
- Environmental Pollution 2020 265 (Part A), 114721.
- Marine Pollution Bulletin 2015 100 (1), 70-81.
- Anal. Bioanal. Chem. 02/2022. Automated analysis of microplastics based on vibrational spectroscopy: Are we measuring the same metrics?
- Marine Environmental Research 2021 168 105313.

This information has been sourced, reviewed and adapted from materials provided by Bruker Optics.
For more information on this source, please visit Bruker Optics.