Numerous approved monoclonal antibody-based biopharmaceutical products for a range of therapies are on the rise and are expected to expand quickly. This includes the recent development of sotrovimab and ronapreve treatment for COVID-19.
Though demonstrating significant recent successes, demand continues to outstrip supply and antibody production has been constrained by both time and cost of development. Monoclonal antibodies and antibody fragments are costly and any system that can offer data to enhance their production is of interest to manufacturers.
Antibody fragments (for example, scFv, Fab, Dab, etc.) are considered an increasingly significant class of protein-based biotherapeutics. As a result of their structure and smaller size, antibody fragments exhibit useful properties (for example, simpler tissue penetration) that accommodate a range of therapeutic and diagnostic applications.
However, one downside is that they are hard to quantify in low concentrations and they need a high degree of specificity to enhance their manufacture and increase yield. Therefore, new and enhanced process analytical technologies (PAT) are of considerable interest.
For more than 10 years, Raman spectroscopy has been determined as a possible measurement method for application in biologics production. At present, it is utilized in the production of a few products but has some considerable weaknesses which have restricted its application in many areas.
The technique is non-destructive and in principle could be utilized to quantify any molecule offering high specificity and sensitivity data, thereby providing purity and concentration information.
But Raman observations of such products are especially difficult at low concentrations (mg/mL), as a result of the weak scattering cross-section of the target samples.
Moreover, several complicated biological substances, for instance, antibody fragments, illustrate very powerful fluorescence responses which normally mask the Raman signature. This hampers the application of Raman spectroscopy as an online PAT tool.
Deep UV resonant Raman spectroscopy (UVRRS) has been utilized by numerous authors as a potential method to track the manufacture of biopharmaceutical products.1, 2, 3
At <250 nm operation, the target Raman and fluorescence response become spectrally separated, thereby revealing the Raman response to be successfully captured. Moreover, as the laser wavelength decreases below 250 nm it approaches the electronic transition of various organic molecules generating a resonant effect that amplifies the Raman signal by several orders of magnitude.4, 5, 6
Present high-performance deep UV instruments operating below 250 nm utilize gas pumped lasers,4, 5 which should be water-cooled and dry nitrogen purged, thereby making them hard to deploy in a manufacturing facility.
It should be noted that lasers are commercially available operating at 257 and 261 nm which have been utilized for Raman observations. Yet, these wavelengths are too long to offer the needed resonant signal from anti-body samples and similar products. An alternative method is to utilize a CuNe laser as deployed on the Mars perseverance mission.7
These lasers do not need cooling and are comparatively compact. But these lasers are pseudo pulsed with a net power of <1 mW, restricting their application to strongly scattering or highly concentrated samples.
Normally, these instruments are coupled to a cooled CCD and a high-performance dispersive spectrometer. The spectrometer will typically utilize a 25 μm (or less) slit to guarantee the spectra is well-resolved.
To guarantee the utmost light collection in this arrangement, the laser spot at the target needs to be retained below this slit width, thereby leading to the target sample being exposed to very high power densities, which collectively with the high photon energy can damage the sample.8, 9
Moreover, the resolution requirements to obtain good quality Raman spectra at laser wavelengths measuring below 250 nm result in a spectrometer that is sensitive to environmental conditions. This frequently needs regular realignment.
Such difficulties have, until now, limited the adoption of deep UV Raman instruments to academic laboratories and very particular research applications like Mars exploration missions.
Also, to date, the ancillary requirements and high running costs have severely restricted the deployment of UVRRS systems as online PAT tools, where biologics manufacturing can be facilitated and improved.
For these problems to be addressed, the authors have come up with a new compact deep UV Raman instrument with the help of a diode-pumped laser and a spatial heterodyne spectrometer (SHS)10 integrated with an all-reflective Raman collection probe.
The SHS offers a >100-fold etendue benefit compared to dispersive spectrometers that are quite similar to that provided by interferometric methods (for example, Michelson interferometers, Fabry-Perot based system), in a small robust design in the absence of complicated bespoke optics.
The diode-pumped laser enables the instrument to retain a small form factor while providing outstanding stability and performance characteristics. The SHS enables a huge optical throughput leading to a comparably large laser spot at the target, thereby reducing power density induced sample damage.
The instrument has been illustrated to successfully capture the Raman spectra of a range of biochemical samples, such as immunoglobulin G (IgG) at varying concentrations, tryptophan and a range of domain antibody (dAb) samples.
Extraction of dAb samples was done at various stages of a pilot bioreactor manufacturing process and at varying dilutions. This is the first time an observation of this kind has been made by the authors.
Experimental or Instrument Development
A CAD image of the instrument (with enclosure eliminated) is presented in Figure 1. The system includes (a) a diode pumped laser manufactured by TOPTICA Photonics, (b) an SHS, and (c) a reflective Raman collection probe, both produced by IS-Instruments. The primary instrument consists of a form factor of 75 × 45 × 35 cm and interfaces to the spectrometer through fiber optic cable.
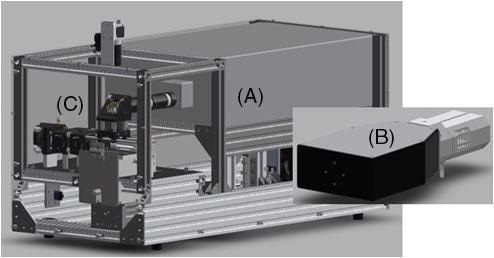
Figure 1. CAD image of full system: (A) TOPTICA laser head, (B) ISI HES spectrometer and (C) backscatter Raman collection probe. Image Credit: IS-Instruments, Ltd.
Laser
A new deep UV laser system (TopWave DUV), functioning at 228.5 nm was designed by TOPTICA Photonics (Figure 1A). This did not need water cooling or internal gas purging, thereby considerably simplifying operation.
This laser source was improved for a compact footprint and depends on diode-pumped solid-state laser (DPSSL) technology. The DPSSL is utilized as a low-noise pump laser, offering output power of nearly 200 mW at the fundamental wavelength of 457 nm.
This is frequency converted into the deep UV with the help of the process of second-harmonic generation (SHG). The output power of >10 mW in the UV has been obtained by integrating the SHG process with an improved enhancement cavity. This enables conversion efficiency of over 13% and an utmost UV power of 20 mW.
Sample Interface
The Raman collection probe is an all-reflective device, where the laser has been directed at the sample through a turning mirror which directs the light down at the sample as shown in Figure 2. The position of the sample is denoted with a red arrow.
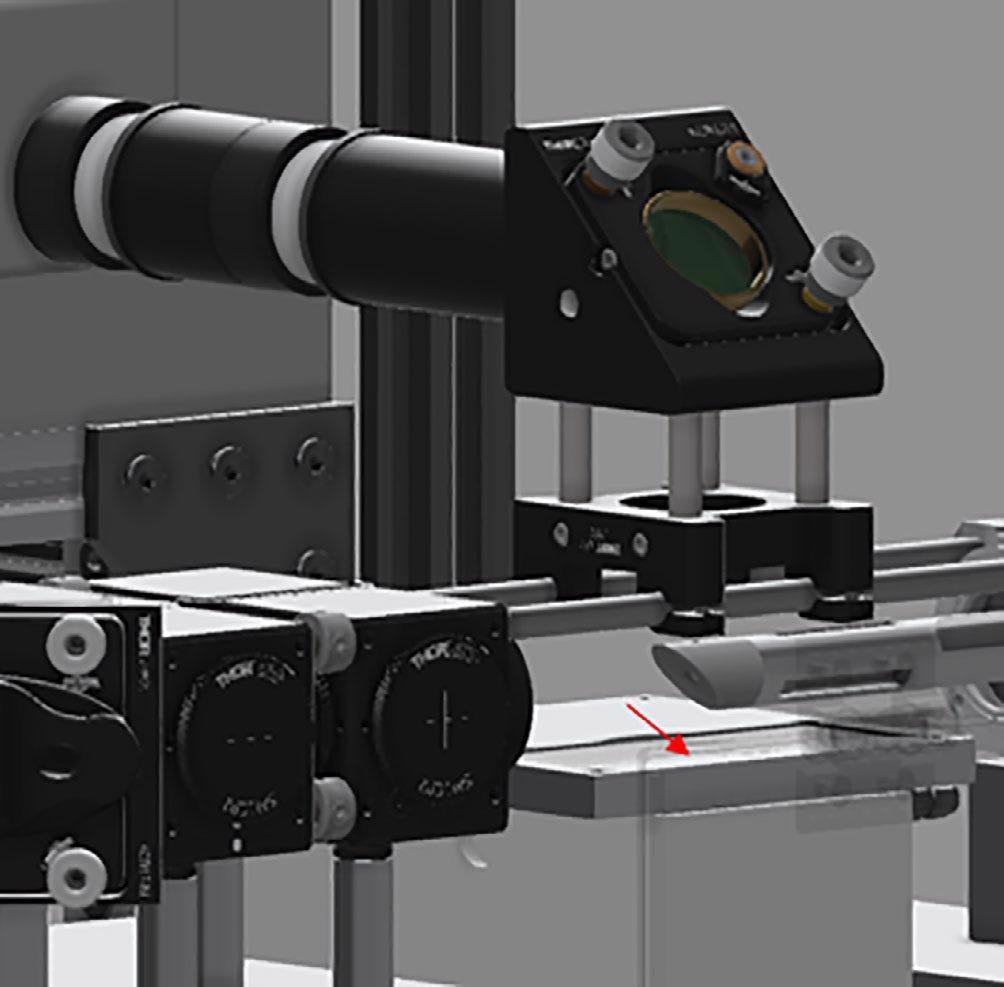
Figure 2. CAD image of the instrument—sample interface. Red arrow indicated sample position. Image Credit: IS-Instruments, Ltd.
The backscattered Raman light is collected through a 12.5 mm focal length f1:1 mirror. The light is then passed through a 229 nm long-pass filter to suppress extraneous laser light prior to focusing into a 0.91 mm diameter collection fiber, through a 25-mm diameter, 50 mm focal length mirror.
Then, the light is fiber coupled into the spectrometer where the spectral data is extracted. The SHS spectrometer design guarantees that no light is lost in spite of the large etendue needs.11
Also, a dynamic positioning stage on which the sample is sited is shown in Figure 2 (below the sample stage). This facilitates a scanning routine throughout the duration of the Raman measurement, guaranteeing that the samples are not damaged by extended laser exposure.
Spectrometer
The spectrometer consists of a spatial heterodyne configuration as displayed in Figure 3. The design renders itself well for operation in the deep UV, where power density, resolution and stability needs are highly stringent.
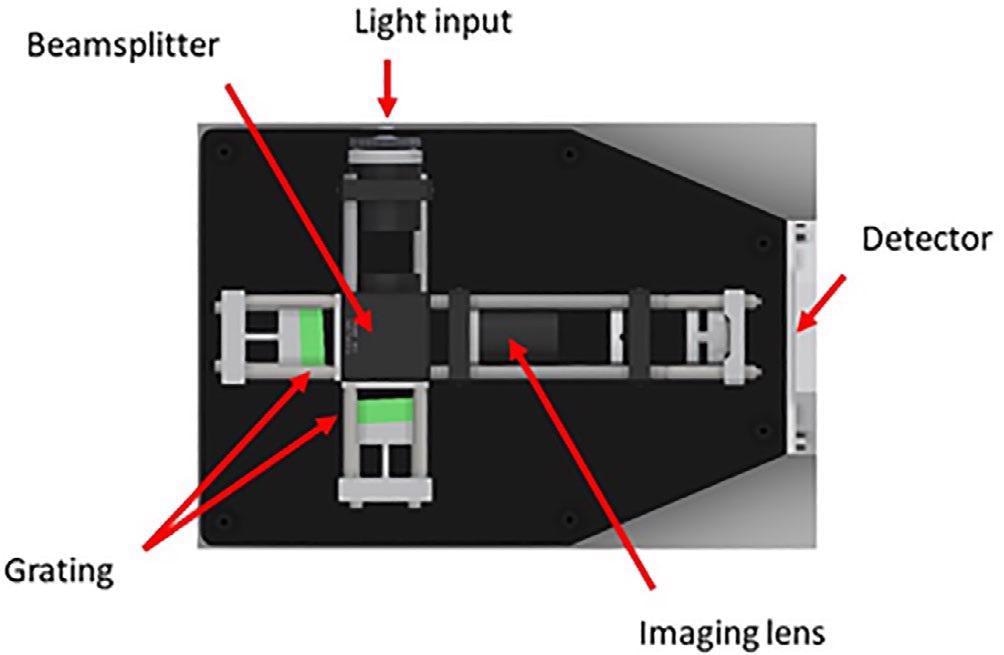
Figure 3. Spatial heterodyne spectrometer design as used by the UVRRS instrument. UVRRS, UV resonant Raman spectroscopy. Image Credit: IS-Instruments, Ltd.
Originally, this design was developed by Harlander et al (1992), to study diffuse stellar objects. Many teams have adapted the design for Raman observations at a range of excitation wavelengths.12, 13, 14
The instrument is considered to be a class of static Fourier transform spectrometer and hence images an interferogram which undergoes a Fourier transform to extract the spectral information.
The design offers various benefits; it provides a considerable etendue benefit over dispersive systems, this enables the spot at the target sample to be increased, thereby decreasing the power density without losing any gathered light.
The interferometer configuration enables high resolution to be obtained with modest grating line densities with no need for increasing the footprint of the instrument. The design is inherently stable in wavelength space, decreasing any need for realignment of the instrument.
The spectrometer was fiber coupled to the Raman probe through a 0.91 mm diameter 0.22 NA optical fiber. The spectrometer needs no slit, eliminating this common source of optical loss.
The instrument makes use of 400 lines/mm gratings, the fringe pattern isimaged via a triplet UV lens (to reduce aberrations) with the help of a cooled Andor iDUS CCD camera.
Lamsal15 illustrated a UV SHS instrument utilizing a split plate beam splitter to restrict any distortion emerging from plate flatness.
But this tends to extend the distance between the gratings and other optical elements, which amplifies any movement in the grating plates as a result of environmental conditions. Hence, a bespoke cubic beam splitter with a flatness of λ/10 at 228.5 nm was fabricated and integrated into the instrument.
The spectrometer was calibrated with the help of cyclohexane which displays a range of well-known discreet peaks ranging from 801 to 1444 cm−1.
Results and Discussion
IgG and Tryptophan
Whilst functioning in the deep UV, target samples tend to experience very high radiant energies. This can lead to damage which subsequently degrades the spectra obtained as the target material is degraded and/or damaged.
The SHS design helps reduce this by enabling a bigger spot at the target (0.3 mm diameter in this case) If one assumes a 70% efficiency for the system in sending light to the target, this leads to a total power density of 89.2 kW/m2 that is being noted at the target.
A high-performance dispersive instrument with similar spectra resolution would need a 10 μm wide slit.
Hence, the spot should be kept beneath this level if no light has to be lost on increasing the power density to >80 MW/m2, considerably increasing the likelihood of damage being observed.
To evaluate this effect, IgG, which is prone to UV degradation, was analyzed. With the help of 30-second integration times, this data was obtained where an average of 10 frames was utilized to produce the presented spectra.
IgG spectra were achieved in three different measurement conditions:
- Static; Such that the same region of the sample was constantly exposed to the laser
- Rotating and linearly translating; A 15 mm “to-and-fro” linear motion to guarantee no region of the sample was exposed to extended laser light
- Rotating; With the sample rotating, tracing a 15 mm circle over the sample surface
The consequent spectra are displayed in Figure 4. In the static configuration, the spectra denote a significant amount of damage that has happened to the sample, with no clear peaks between 700 and 1500 cm−1.
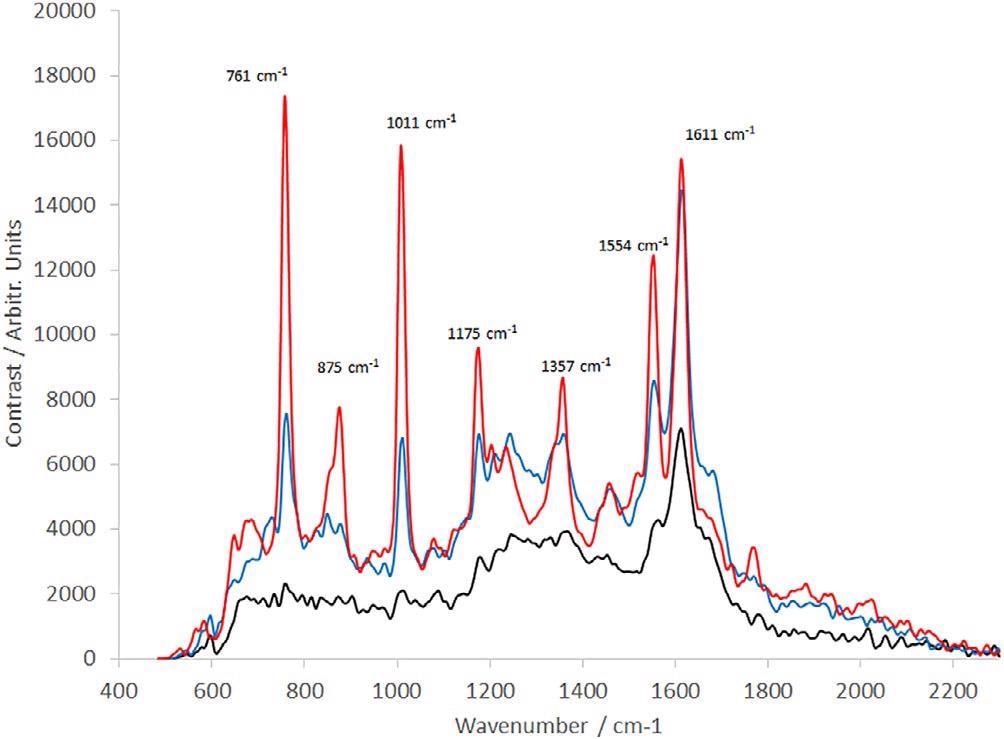
Figure 4. Raman spectra of IgG (30-s integration time, average of 10 frames). Solid black line: IgG is measured in static configuration; dotted black line: IgG measured with sample rotating during the observation; red line: IgG measured with a complex motion applied using a rotation and linear stage. IgG, immunoglobulin G. Image Credit: IS-Instruments, Ltd.
Making use of a rotation stage enhances the quality of the data gathered with peaks becoming more prominent in this region. But they are two to three times weaker compared to the structure noted at 1605 cm−1.
The addition of the linear translation significantly improves the spectral quality without increasing the timeframe of the measurement. This complex motion was adopted for all samples presented.
The spectra achieved under rotating-only circumstances closely reproduce what is being reported in the literature.16 This denotes earlier measurements that might have been impacted by UV-induced sample degradation.
Moreover, a range of IgG dilutions in deionized water was produced. These varied from 0.1 to 2 mg/mL (11 samples in total). A subset of these has been presented in Figure 5. All spectra are the product of 10 averaged frames, each captured in a 30-second integration time.
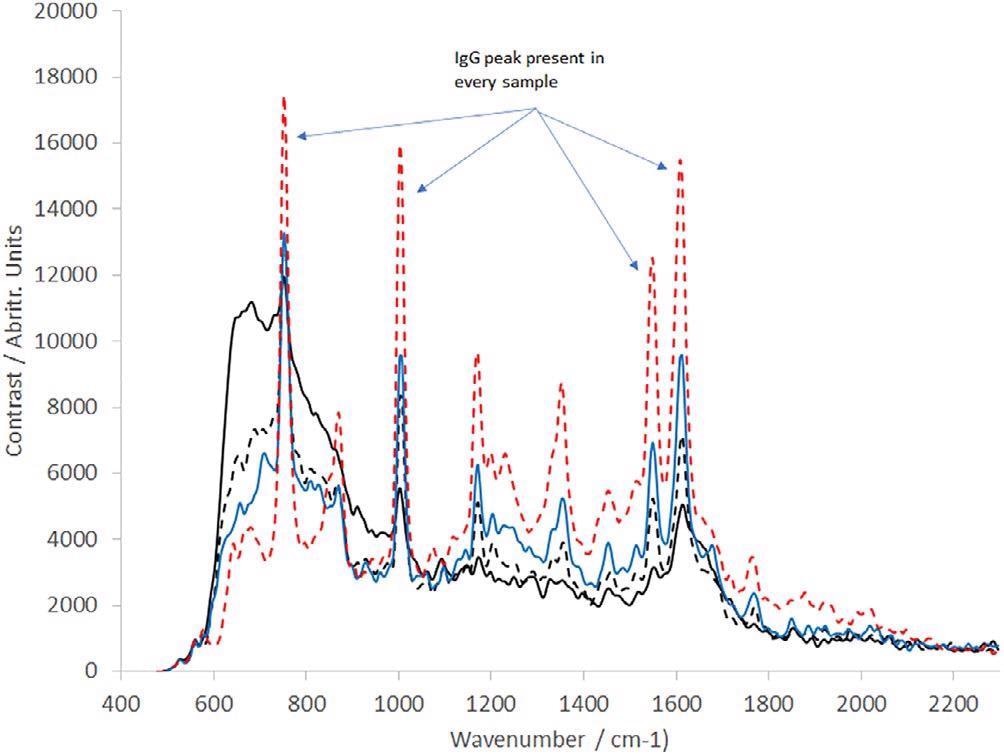
Figure 5. Raman spectra of IgG at a range of concentrations as labelled (all spectra presented are the averaged output of 10 30 s frames); solid black line = 0.1 mg/mL, dotted black line = 0.4 mg/ml, blue line = 0.8117 mg/mL, dotted red line = 2.0173 mg/mL. IgG, immunoglobulin G. Image Credit: IS-Instruments, Ltd.
The spectra demonstrate that as the IgG concentration decreases toward 0.1 mg/mL, the water spectrum becomes more prominent. Extrapolation denotes a detection limit of IgG in the water of 0.08 mg/mL.
To identify the ability of the instrument for quantitative analysis, the spectra were additionally examined with the help of a principal component regression model. This utilized a single 30-second frame of each sample spectra, where the data was divided into a training and a data set, using the K-folds cross-validation method.17
A principal component analysis was also carried out. The consequent output provided the calculated IgG concentration values. This was plotted against the real concentrations as displayed in Figure 6.
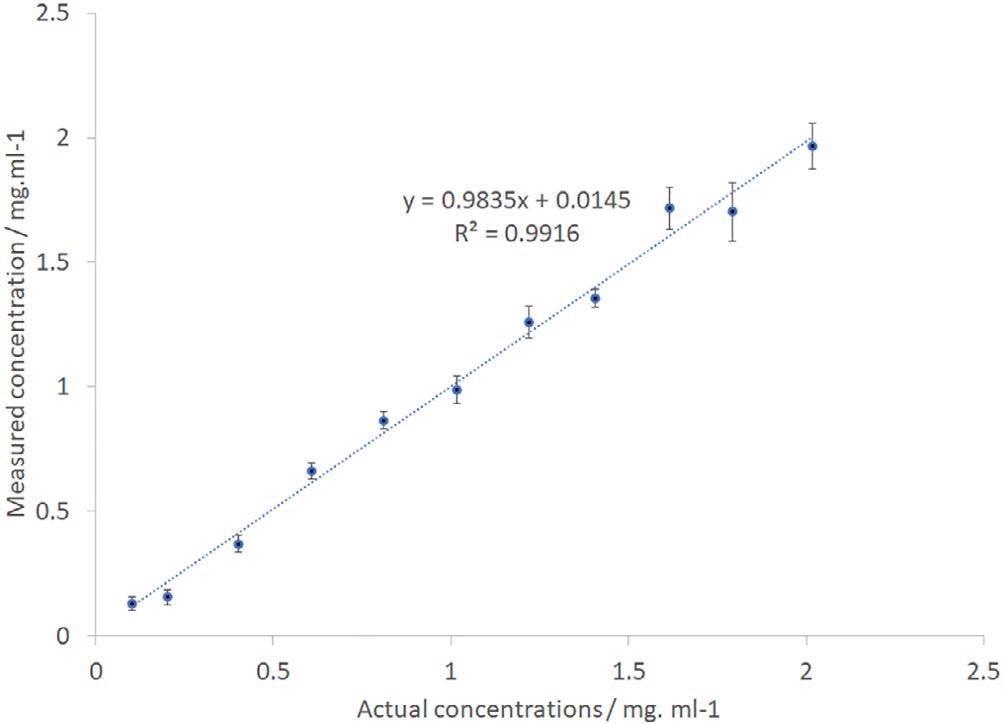
Figure 6. IgG PCR-calculated vs actual sample concentration. IgG, immunoglobulin G. Image Credit: IS-Instruments, Ltd.
The error bars have been computed from the standard deviation of the separate frames with precision levels altering from 0.03 mg/mL for the low concentration sample to 0.1 mg/mL for the higher concentration samples. The data displays an outstanding linear relationship with a regression coefficient of 0.99.
Tryptophan, an amino acid, was analyzed to further evaluate instrument utility. The Raman spectrum of this sample was obtained by averaging 10 frames, each captured in a 30-sceond integration time, and is displayed in Figure 7.
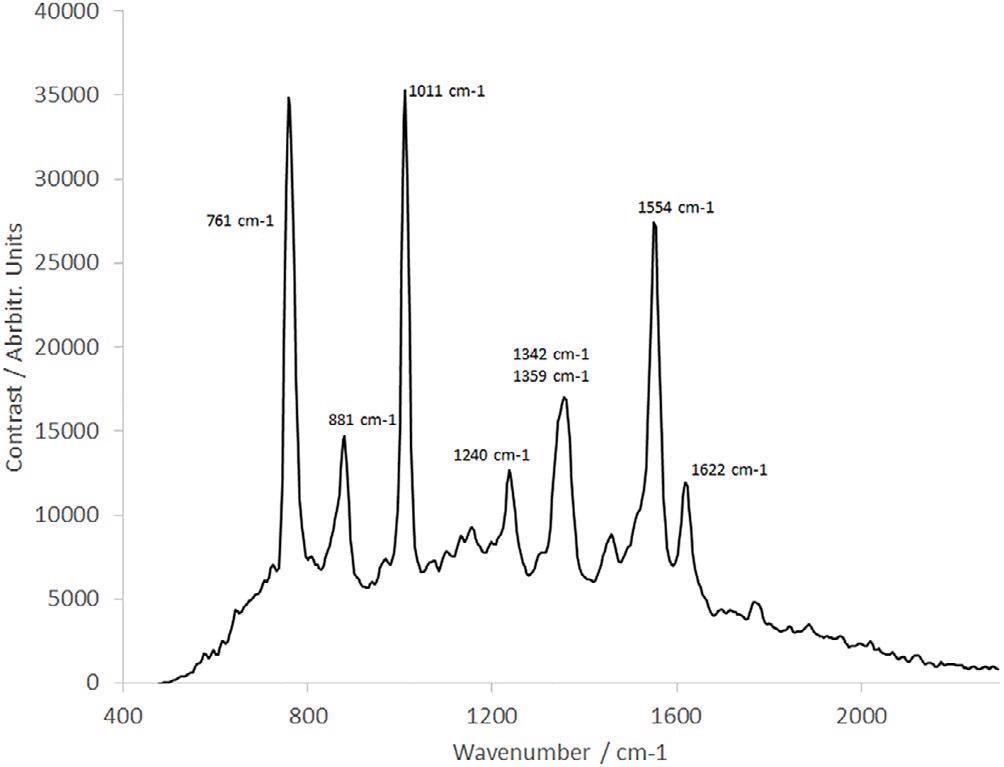
Figure 7. Raman spectrum of tryptophan. Image Credit: IS-Instruments, Ltd.
The sample concentration is 1.038 mg/mL and the sample was rotated and linearly translated to prevent sample degradation, as detailed earlier.
The interferogram generated by the SHS undergoes minimal processing before the FFT algorithm. This included flat field correction to eliminate instrument aberrations, and a spline fit to remove the fiber intensity profile. No spectral smoothing has been employed.
Kumamoto et al.8 earlier presented a well-resolved tryptophan Raman spectrum with the help of a 2 cm−1 resolution monochromator at 244 nm with the help of a gas pumped laser.
The spectrum shown in Figure 7 compared favourably, with all peaks resolved, such as the double peak at 1342 cm−1/1359 cm−1. However, in contrast, this spectrum was obtained in a fraction of the timeframe as a result of the sophisticated SHS technology substituting the scanning monochromator explained by Kumamoto et al.8
dAb Raman Acquisition
A range of dAb samples with different purity and concentration supplied by Cytiva Life Sciences within the Testa Challenge program18 were also analyzed. The pilot-scale bioprocess facility at Testa Center, Uppsala, is a technology demonstrator developed to help market innovation and encourage Cytiva’s products, for instance, filters, resins, bioreactors, etc.
The process run at the time of the Testa Challenge was planned to generate and purify a dAb fragment, that is, the inconstant region of an antibody’s kappa-light chain. Antibody fragments that have been utilized in therapeutic or diagnostic applications would be produced in the same way, but with greater stringency routines (GMP or GLP standard) and have the end-product purified to an even higher degree.
Five samples gathered from various parts of the purification process were removed and stored at −20 °C for the following analysis with the help of a deep UV Raman instrument. The samples used are displayed in Table 1. Each of these samples was quantified in an identical way to the IgG and tryptophan observations.
Table 1. List of dAb samples. Source: IS-Instruments, Ltd.
| Sample |
Description |
Comment |
| 1 |
End of fermentation |
Sample of supernatant at harvest (heat treated to disrupt periplasm and release dAb) |
Crude sample containing contaminants (host cell proteins and DNA, culture media components etc.) from production process |
| 2 |
Capto L load |
Sample taken after clarification step (TFF using hollow fibre) before chromatography capture step (protein L resin) |
Cell debris and large sized contaminants removed. Exchange of buffer |
| 3 |
Capto L pool |
Sample from pooled fractions of protein L chromatography capture step |
Protein L is the major purification step (affinity resin) |
| 4 |
Capto MMC impres load |
Sample before polishing step (after pH adjustment of eluate from affinity capture chromatography step) |
Before loading onto Capto MMC ImpRes the sample was pH adjusted with NaOH. So, the concentration of the start sample for Capto MMC ImpRes was lower than the protein L elution pool |
| 5 |
Capto MMC impres pool |
Sample after multimodal chromatography (polishing) step |
Polishing step with further removal of endotoxins and host cell proteins |
Abbreviation: dAb, domain antibody.
The consequent spectra are displayed in Figure 8. Clear variations are noted between the early-stage process samples; samples labeled “end of fermentation” and “Protein L load” and the following purification steps.
Furthermore, delicate variations are visible between the remaining samples concerning relative peak heights throughout the spectrum. This is probably a result of the different dAb concentrations within every sample.
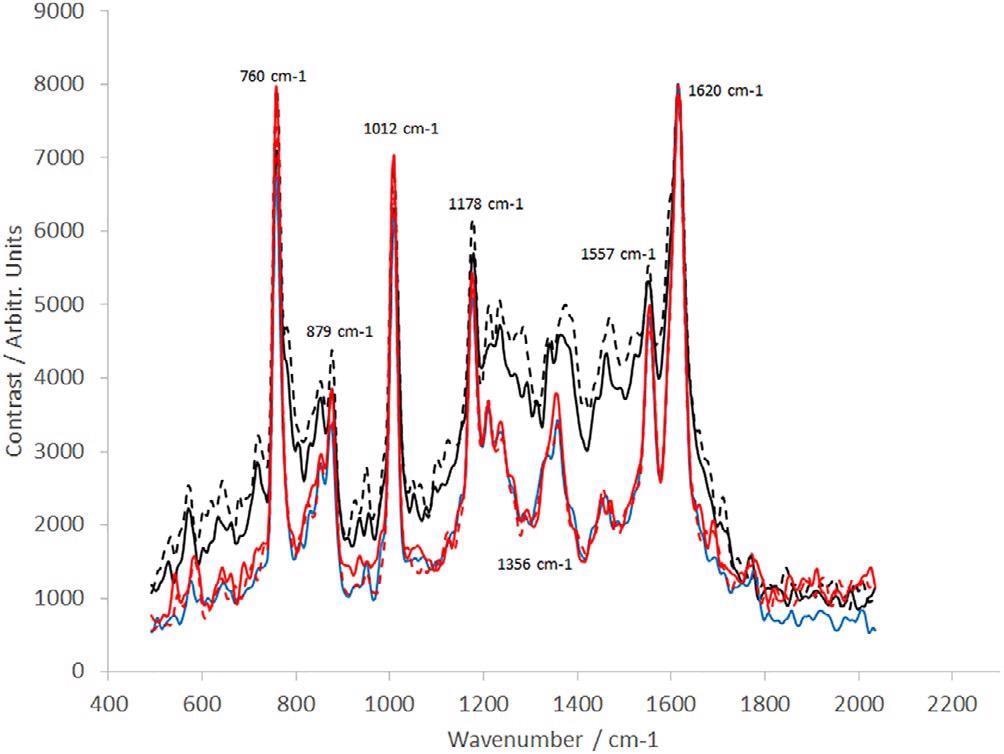
Figure 8. Raman spectra of dAb (sample provided by the TESTA Center, Cytiva Life Sciences) taken from five different stages of the manufacturing process (Table 1): dotted black line (sample position 1), solid black line (sample position 2), blue line (sample position 3), dotted red line (sample position 4), and solid red line (sample position 5). dAb, domain antibody. Image Credit: IS-Instruments, Ltd.
Moreover, a sensitivity assessment was performed. One dAb sample was diluted into five concentrations as displayed in Table 2. The Raman spectra are presented in Figure 9.
Table 2. dAb dilutions. Source: IS-Instruments, Ltd.
| Dilution |
dAb conc. (mg/mL) |
Sample volume (µL) |
Buffer volume (µL) |
| 100X |
~0.1 |
20 |
1980 |
| 20X |
~0.5 |
50 |
950 |
| 10X |
~1 |
100 |
900 |
| 2X |
~5 |
500 |
500 |
| 1X |
~10 |
1000 |
0 |
Abbreviation: dAb, domain antibody.
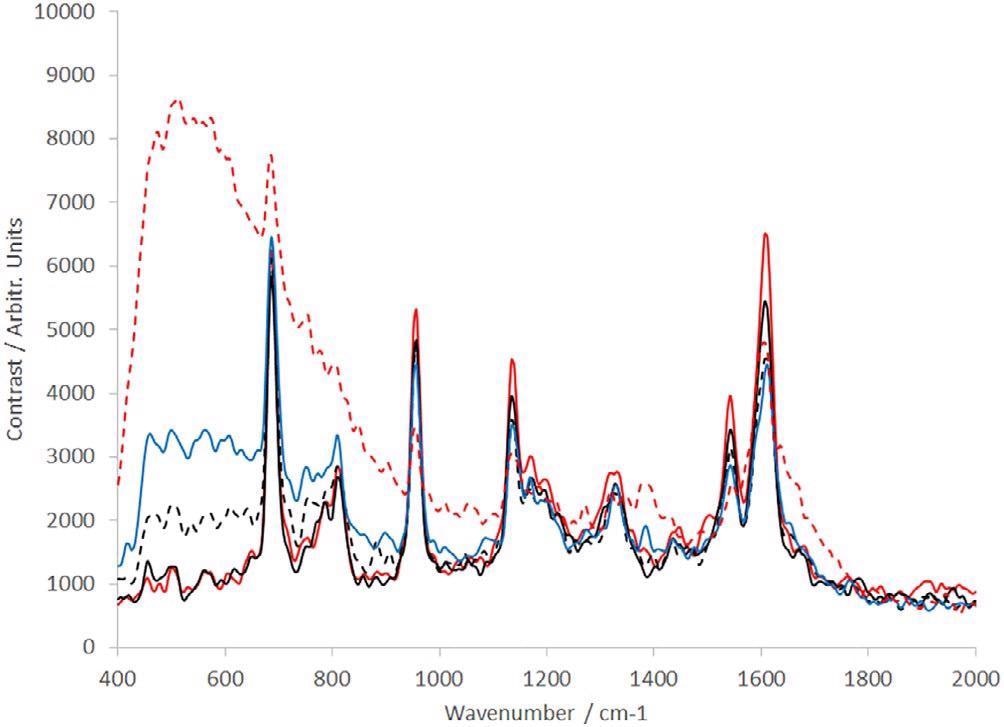
Figure 9. Raman spectra of dAb (sample provided by the TESTA Center, Cytiva Life Sciences) of different concentration levels: dotted red line = 0.1 mg/mL, solid blue line = 0.5 mg/mL, dotted black line = 1 mg/mL, solid black line = 5 mg/mL, and solid red line = 10 mg/mL. dAb, domain antibody. Image Credit: IS-Instruments, Ltd.
Each spectrum presented is the average of 10 frames, where every frame was captured in a 30-second integration time. In the low concentration samples, the solvent (PBS — predominantly water) can be noted, both at 1628 cm−1 and below 1000 cm−1 where the spectrum increases constantly to the edge of the spectral range of the instrument.
With the increase in concentration, not only does the water feature eliminate but the special dAb peaks becomes a lot more prominent.
The PCA analysis devised for the IgG data was repeated for the dAB data. A plot showing estimated versus real concentration is displayed in Figure 10. Outstanding linearity is noted again with a regression coefficient of 0.989.
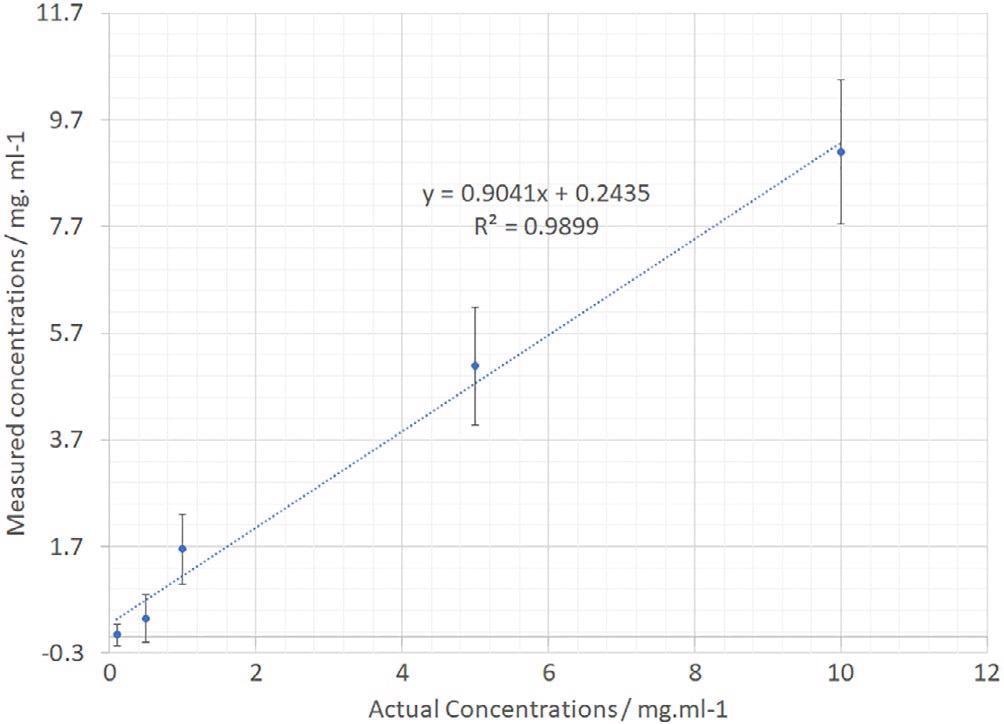
Figure 10. dAb PCR-calculated vs actual sample concentration. dAb, domain antibody; PCR, polymerase chain reaction. Image Credit: IS-Instruments, Ltd.
The error bars on the separate samples are bigger as a result of the restricted number of sample points throughout the concentration range.
It is forecasted that in a manufacturing facility deployment scenario, an increased number of samples could be utilized to build a calibration model and thus enhance measurement confidence. Moreover, the analysis could be improved by using the complete 300-second dataset instead of using a single 30-second frame.
Conclusion
A new, small and dependable deep UV resonant Raman instrument has been presented. The system integrates a newly developed solid-state diode-pumped laser and an SHS, both have been combined into a single instrument with a special all-reflective backscatter Raman collection probe.
Sample damage resulting in extended laser exposure has been reduced through the mplementation of a dynamic sample positioning stage. Numerous biological materials have been studied with the help of the UVRRS instrument: tryptophan, immunoglobulin and dAb.
Each sample has provided a unique and prominent Raman spectrum. Samples of altering concentration have also been analyzed, where outstanding linearity characteristics illustrated the utility of the instrument for quantitative analysis.
A detection threshold < 0.1 mg/mL for IgG was discovered.
A series of dAb samples manufactured by the Testa Center - a bioprocess pilot-scale technology showcase and innovation facility - run by Cytiva Life Sciences have been characterized successfully.
The researchers demonstrated the ability of the technology to track a biotechnology production process, while concurrently identifying sample concentration. This stresses the potential of the instrument to improve production yield and decrease wastage.
Acknowledgment
The authors thank Innovate UK, Eurostars/Eureka, and Testa Center for the funding and support on the current project.
References
- Ashton, L & Goodarce, R. European Pharmaceutical Review, 2011, 16, 46.
- Wen Z.-Q., et al. Journal of Pharmaceutical Sciences, 97, 2229
- Masca, S. I., et al. Review of Scientific Instruments, 77, 055105
- Smith, E G. Dent, Modern Raman Spectroscopy: A Practical Approach, John Wiley and Sons, Hoboken, NJ 2005
- Nocentini. S., L. Chinsky, Journal of Raman Spectroscopy, 1983, 14(1), 9
- Yazdi, Y. N. Ramanujam, R. Lotan, M. F. Mitchell, W. Hittelman, R. Richards-Kortum, Applied Spectroscopy. 1999, 53(1), 82
- R. Bhartia, et al. Space Science Reviews, 2021, 217, 58.
- Y. Kumamoto, A. Taguchi, N. Isaac Smith, S. Kawata, Biomedical Optics Express 2011, 2, 927
- M. Harz, M. Krause, T. Bartels, K. Cramer, P. Rösch, J. Popp, Analytical Chemistry, 2008, 80(4), 1080.
- J. Harlander, R. J. Reynolds, F. L. Roesler, Astrophys. J. 1992, 396, 730.
- M. Foster, M. Wharton, W. Brooks, M. Goundry, C. Warren, J. Storey, Journal of Raman Spectroscopy, 2020, 51, 2543.
- J. E. Lawler, Z. E. Labby, J. M. Harlander, F. L. Roesler, Applied Optics. 2008, 47, 6371.
- O. R. Dawson, W. M. Harris, Applied Optics. 2009, 48, 4227.
- M. J. Foster, J. Storey, M. A. Zentile, Optics Express 2017, 25, 1598.
- N. Lamsal, MSc Thesis, University of South Carolina 2016.
- T. Plakhotnik, J. Reichardt, Journal of Quantitative Spectroscopy and Radiative Transfer 2017, 194, 58
- I. T. Jolliffe, Principal Component Analysis. Springer Series in Statistics, Springer, New York, NY 1986, p. 129. doi.org/10.1007/978-1-4757-1904-8_8.
- https://testa-challenge.confetti.events/

This information has been sourced, reviewed and adapted from materials provided by IS-Instruments, Ltd.
For more information on this source, please visit IS-Instruments, Ltd.