Powder coating is now preferred over liquid coating and has also been extensively employed in numerous industries due to its negligible VOC (volatile organic compound) emission, high solid content, and low energy consumption.
Image Credit: Bettersize Instruments
There are various factors that impact the performance of powder coatings, like the molecular weight distribution of the resin particles, surface modifications of various kinds of fillers, and the purity and chemical properties of the ingredients.
Excluding such factors, the particle size and shape of the powder are also some of the main parameters that contribute to the determination of powder coating’s final mechanical properties. In particular, the flowability, gloss, utilization rate, and adhesion properties of powder coating will be altered by changing the size and shape of the powder.
Hence, it is vital to regulate the size and shape of the particle in optimal ranges across the entire production process to improve the final mechanical performance of the powder coating.
This article concentrates on the main production processes of powder coating and explores how such processes tend to impact the size and shape of powder particles and ultimately the final performance of the product.
The Melting and Mixing of Fillers and Resin
As the first step of the powder coating production process, the melting and mixing of fillers and resin are considered to be the basis of the mechanical properties of the coating.
In this step, one of the biggest challenges involves making a uniformly dispersed mixture of resin and fillers. This hugely relies on the particle size distribution. To examine the relationship between the particle size and the mixing quality, two kinds of titanium dioxide used as fillers are characterized.
As noted in Figure 1, Titanium Dioxide B’s particle size was considerably smaller than that of Titanium Dioxide A, and thus must be, theoretically, more evenly mixed than Titanium Dioxide A. But in practice, it was harder to evenly mix B than A.
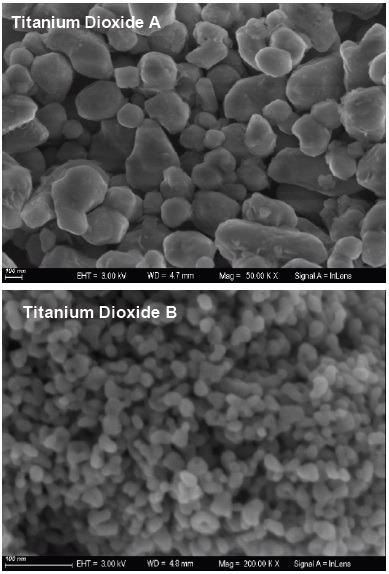
Figure 1. SEM (Scanning Electron Microscopy) images of Titanium Dioxide A (x 50K) and Titanium Dioxide B (×200K). Image Credit: Bettersize Instruments
The Bettersizer 2600 laser particle size analyzer (Bettersize Instruments) was used to quantify the particle size distributions of Titanium Dioxide A and B powders in an attempt to resolve the reason for this discrepancy.
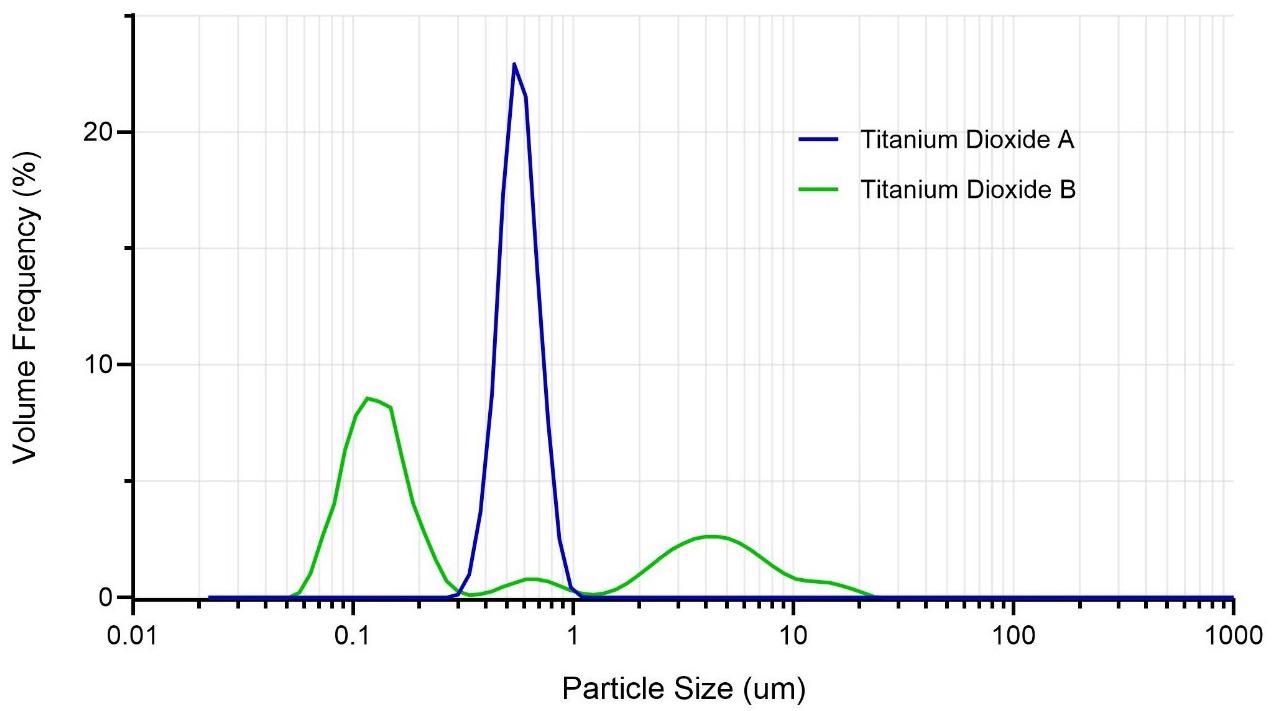
Figure 2. Particle size distributions of Titanium Dioxide A and Titanium Dioxide B. Image Credit: Bettersize Instruments
The particle size distribution of Titanium Dioxide B indicated that there were huge micro-sized particles present in the sample, and the sample size was distributed extensively. Furthermore, by examining the samples under lower magnification SEM (Figure 3), it was discovered that small particles in Titanium Dioxide B developed greater aggregates.
This was done by increasing the surface area and intermolecular interactions between the particles. Hence, in this case, fillers with smaller particle sizes exhibited bigger aggregates and thus were difficult to be mixed.
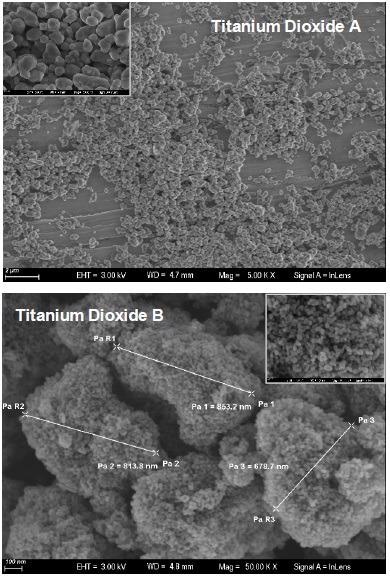
Figure 3. SEM images of Titanium Dioxide A (×5K) and Titanium Dioxide B (×50K). Image Credit: Bettersize Instruments
Following the sizing of two kinds of titanium dioxide powders with the Bettersizer 2600, two conclusions were made. If the fillers are oversized, the large particles will develop agglomerates in the paint at the time of extrusion and decrease the mechanical properties of the product.
At the same time, the interface energy tends to increase as particle size decreases, leading to bigger aggregates that are harder to evenly mix, which also affects the product’s mechanical properties.
Grinding and Classifying Powder Coatings
Followed by the melting and mixing of fillers and resin, the subsequent production process is the classification of powder crushing. Powder coating’s size has been greatly impacted by set parameters at the time of the crushing process, for instance, various types and speeds of the mills, airflow conditions, speeds of feeding, and duration of crushing.
All these parameters have to be taken into account such that the optimum particle size of the powder can be regulated, and a narrow particle size distribution could be obtained. The figures below display the variation in mass fractions of samples while different production processes (A and B) are employed at the time of the powder crushing:
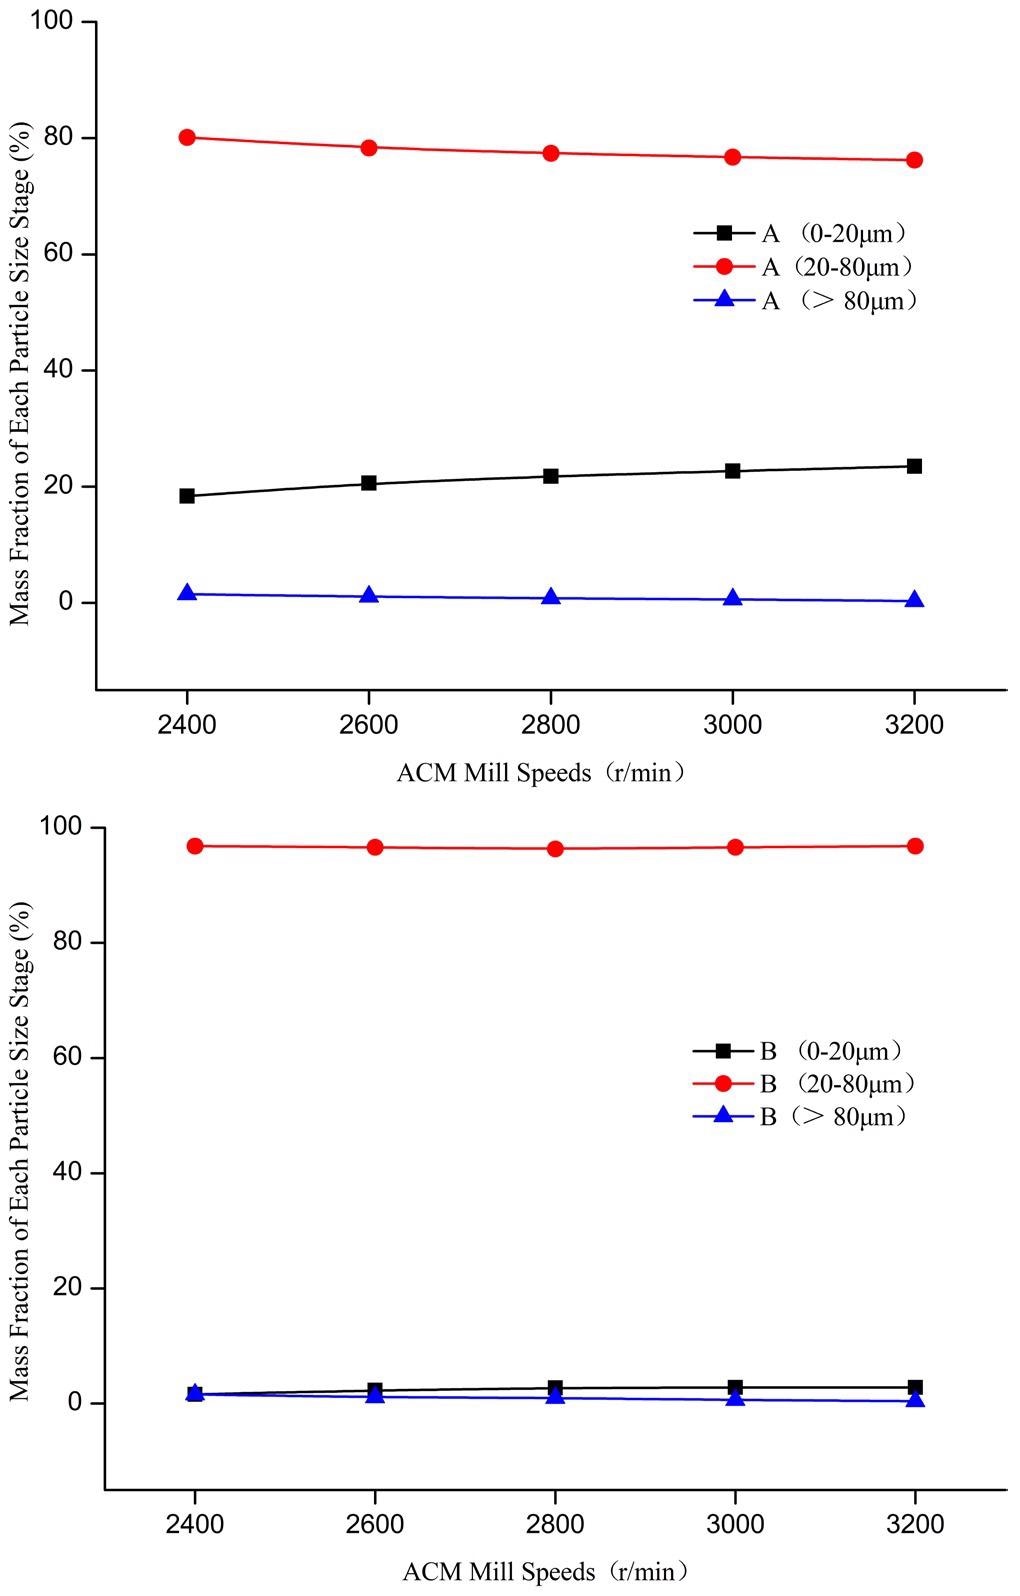
Figure 4. Size of coating samples manufactured by Process A and B. Image Credit: Bettersize Instruments
In Process B, there is an extra secondary classification while there is not in Process A. As the figure denotes, the secondary classification efficiently reduces the percentage of coarse particles (>80 μm) as well as small particles (<20 μm).
To put it another way, the particle size distribution has been much narrower compared to that without the secondary classification system.
At the same time, inside the same process (A or 8), when the mill speed increases, the percentage of particles above 80 μm decreases while that of particles greater than 20 μm tends to increase.
It must be noted that the energy consumption needed for the operation of mills with higher speed also increases, thereby causing unwanted overheating.
Performance of Final Product of Powder Coating
The particle size impacts the efficiency and the mechanical properties of powder coating. At the time of the powder spraying process, smaller particles will shift in the airflow path, and ultimately fall and stay at the higher position of the workpiece; bigger particles will fall at the bottom of the workpiece, leading to lower outflow quality.
But undersized particles reduce the spraying efficiency as a result of the decrease in feeding speeds. Also, undersized particles expedite the absorption of moisture which additionally results in the aggregations of greater particles which block the spraying gun up.
Therefore, by tracking and quantifying the particle size distribution of powder coating, its mechanical properties and performance can be ensured and improved.
Particle Sizing of Powder Coating Particles
As stated above, particle size is a very significant property for powder coatings. There are several particle sizing technologies available, from conventional sieving and microscopy to extensively utilized laser diffraction. Every technology has its benefits and drawbacks.
For instance, the principle of the sieving technique is easy and the cost is low. However, the operation is laborious and the test repeatability is not ideal. Microscopic imaging has the potential to envision every particle, and the size and morphological parameters can be given. However, the sampling might not be representative.
The laser diffraction technology consists of quick measurement speed, good statistics, and representativeness. However, the laser analyzer is comparatively costly. The primary measurement techniques are discussed below.
Laser Diffraction Method
Generally, the laser diffraction method consists of two dispersion techniques, namely dry test, and wet test. The dry test primarily utilizes air as a dispersion medium, transfers particles via compressed air, and disperses powder particles via shearing, particle-particle collision, and particle wall collision.
The dry test is beneficial in that its operation is quick, it is user-friendly, and only a few factors impact the test outcomes. Hence, it is widely used in particle size measurements of powder coating.
In the dry test measurements, the compressed air pressure is very important. If the air pressure is too low, the sample dispersion could be unstable and lead to poor repeatability outcomes.
However, if the dispersion pressure is too high, a few secondary particles (agglomerates) could break down into undesired small particles.
Accordingly, for dry tests, it is essential to execute a pressure titration in advance, that is, to track the change and stability of the particle size distributions of powder coatings under different pressures, such that a suitable dispersion pressure could be identified.
For agglomerated or fragile samples, the pressure titration of the dry measurement is particularly significant. An instance of a pressure titration curve is displayed in Figure 5.
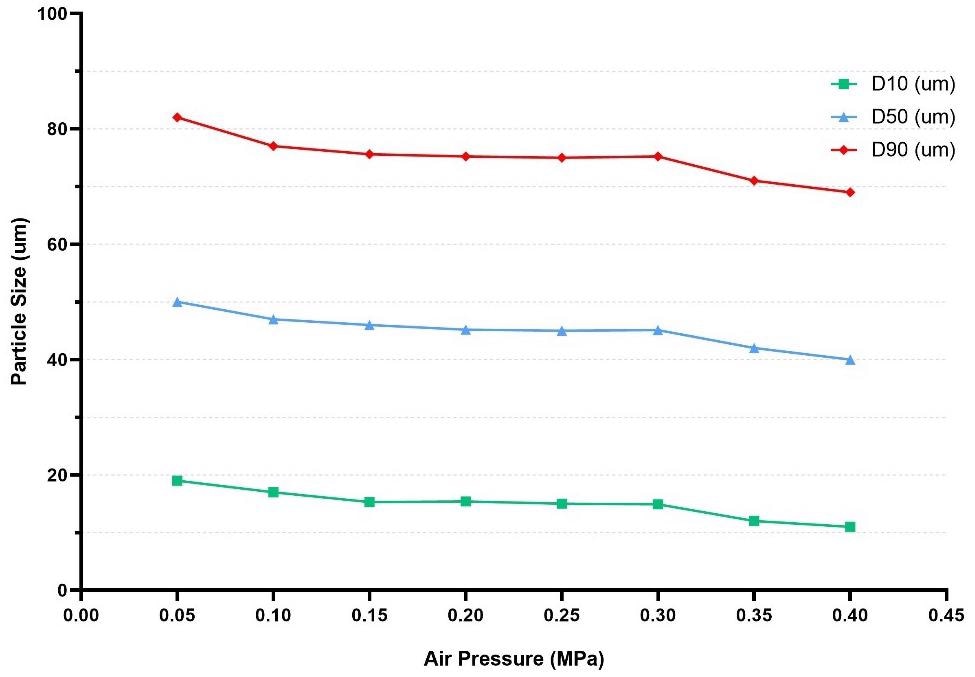
Figure 5. Example of a pressure titration curve by dry test. Image Credit: Bettersize Instruments
When the pressure is below 0.15 MPa, the sample dispersion is unsteady and thus the repeatability of test outcomes is poor under this pressure. Simply put, if the air pressure is too low, it is hard to disperse a few particles elaborately.
But when the pressure is higher than 0.3 MPa, the particle size will slowly reduce as the pressure increases. This is because some aggregated particles, the fractions that are considered for a powder coating.
This might be split into separate particles under high pressure. Hence, 0.25 MPa is a suitable dispersion pressure for quantifying this sample.
It must be observed that for most powder coating samples, the particle size measurement results are not readily impacted by the dispersion pressure (0.1 to 0.4 MPa) as a result of their less agglomeration, non-fragility, and good flowability.
The measurement risk resulting from inappropriate pressure seems to be low and hence the dry test is generally known to be the best and easiest choice for powder coatings. Figure 6 displays the particle size distributions of various polyurethane coatings provided by dry tests.
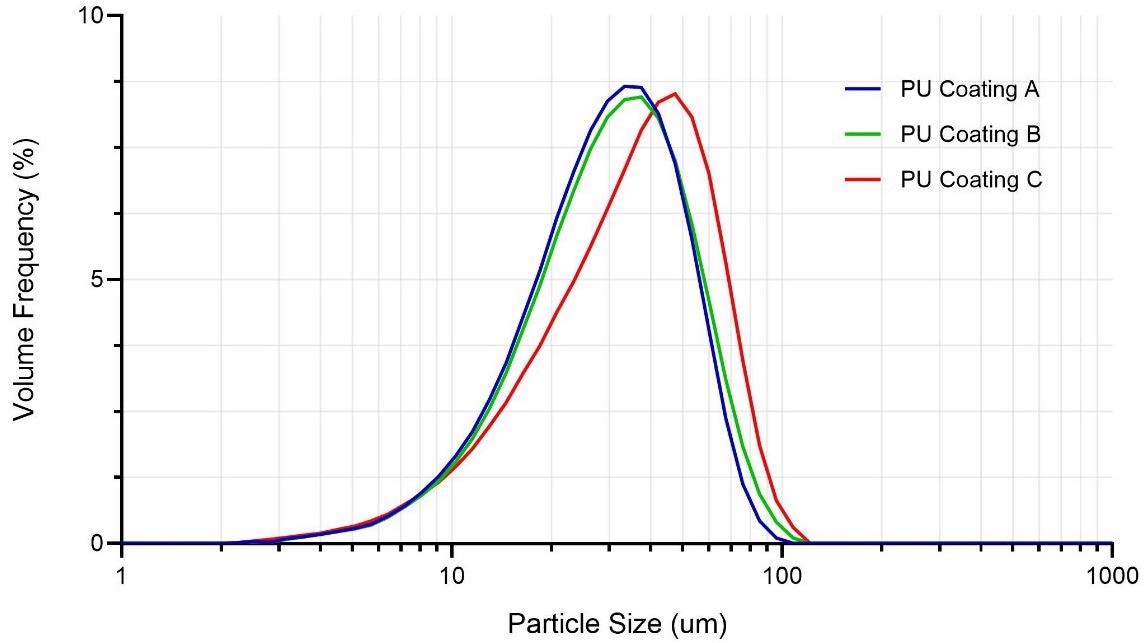
Figure 6. Particle size distributions of polyurethane (PU) coatings from different manufacturers measured by dry tests. Image Credit: Bettersize Instruments
It can be noted from Table 1 that the D10 of the three coating samples are very close to each other, implying that their fine-end particles are similar in size, but the coarse-end particles (D90) have an entirely different particle size distribution.
Table 1. Critical particle size values of PU coatings from different manufacturers measured by dry tests. Source: Bettersize Instruments
| Sample |
D10 (μm ) |
D50 (μm ) |
D90 (μm ) |
| PU Coating A |
12.34 |
28.19 |
50.87 |
| PU Coating B |
12.67 |
29.28 |
54.59 |
| PU Coating C |
12.72 |
34.13 |
62.24 |
Also, this proves that the dry dispersion technique is effective in quantifying powder coating samples.
Besides a high resolution for huge particles, the dry measurement could efficiently track the particle size distribution of coatings at the time of the production process, thereby guaranteeing the stability of product performance, and enhancing product quality.
Even though the dry method has benefits such as quick operation, high efficiency, and outstanding resolution of large particles, it still has its drawbacks.
For instance, as it primarily depends on compressed air to disperse particles, fine particles (particles below 1 μm) might not be dispersed fully by air, particularly when there is a considerable amount of them.
In this situation, the wet test will be an ideal choice as it has a greater resolution for fine particles. As the wet technique utilizes water or organic solvents as the dispersion medium, the powerful dispersion and quantifying of ultrafine particles could be obtained by adding ultrasonication, surfactants, stirring, and other means.
As displayed in Figure 7, two epoxy ester coatings with little different proportions of fine particles were differentiated in a successful manner, by the wet dispersion method. Hence confirming outstanding resolution of wet test for fine particles of powder coatings.
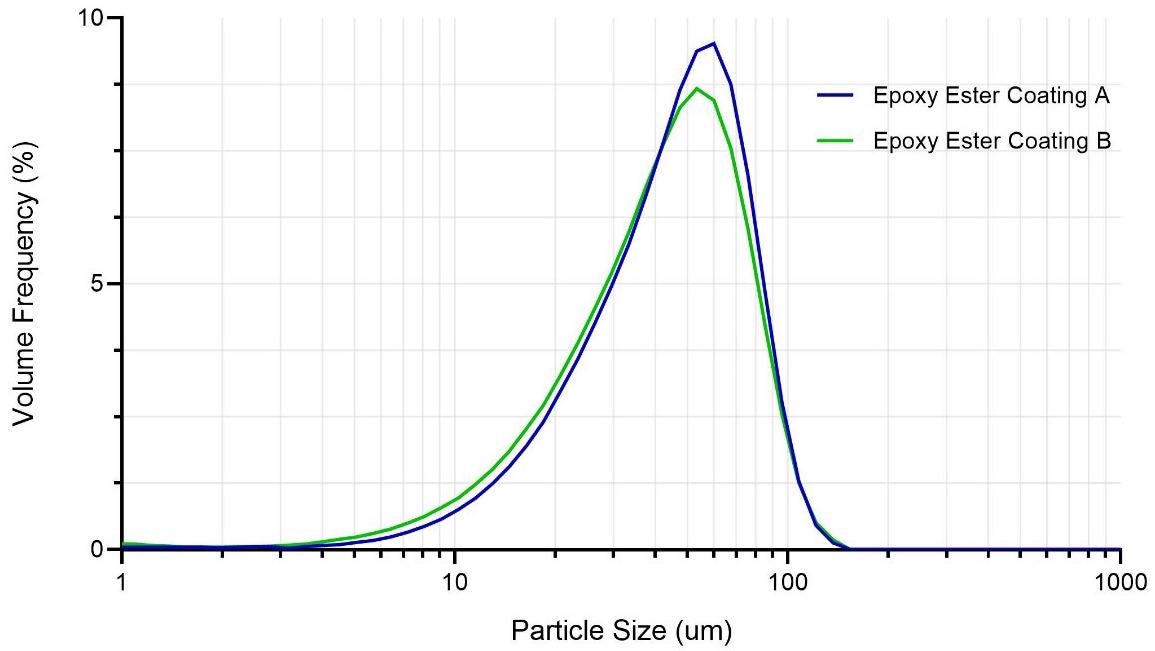
Figure 7. Particle size distributions of epoxy ester coatings from different manufacturers measured by wet tests. Image Credit: Bettersize Instruments
Dynamic Image Analysis
Furthermore, morphological information could impact the spraying and performance of powder coatings, and the most significant feature of the imaging analysis technique is that it has the ability to envision the particles.
The morphology data of the particles can be provided, like the circularity and aspect ratio of the particles. The Bettersizer S3 Plus with the integrated system of dynamic imaging and laser diffraction technique is capable of offering extensive data on powder coatings.
In this context, the dynamic image analysis system of the Bettersizer S3 Plus was utilized to quantify two polyurethane coatings provided by two powder coating manufacturers. The circularity distributions are displayed in Figure 8.
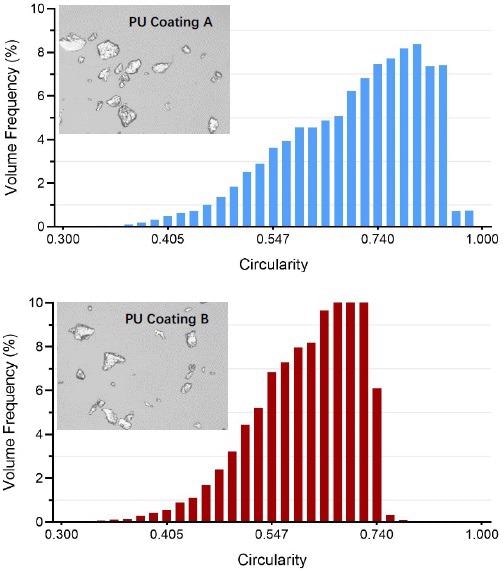
Figure 8. Circularity distributions of PU coating A and B obtained by dynamic image analysis. Image Credit: Bettersize Instruments
It can be noted that the two powder coatings exhibit different variations in circularity and shape. The average circularity of PU Coating A is around 0.717 with a circularity span of 0.486 whereas the average circularity of PU Coating B is 0.654 with a circularity span of 0.386.
The image analysis system has the ability to track the particle size, particle size distribution, and circularity in an effective manner at the time of the production process of coatings.
It consists of a higher resolution of coarse particles and can rapidly capture large particles, which is particularly beneficial when it comes to denoting the existence of oversized particles in production to help regulate product quality. This helps enhance the performance of powder coating products.
Conclusion
As far as the production process of powder coatings is concerned, particle size is known to be one of the most significant physical properties.
It not only impacts the spraying performance of finished coatings, but is also directly linked to the full production process of coatings, like the selection and dispersion of fillers, the operating parameters of classifiers and mills, and the spraying of finished coatings.
Laser diffraction analyzers have substituted traditional techniques to a huge extent primarily as a result of the benefits of the technology such as user-friendliness, fast operation, and high reproducibility. They are known to be strong tools for the powder coating industry.
However, the laser particle size analyzer itself lacks the ability to offer data regarding the shape and the particle dispersion state. Hence, with the dynamic imaging analysis, not only can the particle size be given, but also crucial shape information like circularity and aspect ratio. It is considered a perfect supplementary tool to the laser analyzer.

This information has been sourced, reviewed and adapted from materials provided by Bettersize Instruments.
For more information on this source, please visit Bettersize Instruments.