Sponsored by CavitarReviewed by Louis CastelDec 13 2022
Welding is a process in which materials, such as metals or thermoplastics, are joined together using extreme temperatures to create a joint. A filler material is typically added and melted onto the joint for enhanced strengthening properties.
The success of the welding process and the strength of the final product are dependent on several factors, such as the weld’s profile on the joint and the constant even flow of shielding gas to prevent oxidization of the melted metals or the filler material.

Image Credit: Cavitar
These factors can be imaged to track or study the welding process. Some of the imaging techniques used to gather information on welding processes are discussed in this article, as well as an evaluation of possible applications and a review of some of the studies completed on the topic.
Section 2 presents the most common industrial welding processes, while Section 3 provides an overview of imaging techniques that can be used to visualize welding.
Section 4 evaluates the features that can be imaged in welding and why the information obtained is of particular interest. This section will summarize previous studies on the topic where possible.
Most of the visualization principles discussed here also apply to the imaging of laser, arc, and plasma-based additive manufacturing.
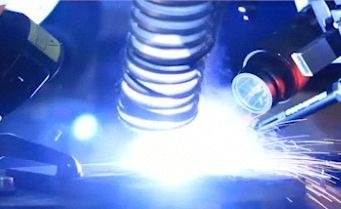
Figure 1. Typical setup in welding and additive manufacturing research shows* high-speed camera on the right with laser illumination on the left. Image Credit: Cavitar
Welding Processes
Gas Metal Arc Welding (GMAW)
In gas metal arc welding (GMAW), alternatively known as metal inert gas (MIG) welding and metal active gas (MAG) welding, a welding gun generates an electric arc between the consumable wire electrode that passes through the gun and the metals being welded.
The metals are welded by the intense heat of the arc. Shielding gas is fed through the welding gun, which shields the melted metals from coming into contact with the ambient air.
The power source typically used in GMAW is constant voltage and direct current, although it is possible to use an alternating current. The metal transfer methods frequently used in GMAW are globular, short-circuiting, spray and pulsed spray. The selected method depends on the welding application.
GMAW is the most commonly used process in industrial welding, as it can be automated and is fast and versatile. The process is well-suited for indoor use because of the shielding gas.
Studies related to the process are limited despite the frequent application of GMAW. This is primarily due to the challenges associated with producing reliable images of the process.
The electric arc's brightness disrupts the imaging process, preventing cameras from tracking the welding action. However, this obstacle can be overcome by applying an appropriate imaging technique, light source, and filter, which are later described in Sections 3 and 4.
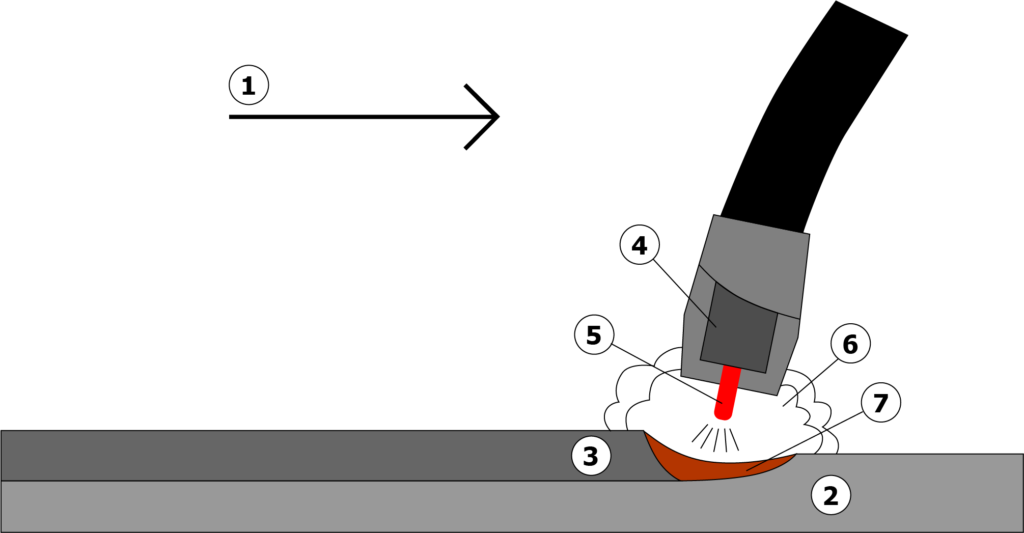
Figure 2. GMAW: the principle of operation. (1) Direction of travel, (2) Workpiece, (3) Solidified weld metal, (4) Contact tube, (5) Electrode (filler wire), (6) Shielding gas, (7) Melt pool. Image Credit: Cavitar
Cold Metal Transfer (CMT)
Cold metal transfer (CMT) differs from traditional GMAW, primarily in terms of the arc’s heat input and stability.
In CMT, each short circuit is identified and each detection signal causes the filler wire to retract from the weld, leaving it time to cool before dispensing the next filler material drop. This technique reduces the amount of spatter and results in a more robust and smoother seam than the traditional GMAW method.
CMT has been found to be a better choice compared to GMAW, particularly when welding steel and aluminum (Selvi et al. 2018).
Gas Tungsten Arc Welding (GTAW)
Gas tungsten arc welding (GTAW), alternatively known as tungsten inert gas (TIG) welding, utilizes a welding torch rather than a gun to generate an electric arc between a non-consumable tungsten electrode and the workpiece metals.
Like GMAW, the weld is protected by a shielding gas to prevent contamination. A filler metal is generally used to join the workpiece metals together, but it is not always necessary. The power source used for GTAW is typically a constant current.
GTAW is ideal for the welding of magnesium, copper and aluminum alloys, and other non-ferrous metals, as well as thin sections of stainless steel. In contrast to GMAW, GTAW produces welds with improved strength and enhanced quality due to the operator having greater control over the weld.
Conversely, it is a slower and more challenging process. In terms of visualization, it is easier to image GTAW compared to GMAW due to the variances in heat and amount of spatter.
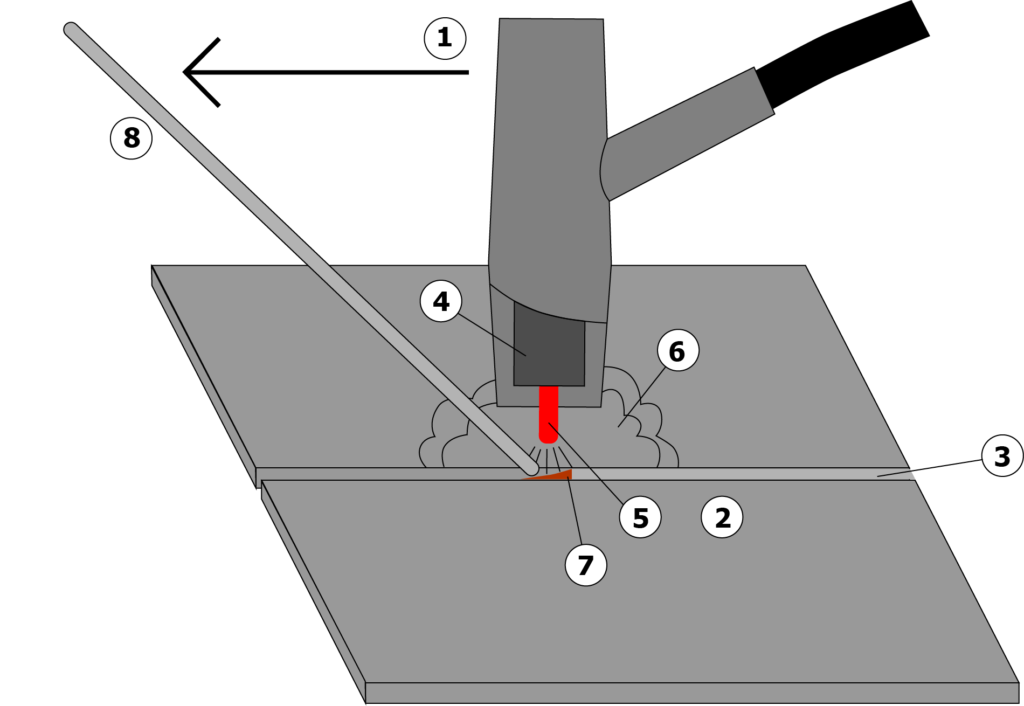
Figure 3. GTAW: the principle of operation. (1) Direction of travel, (2) Workpiece, (3) Weld seam, (4) Contact tube, (5) Electrode, (6) Shielding gas, (7) Melt pool, (8) Filler rod. Image Credit: Cavitar
Plasma Arc Welding (PAW)
The plasma arc welding (PAW) setup is similar to GTAW in that PAW also uses an electrode that is usually made of sintered tungsten. However, the electrode is situated inside the welding torch in PAW, making it possible to split the plasma arc from the shielding gas envelope.
As the plasma is passed through the small opening of the torch nozzle, the heat and speed of the arc increase, improving the heat transfer properties, stability and shape of the arc. PAW can be applied when joining workpieces with or without filler material.
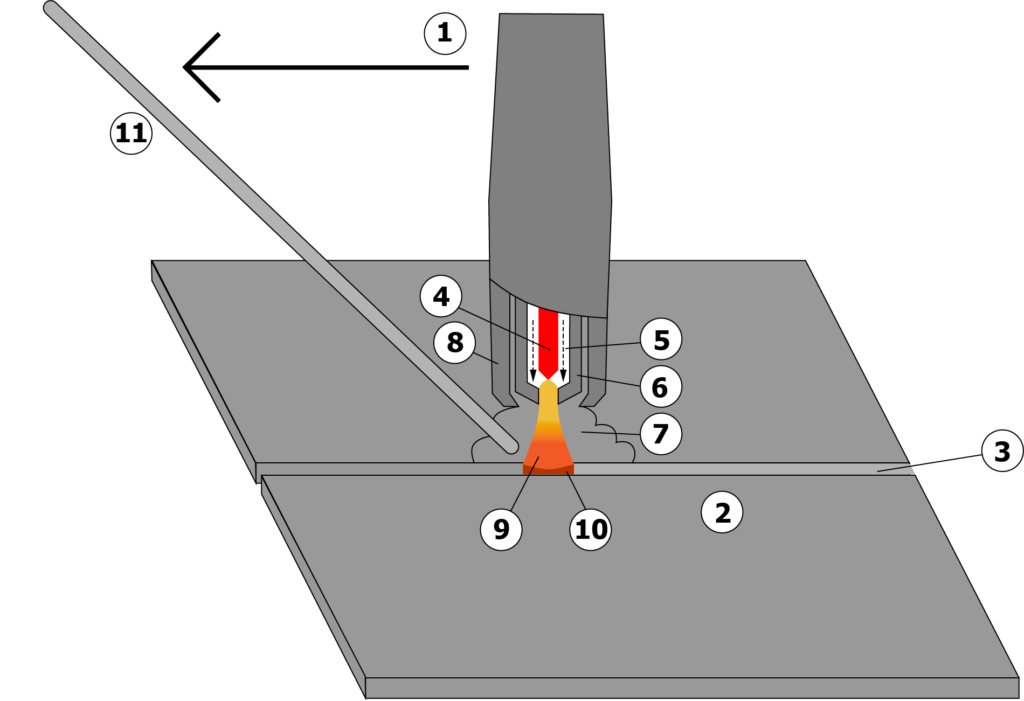
Figure 4. PAW: the principle of operation. (1) Direction of travel, (2) Workpiece, (3) Weld seam, (4) Electrode, (5) Plasma gas, (6) Water-cooled torch body, (7) Shielding gas, (8) Shielding gas nozzle, (9) Plasma arc, (10) Melt pool, (11) Optional filler rod. Image Credit: Cavitar
Laser Beam Welding (LBW)
In laser beam welding (LBW), a laser is applied as opposed to using an electric arc to melt the materials being welded.
The greatest advantages of LBW are that it can be automated easily (which most LBW processes are) and the heat source is very highly concentrated, making it possible to successfully create deep and narrow welds.
A pulsed laser beam can be applied to thin workpieces. As the heat can be focused on a small area, the workpiece surface heating and cooling occur rapidly.
However, this could present some issues when welding steels with high carbon concentrations, as the surface could be prone to cracking due to rapid cooling.
LBW can be utilized for welding a range of different materials, e.g., stainless steel, carbon steels, and aluminum, as the welding power of the laser beam can be easily controlled.
LBW presents fewer challenges when it comes to imaging compared to arc welding processes. It is easier to filter out the narrow, known spectrum of the wavelength in LBW than the light produced in arc welding processes.
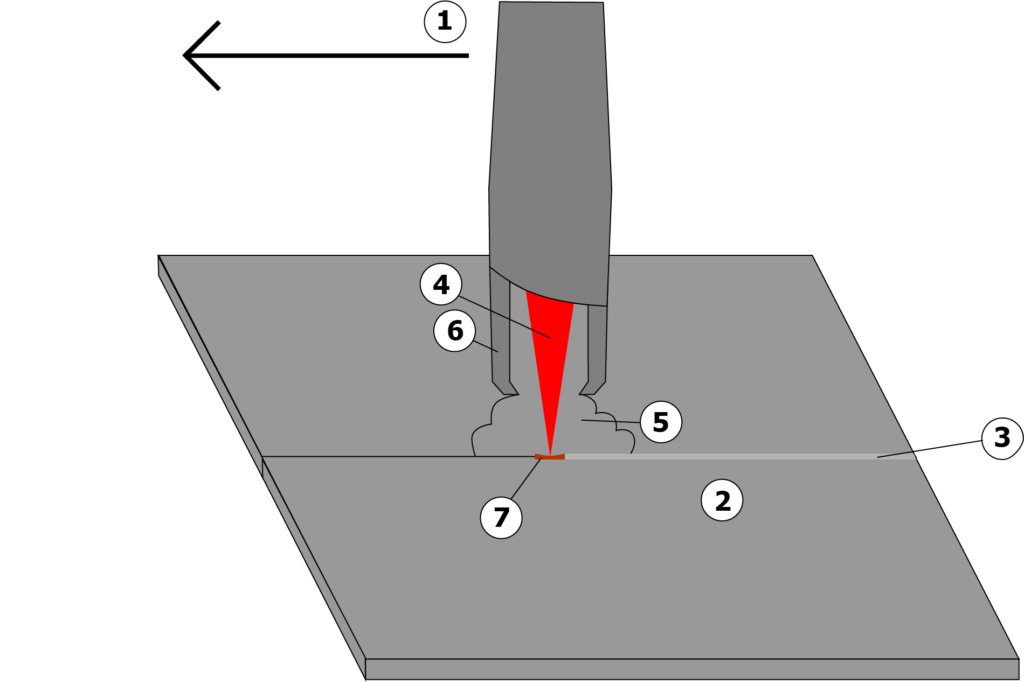
Figure 5. LBW: the principle of operation. (1) Direction of travel, (2) Workpiece, (3) Weld seam, (4) Laser beam, (5) Shielding gas, (6) Shielding gas nozzle, (7) Melt pool. Image Credit: Cavitar
Other Welding Processes
Other welding methods that could gain an advantage from the use of laser illumination include gas welding and pressure welding, further divided into explosion, resistance, and friction welding.
Explosion welding has been assessed with the CAVILUX laser (see Pabst 2017, https://www.cavitar.com/library/high-speed-visualization-of-electromagnetic-pulse-welding/). Conversely, submerged arc welding gains no advantage from laser illumination as the weld area is covered with granular solid flux.
Imaging Techniques
Welding process imaging presents significant challenges due to the camera being blinded by the electric arc’s brightness. This section presents various imaging techniques for the visualization of welding processes, outlining the strengths and weaknesses of each.
General Guidelines for Capturing High-quality Images of Welding Processes
Filtering and Illumination
One way to image welding processes is by using only the process light as the light source for the camera without any additional active lighting.
In this case, the illumination is mostly provided by the electric arc of the welding process, the temperature of which, depending on the process, can vary between 6000 and 20,000 °C.
However, when only relying on the process light, it is usually too bright for the camera sensor, which creates saturated images that do not display much detail about the process.
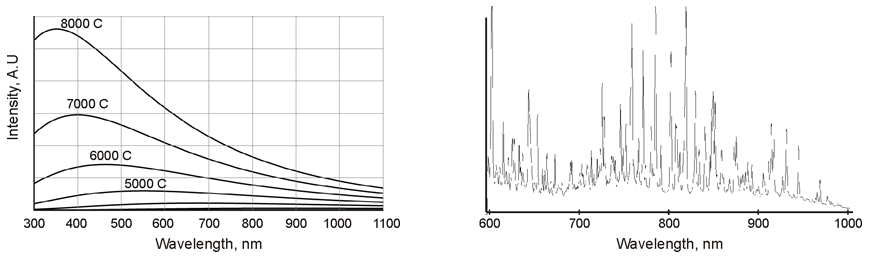
Figure 6a. Thermal process radiation (left). Figure 6b. Emission peaks of process elements (right). Image Credit: Cavitar
The amount of process light that enters the camera sensor can be limited by using neutral density filters. The drawback of this approach is that poorly illuminated areas become even darker, meaning that not all features can be visualized when only using filters.
Being able to observe “hot” and “cold” regions simultaneously necessitates the application of both a filter that avoids image saturation by limiting the amount of process light entering the camera sensor and by illuminating the object using additional illumination that functions with the filter transmission band.
The starting point is not ideal as the capture of high-quality, detailed images necessitates an additional light source that is more powerful than the exceptionally strong electric arc.
On the other hand, if a highly efficient narrow band pass filter is used, it is possible to illuminate the object with what is essentially a monochromatic laser light source.
A narrow band pass filter prevents most of the process light from entering the camera sensor, allowing only that which is emitted at the narrow transmission band of the filter. The active laser illumination needs to be more powerful than the process light within the narrow transmission band of the filter.
In practice, this requires the laser power of just a few hundred watts. Such an assembly facilitates simultaneous visualization of both “hot” and “cold” regions. A comparison of the various illumination setups is shown in Figure 6.
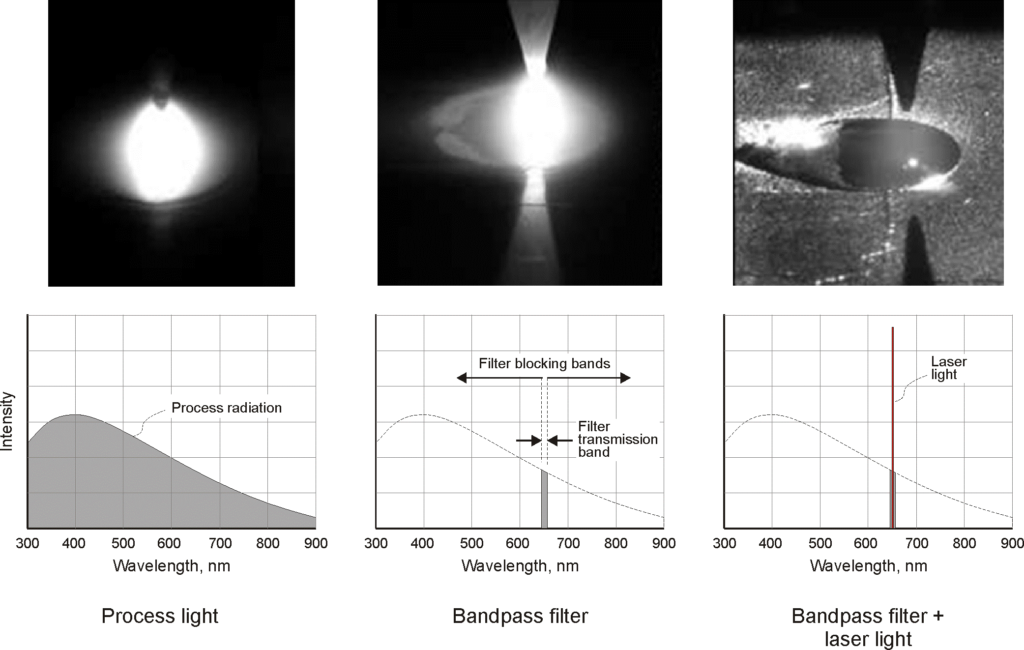
Figure 7. Comparison of three different illumination setups for the visualization of welding processes. Image Credit: Cavitar
Camera Properties
In industrial environments, the continuous real-time monitoring of welding processes is preferred, which means that low frame rates are utilized.
Alternatively, in research and development, it is usually possible to use high-speed cameras for recording the welding processes. High-speed cameras have the capacity to capture fast-moving phenomena, which could be missed using a standard camera setup using lower frame rates.
Regardless of the frame rate, the camera should typically be able to process short exposure times and have a monochrome sensor if it is to be used with (monochromatic) laser illumination.
A short exposure time reduces the amount of process light passing through the narrow band pass filter. The illumination of the process using a short laser pulse (preferred on the microsecond scale) rather than a continuous wave light source, for instance, is just as important.
Short laser pulses do not produce thermal effects on the object, and they make the safety management of the laser much simpler. Compared to a color camera, a monochrome camera ensures enhanced sensitivity and image quality.
Properties of Camera Optics
The key criteria for selecting camera optics include the field of view and working distance. The camera’s physical dimensions also need to be considered. An adjustable iris may be useful, as overall image brightness can then be adjusted. A smaller iris also enables a greater depth of view.
Positioning the Camera and Illumination
By adjusting the relative angle between the camera and illumination, various features of the welding process can be emphasized. Moreover, the positions of the camera and illumination features also play a crucial role when it comes to preventing any specular reflections from bouncing off the metal surfaces of the workpiece(s).
Common visualization geometries include:
- The camera and illumination are directed at the process from effectively the same direction. The surface of the workpiece and the wire, among other things, can be clearly seen. Specular reflections might, however, lead to disturbances in the images.
- Side illumination: the angle between the camera and illumination is approximately 90 degrees. This setup usually reduces specular reflections and can enhance the visibility of the melt pool.
- Direct back illumination: the object is situated between the camera and illumination. This setup produces sharp silhouette images, which is appropriate for drop formation studies, for example.
- Indirect back illumination: the illumination is not fixed directly at the camera. This setup enhances the visibility of the melt pool compared to direct back illumination.
- Application of diffusing elements or several additional illumination sources: distributed illumination, such as light delivery via several illumination fibers. This setup limits the number of specular reflections.
- Combination of the techniques as described above.
Generally, the most appropriate configuration for each application can be found by testing different angles between the camera and illumination. The images below demonstrate two direct illumination setups and an indirect illumination setup utilizing a reflective plate.
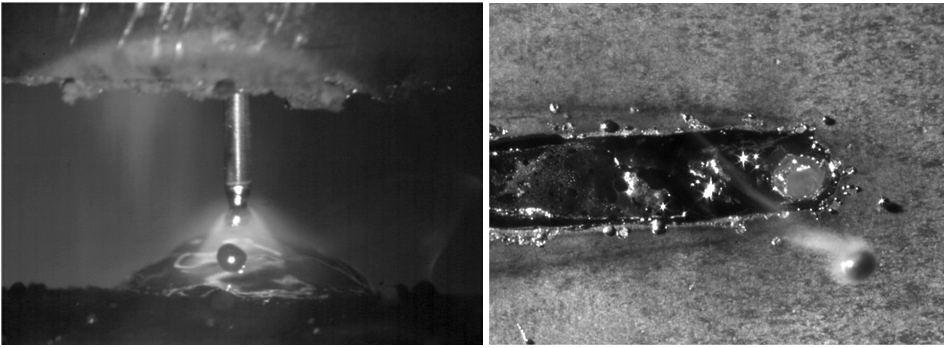
Figure 8. Left: Simultaneous direct and back illumination of arc welding. Right: Direct illumination of laser welding. Image Credit: Cavitar
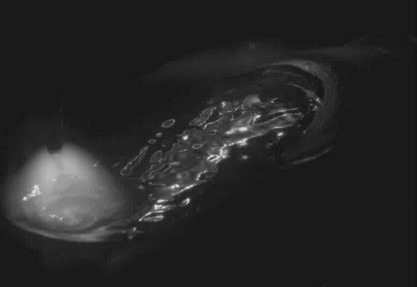
Figure 9. Indirect illumination using a reflective plate to highlight melt pool dynamics. Image Credit: Cavitar
Machine Vision vs. High-speed Imaging
Machine vision applies to the constant monitoring of industrial processes with camera-based solutions.
Machine vision can be used for process and quality control in welding processes. Process parameters can be modified on the basis of the live image or results captured by image analysis. Combining machine vision with advanced image analysis algorithms facilitates automated process control and can reduce staff workload.
High-speed imaging captures multiple consecutive frames at rapid rates. In the welding industry, it is primarily used for research and development purposes.
High-speed imaging enables fast and ultrafast phenomena to be observed in slow motion, which means that they can be carefully analyzed and their inner workings fully comprehended.
The chosen solution defines the imaging speed: an in-situ storage CCD solution has the capacity to capture 103 images at 10 Mfps, whereas a gated intensified CCD solution captures 4-12 images at 200 Mfps. Similar speeds can be accomplished using CMOS solutions.
Combining machine vision and high-speed imaging can also be used for monitoring industrial welding processes. It is possible to program the analysis software to trigger high-speed imaging when the algorithms identify particular changes or features that might be of interest for additional analysis. Process industries are moving towards applying this sort of automated process control.
Laser Illumination
The primary advantage of laser illumination in the visualization of welding processes is that it facilitates the use of an extremely efficient narrow band pass filter. Therefore, the laser need only be more powerful than the process light within this narrow transmission band. In practice, this means a laser with a power of a few hundred watts can be used.
Conversely, the filtering of process light means that the process brightness can be dealt with and the images captured display greater amounts of information.
Laser illumination enables high illumination power to pass through an aperture of just a few millimeters, generating high levels of brightness.
The light delivery can be synchronized accurately and adjusted in 10 ns increments.
In contrast to LED illumination, lasers offer monochromatic, speckle-free light and high irradiance. Lasers are typically compact in size, which means that they are compatible with a wide range of setups.
Fiber coupling means that it is not necessary to position the laser right next to the target. The possibility of utilizing short pulses means that rapid phenomena can be recorded without motion blur.
Other advantages of laser illumination for visualizing welding processes include:
- Clear view through heat
- High-speed imaging
- High-quality images that facilitate simultaneous image analysis and live monitoring of dimensions, shape, position, topography, and surface defects
- Measurements over long distances
- No issues related to motion blur
- Polarized light (linear or circular)
The illumination techniques, made possible by the use of lasers, are versatile and include direct fiber-coupled, structured patterns and long-distance illumination.
For particularly fast phenomena, such as shockwaves, laser illumination provides the possibility of using double pulses, making it possible to capture the expansion speed of the shockwave.
Filters and Other Optical Components
The primary function of filters is to enhance image quality. Filters are an excellent tool for manipulating the amount and type of light entering the camera sensor. This is especially vital in GMAW and GTAW, where the electric arc is extremely bright.
Depending on the assembly and availability of extra components, the filters that can be applied include neutral density and narrow band pass filters. (See Section 3.1.1.)
Schlieren and Shadowgraphy
Schlieren imaging is typically used to study phenomena that are not visible to the naked eye but that have the capacity to change the direction of light. The method is based on visualizing differences in the refractive indices of transparent media, such as air or water. An example of a schlieren setup is shown in Figure 10.
In contrast, shadowgraphy is a visualization method where images are captured with the same assembly as schlieren images but without a mask.
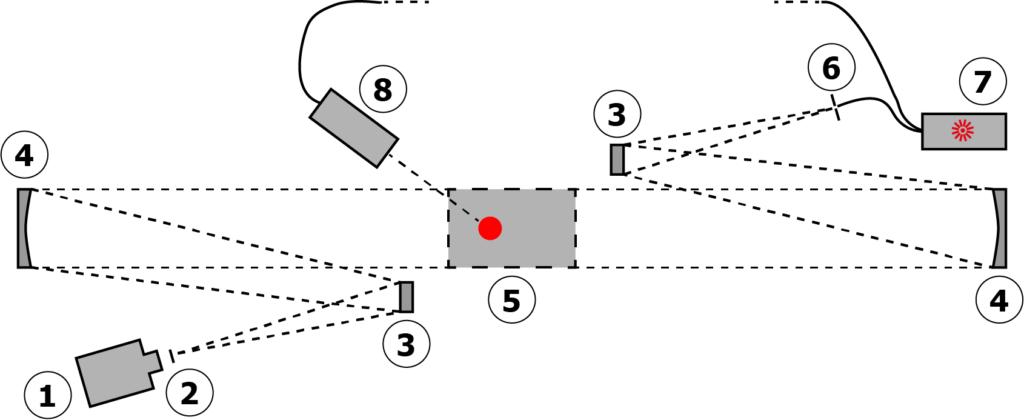
Figure 10. Cavitar folded Z-type schlieren setup. (1) Camera, (2) mask, (3) auxiliary mirror, (4) mirror, (5) test region, (6) slit, (7) CAVILUX laser and (8) optional front illumination. Image Credit: Cavitar
The shadowgraph technique generates shadowgrams, which, as Settles (2001:29) puts it, “is not a focused optical image” but “a mere shadow.”
Shadowgraphy is less sensitive than schlieren, but it is well-suited for visualizing shockwaves and turbulent flows. The two techniques are complimentary in terms of the information they provide about a phenomenon. While shadowgraphy displays changes in density, it is not able to reveal direction.
As well as the use of a mask, the other main difference between the techniques is that “the schlieren image displays the deflection angle”, whereas “shadowgraphy displays the ray displacement resulting from the deflection” (Settles 2001: 29).
A shadowgraph system is much easier to assemble, as the most arduous task of schlieren imaging is determining the appropriate placement of the mask and ensuring suitable levels of sensitivity.
However, the benefits schlieren offers tend to outweigh the complexity of the setup: schlieren “emphasizes, even exaggerates details in the schlieren object where shadowgraphy usually downplays it” (Settles 2001: 29). Furthermore, “its unambiguous 1:1 image correspondence with the object of study is often a decisive benefit” (Settles 2001: 29).
Objects of Imaging
Welding processes incorporate a variety of components and phenomena that can be imaged using the techniques presented above.
The primary focus is on visible features in welding process visualization. By imaging and evaluating these features, it is possible to identify and prevent defects as well as control and optimize the process.
This section outlines what components and phenomena can be visualized while providing examples of a selection of their properties that might be of interest to study.
Groove and Joint
Groove relates to the space between the workpieces to be welded or to a channel in the surface of an individual workpiece.
Groove is the space in which the melted metal is concentrated and where the seam is formed. In groove welding, it is typically necessary to prepare the joint. Examples of various grooves are exhibited in Figure 11.
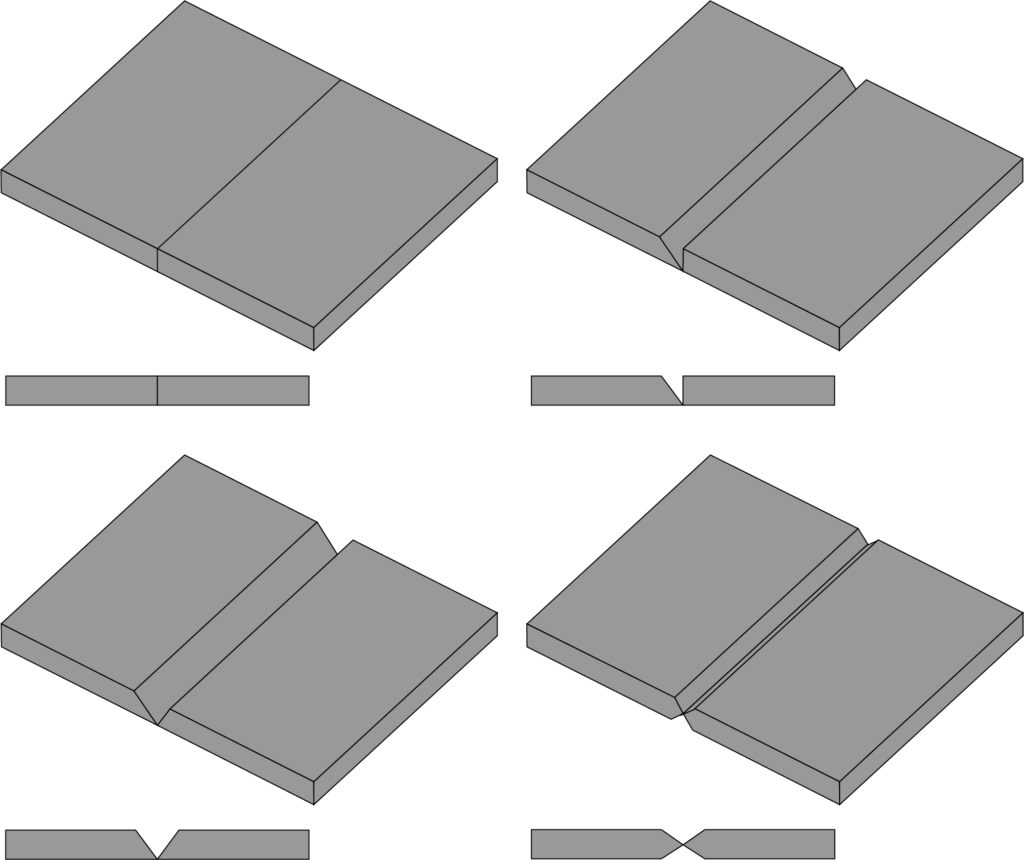
Figure 11. Examples of different types of grooves. Image Credit: Cavitar
Some groove properties are key to ensuring a successful weld. These properties include the shape of the edges of the workpieces welded together, the height of the workpieces in comparison to each other, the shape of the groove between the workpieces, and the alignment of the workpieces. It is possible to visualize and track each of these properties throughout the process.
The joint is where two or more workpieces are joined together, which often means that it is synonymous with groove. However, grooves may also be seen on the surfaces of single workpieces.
In welding, the location of the joint in relation to the welding torch is important when it comes to creating a robust, smooth seam, and precise guiding of the heat enhances weld quality. This is particularly critical in LBW, where seams are generally narrow and any deviation may result in a lack of sidewall fusion (see, e.g., Nilsen et al. 2017).
By combining visualization of the welding process and powerful analysis algorithms, it is possible to track and make automated adjustments to the location of the welding torch relative to the location of the joint.
Imaging of Plasma Welding with Cavitar Welding Camera
Figure 12. Example of joint in plasma welding. Video Credit: Cavitar
Filler Wire
GMAW and SMAW utilize consumable wires fed through the welding gun at an even rate. The electric arc is generated between the wire electrode and the workpiece(s).
The wire material is contingent on the material of the workpiece(s) as well as other characteristics of the welding process and it has an influence on the final quality of the weld.
In GTAW and PAW, the filler wire is passed through to the weld area from outside the welding torch, as a non-consumable electrode is employed to form the arc (see below).
High-Speed Visualization of Flux Coating in SMAW Welding
Figure 13. Consumable wire with flux coating in SMAW welding. More under the related application note: https://www.cavitar.com/library/high-speed-visualization-flux-coated-electrode-hand-welding/. Video Credit: Cavitar
Droplets
As the filler wire melts, the weld seam forms as droplets of the filler metal are transferred to the workpiece. The primary reason to image and study droplets is to determine if there are problems with regular droplet formation and optimize the process to eliminate any problems. The position of the filler wire in relation to the groove is also critical to ensure a well-formed seam is achieved.
Imaging of Filler Wire in GMAW Welding at 10,000 Fps with CAVILUX Laser
Figure 14. Filler wire in GMAW welding. Video Credit: Cavitar
Spatter
Spatter comprises weld material droplets that splash around the workbench or workpieces during the welding process.
Due to high temperatures, the spatter may damage the working area if it is not appropriately prepared, resulting in unwanted round marks on the finished product.
Spatter marks can cause corrosion and originate from either the filler wire or the melt pool and are generally associated with GMAW.
Factors that can cause spatter include impurities on the workpiece surface, certain properties of the arc, some shielding gases, welding angle, and filler wire speed.
Gunenthiram et al. (2018) demonstrated that spatter ejections can be analyzed successfully by combining high-speed imaging, laser illumination, and subsequent image analysis.
The study concluded that the material of the powder influences the amount of spatter produced in powder bed LBW, and visualization can be applied as an analysis tool to reduce spatter.
Spatter Behavior in Fiber Laser Beam Welding Process
Figure 15. Spatter creation in laser welding.* More under the related application note: https://www.cavitar.com/library/spatter-behavior-in-laser-beam-welding-process/. Video Credit: Cavitar
Electrode
In GTAW and PAW, a non-consumable tungsten electrode is positioned in the center of the welding torch.
The electric or plasma arc is formed between this electrode and the workpiece(s). The visualized and evaluated electrode properties include the condition of the electrode and its relative position to the workpiece(s).
Visualization of TIG Welding with CAVILUX Laser Illumination
Figure 16. Tip of a TIG process. More under the related application note: https://www.cavitar.com/library/modern-variants-of-classical-arc-welding-technologies-with-high-speed-videography/. Video Credit: Cavitar
Arc
An electric arc is formed in arc welding between the filler wire or the electrode and the workpiece. The arc is caused by electric discharge and is responsible for heating up the metal during welding.
It can be difficult to visualize the arc due to its exceptionally high levels of brightness. As most of the brightness can be filtered out, laser illumination is all but necessary to capture the properties of the arc.
Schlieren setups with high-power light sources can be employed to investigate the interaction between the arc interacts and the workpiece (see, e.g., Siewert et al. 2014).
Visualization of Arc Creation in GMAW with CAVILUX Illumination Laser
Figure 17. Arc creation in GMAW – spin arc. More under the related application note: https://www.cavitar.com/library/modern-variants-of-classical-arc-welding-technologies-with-high-speed-videography/. Video Credit: Cavitar
Shielding Gas
The gas mixture that continuously flows from the welding gun or torch during welding is known as the shielding gas. This prevents the melted material from oxidizing, ensuring a healthy, strong joint.
The shielding gas is a key element in welding, as an uninterrupted, optimized flow of the gas ensures that the weld is not exposed to any contaminants in the air.
According to Siewert et al. (2014: 1) contamination can cause “arc instability, oxidation, porosity, and spatter.”
Moreover, the plasma and the arc spots can be negatively impacted if contact with oxygen or other atmospheric gases is made. Details on the flow and functionality of shielding gases are beneficial when developing new welding guns and torches.
The most crucial feature of welding guns and torches in terms of shielding gas is ensuring the nozzle has good functionality that allows the gas flow without separation or turbulence (Siewert et al. 2014).
Shielding gas is one of the most investigated components of welding. Siewert et al. (2014: 1) report that both laser doppler anemometry (LDA) and particle image velocimetry (PIV) have been tested for the analysis of shielding gas flows.
PIV was the better suited of these two as it made the “nonintrusive and temporally resolved detection of a two-dimensional gas flow field” possible in both GMAW and GTAW applications. However, mastering the measuring technique requires extreme dedication and can be expensive.
A more cost-efficient and easier way to evaluate effective shielding gas flows is the schlieren imaging technique. However, the arc’s brightness is challenging, particularly in GMAW. This can cause a disturbance in the images.
GMAW is a difficult process to visualize. However, by modifying the key components, i.e., the light source and the mask, it is possible to capture high-quality schlieren images of the shielding gas.
As a mask, Siewert et al. (2014) established that a knife-edge mask perpendicular to the workpiece is the optimal solution, but various shapes and sizes of masks are suited to the visualization of various phenomena.
The most appropriate mask for an application is also contingent on the shape of the light source, as in an optimal case, the shape of the mask is relative to the shape of the light source.
Two-color filters can be used to enhance the visibility of turbulences while boosting contrast and reducing light intensity. To completely block the arc’s brightness, a combination of a laser light source with “a neutral gray filter with a transmittance of 1 %” can be used (Siewert et al. 2014: 4).
Siewert et al. (2014: 4) found that the consistency of the shielding gas has an influence on the visibility of the gas in the schlieren images: “[t]he transition of the process gas-free jet to the atmosphere is especially good to visualize using argon with an appreciable helium percentage (50%) as shielding gas. However, it has to be assumed that helium has an essential influence on the arc geometry and, above all, on the gas flow.”
On the other hand, Bitharas et al. (2018) successfully used the schlieren technique to investigate the shielding gas flows that consisted of 80% argon and 20% carbon dioxide (CO2), and 86% argon, 12% CO2 and 2% oxygen (O2).
Dreher et al. (2009) studied the use of schlieren imaging for the visualization of shielding gas when the arc is present. The team accomplished good results with a Z-type schlieren assembly using specific apertures, filters, lenses, and mirrors.
The images captured helped assess the flow properties of the shielding gas with and without the arc, with a focus on turbulences and their influence on the workpiece. Such information can be used for the development of a new welding torch with enhanced shielding gas flow properties.
See the Invisible - Schlieren Imaging of Welding GMAW with CAVILUX
Figure 18. Shielding gas flow of GMAW welding captured with Schlieren technique. The shockwave of the arc is visible. Video Credit: Cavitar
In another similar study, Dreher et al. (2013) continued to utilize PIV and schlieren images to investigate how different shielding gas nozzles impact shielding gas flow. They also took into consideration the torch alignment and the type of joint as factors that could impact the flow properties.
To visualize the shielding gas using PIV, Dreher et al. (2013) used a combination of CAVILUX laser illumination for tracer particles. The most significant advantage of PIV is how easy it is to transport the measurement components and that it can be used with any chemical shielding gas composition.
PIV is well-suited for analyzing the flow field in the shielding gas-free jet and close to the arc. It is possible to visualize the shielding gas turbulent flow effects more efficiently with the schlieren technique. However, the consistency of the gas is critical as the technique is based on density variances.
In addition to PIV and schlieren, shielding gas flows have been imaged and analyzed successfully using shadowgraphy. Using a portable shadowgraphy system with laser illumination, Beyer et al. (2013) investigated optimal shielding gas flow rates and the effects of cross-draft and nozzle size on shielding gas coverage during metal inert gas welding.
It was established that welders unnecessarily increase the shielding gas flow rates, which results in avoidable costs. It was discovered that the shielding gas flow rate should be predicated on the maximum cross-draft expected and the size of the nozzle used.
The analysis demonstrated that in some welding processes, even a 50% reduction in shielding gas flow rate does not undermine the weld’s quality, which means that the study of the process and establishing optimal parameters can generate remarkable annual savings.
For additional reading on the visualization of shielding gas, see Bitharas et al. (2016), Siewert et al. (2014) and Schnick et al. (2013).
Visualization of Shielding Gas in GMAW with PIV + CAVILUX Illumination Laser
Figure 19. Example of arc forming in GMAW welding. Setup included a light sheet optic to study shielding gas flow with PIV method. More under the related application note: https://www.cavitar.com/library/piv-measurements-shielding-gas-flow-gas-metal-arc-welding-gmaw-cavilux-hf-diode-laser/. Video Credit: Cavitar
Melt Pool
A melt pool is the melted weld metal that has not solidified, which means that it is usually found at the spot being welded.
Factors impacting the shape and behavior of the melt pool include the power used, welding speed, and the focal point. It is important to understand the qualities of the melt pool to optimize the incorporation of filler material droplets in the melt pool and, as a result, reduce the amount of spatter (see Gunenthiram et al. 2018 on weld materials, melt-pool viscosity and spatter, and Fabbro 2010 on melt pool behavior in LBW).
Using a schlieren imaging setup with laser illumination, Salminen et al. (2008) successfully visualized the shape and oxidization of melt pools.
The team described that previous studies of high-speed imaging have shown that narrower welds and stronger melt flows near the surface of the weld can be achieved with increased welding speed. However, when the speed exceeds a certain threshold, there was a deterioration in the seam quality due to increased spatter.
They were not able to track the melt pool behavior in their own study due to shortcomings in the equipment used, but in spite of this, they discovered that the melt pool typically widens behind the keyhole. Furthermore, the melt pool demonstrates similar characteristics throughout the depth of the penetration.
On the other hand, Coniglio et al. (2014) applied the shape-from-polarization methodology for the topographic characterization of melt pools. The method is based on the thermal radiation the melt pool emits and uses Background-Oriented Schlieren to support the reconstruction of the melt pool surface.
The method works best with low current intensity. Such topographic measurements deliver crucial information on the concavity and convexity of the melt pool, which points towards either a lack or excess of filler material.
Visualization of Gas Flow in a Multilayer CMT Process (Slow Motion)
Figure 20. Observation of the melt pool in CMT additive manufacturing in combination with schlieren imaging. Video Credit: Cavitar
Keyhole
When the arc heats up the material and parts of it are vaporized, a keyhole forms in the center of the melt pool.
Keyholes are of key significance in LBW, where the laser beam efficiently vaporizes the weld material, creating a keyhole where the energy transmits to the surrounding areas. The crucial features of the keyhole include its shape, size, and behavior, all of which influence the quality of the weld. The keyhole is closely associated with the melt pool.
According to Salminen et al. (2008), the relationship between the keyhole and the focal point is crucial for ensuring high-quality welds are achieved. Previous studies demonstrate that the position of the focal point should be beneath the workpiece surface and the keyhole should be around 85% of the size of the focal point.
However, Salminen et al. (2008) discovered that the size of the keyhole may vary depending on the welding speed, and faster speed results in a longer, oval-shaped keyhole in contrast to a rounder keyhole typically seen with low welding speeds.
A low heat input produced unstable effects in the keyhole. A schlieren setup with laser illumination was employed to capture images of the welding process. While the imaging was successful, it was determined that a high-speed camera (above 10 000 fps) would be better suited for capturing any rapid changes occurring in the keyhole.
Fabbro (2010) also investigated the relationship between the keyhole and welding speed in LBW. It was found that in addition to welding speed influencing the shape and size of the keyhole, the laser used also plays a significant role.
Newer, high-quality laser beams have a more compact focal spot and due to the increased intensity, the shape of the keyhole is much more stable (for example, the threshold for the tilting of the keyhole front wall is higher).
Visualization of Keyhole in NdYAG Laser Welding with CAVILUX Illumination Laser
Figure 21. Keyhole in NdYAG laser welding process. Video Credit: Cavitar
References
- Allemand, C. D., Schoeder, R., Ries, D. E. and Eagar, T. W. 1985. “A method of filming metal transfer in welding arcs.” Welding Journal 64 (1): 45-47.
- Beyer, V., Campbell, S. W., Ramsey, G. M., Galloway, A. M., Moore, A. J. and McPherson, N. A. 2013. “Systematic study of effect of cross-drafts and nozzle diameter on shield gas coverage in MIG welding.” Science and Technology of Welding and Joining 18 (8): 652-660.
- Bitharas, I., Campbell, S. W., Galloway, A. M., McPherson, N. A. and Moore, A. J. 2016. “Visualisation of alternating shielding gas flow in GTAW.” Materials and Design 91: 424-431.
- Bitharas, I., McPherson, N. A., McGhie, W., Roy, D. and Moore, A. J. 2018. “Visualisation and optimisation of shielding gas coverage during gas metal arc welding.” Journal of Materials Processing Technology 255: 451-462.
- Coniglio, N., Mathieu, A., Aubreton, O. and Stolz, C. 2014. “Plasma effect on weld pool surface reconstruction by shape-from-polarization analysis.” Applied Physics Letters 104, 131603. https://aip.scitation.org/doi/10.1063/1.4870505
- Dreher, M., Füssel, U., Rose, S., Häßler, M., Hertel, M, and Schnick, M. 2013. “Methods and results concerning the shielding gas flow in GMAW.” Weld World 57: 391-410.
- Dreher, M., Füssel, U., Schnick, M. and Hertel, M. 2009. “Numerical stimulation of the shielding gas flow with GMA welding and options of validation by diagnostics.” https://tu-dresden.de/ing/maschinenwesen/if/fue/ressourcen/dateien/lichtbogenprozesse/veroeffentlichungen_Dokumente/DR552B1.pdf?lang=en
- Fabbro, R. 2010. “Melt pool and keyhole behaviour analysis for deep penetration laser welding.” Journal of Physics D: Applied Physics 43 (44): 445501.
- Gunenthiram, V., Peyre, P., Schneider, M., Dal, M., Coste, F., Koutiri, I. and Fabbro, R. 2018. “Experimental analysis of spatter generation and melt-pool behavior during the powder bed laser beam melting process.” Journal of Materials Processing Technology 251: 376-386.
- McClure, J. C., Garcia, G., Hou, H. and Nunes, A. C. 1993. “Gas Flow Observation During VPPA Welding Using a Shadowgraph Technique.” NASA CR-204347.
- Nilsen. M., Sikström, F., Christiansson, A.-K. and Ancona, A. 2017. “Vision and spectroscopic sensing for joint tracing in narrow gap laser butt welding.” Optics and Laser Technology 96: 107-116.
- Pabst, C. 2017. “High-speed visualization of electromagnetic pulse welding.” https://www.cavitar.com/library/high-speed-visualization-of-electromagnetic-pulse-welding/
- Salminen, A., Lehtinen, J. and Harkko, P. 2008. ”The effect of welding parameters on keyhole and melt pool behavior during laser welding with high power fiber laser.” Proceedings of the 27th International Conference on Applications of Lasers and Electro Optics. Laser Institute of America, pp. 354-363.
- Schnick, M., Dreher, M., Zschetzsche, J., Fuessel, U. and Spille-Kohoff, A. 2013. “Visualization and optimization of shielding gas flows in arc welding.” Welding in the World 56 (1-2): 54-61.
- Selvi, S., Vishvaksenan, A. and Rajasekar, E. 2018. “Cold metal transfer (CMT) technology – An overview.” Defence Technology 14 (1): 28-44. https://doi.org/10.1016/j.dt.2017.08.002
- Settles, G. S. 2001. Schlieren and Shadowgraph Techniques: Visualizing Phenomena in Transparent Media. New York: Springer.
- Siewert, E., Wilhelm, G., Hässler, M., Schein, J., Hanson, T., Schnick, M. and Füssel, U. 2014. “Visualization of Gas Flows in Welding Arcs by the Schlieren Measuring Technique.” Supplement to the Welding Journal, January 2014: 1-5.

This information has been sourced, reviewed and adapted from materials provided by Cavitar.
For more information on this source, please visit Cavitar.