Applications in the biological sciences benefit significantly from submicron IR microscopy, made possible with the new technique Optical Photothermal Infrared (O-PTIR) spectroscopy.
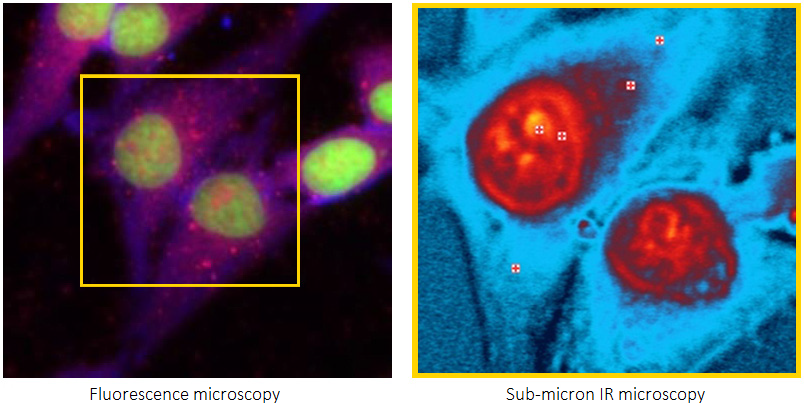
Image Credit: Photothermal Spectroscopy Corp
Global health is changing as a result of developments in life sciences research and technology, and these advancements have the potential to offer innovative and improved approaches to promote a healthy global population.
These developments encourage rising public and private funding for life science studies, driving researchers to upgrade their existing analytical and scientific research tools with cutting-edge methods, models, and algorithms to support these scientific discoveries.
Life sciences cover the study of living organisms, including humans, plants, and animals. Understanding the chemical molecular composition of cellular and biomolecular components and processes is essential to supporting many of these recent discoveries.
There are several methods available to study these molecular processes and chemical structures. A vital technology essential to life science is fluorescence microscopy, which offers high molecular specificity in various application fields. However, fluorescence imaging is limited in its capacity to provide chemical molecular structural information.
With their broad macromolecular and spatially resolved characterization features, infrared (IR) and Raman spectroscopy and imaging systems are well-established approaches in life science research.
They have been used in various application areas, such as the study of the biochemical environment of individual cells, the observation of how cells react to drugs, and process and quality control in the pharmaceutical industry.
For life research, traditional IR has a restricted spatial resolution. Fluorescence interference limits the use of Raman spectroscopy in conjunction with fluorescence microscopy.
Many of the fundamental limitations of conventional IR for life science applications have been overcome by O-PTIR spectroscopy, which also offers excellent complementarity with Raman spectroscopy and is now fully integrated with fluorescence microscopy.
This article highlights several high-value life science applications and presents the unique O-PTIR technology and its integration with Raman and fluorescence techniques for life science applications.
Novel IR Technique for Raman and Infrared Spectroscopy and Imaging
While current conventional IR and Raman spectroscopy methods have beneficial aspects, they also have several drawbacks that prevent them from being widely used in mainstream life science research.
Major limitations of IR spectroscopy include its low spatial resolution (10-20 micrometers), strong water absorbances limiting live cell analysis, and spectral distortions (Mie scattering), which frequently depend on sample morphology, in addition to their chemistry.
Even though Raman spectroscopy is water-compatible and has an excellent spatial resolution (<1 micron), it often suffers from autofluorescence issues which can mask the weak Raman signal.
Raman is a weak phenomenon as it frequently suffers from a low signal-to-noise ratio, requiring long measurement durations.
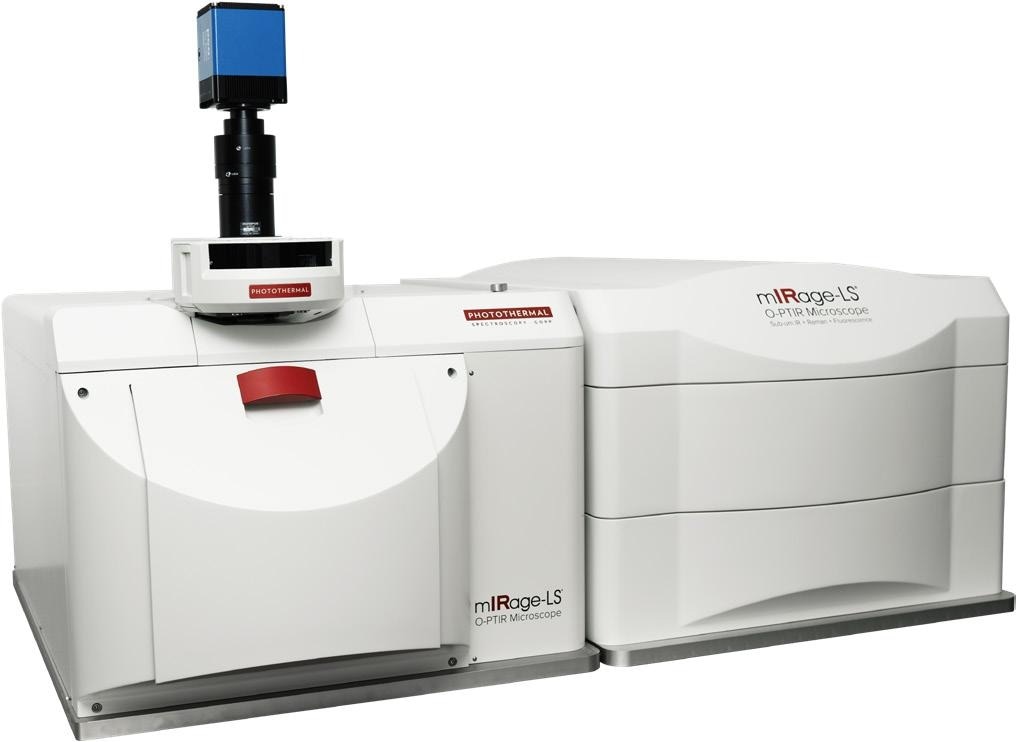
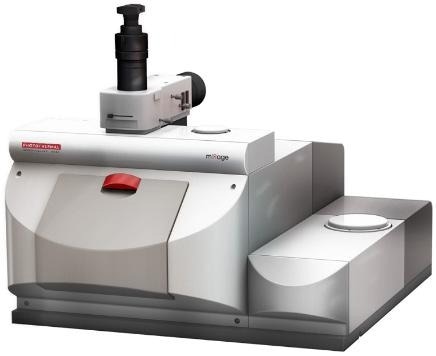
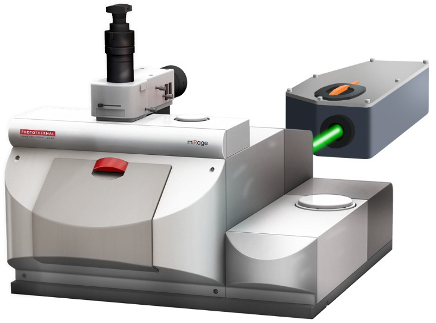
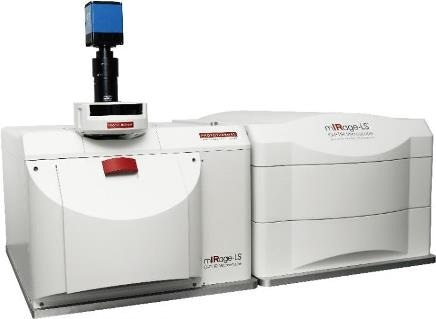
Figure 1. The mIRage-LS Sub-500nm IR multimodal microscope. Image Credit: Photothermal Spectroscopy Corp
With the recent introduction of O-PTIR spectroscopy with simultaneous Raman capabilities, conventional IR and Raman spectroscopy issues have been resolved. O-PTIR can now deliver submicrometer IR spatial resolution, without scattering artifacts, and is water-compatible with the ability to deliver IR and Raman spectroscopy simultaneously, providing the same spatial resolution from the same spot and the same time.
This makes it possible to utilize the real chemical complementarities of IR and Raman synergistically for the first time. These methods provide sub-cellular resolution combined with Raman and fluorescence imaging resolution, and can deliver broad macromolecular characterization on biologically relevant spatial scales (<500 nm).
For the first time, the incorporation of widefield epi-fluorescence imaging into this submicrometer simultaneous IR+Raman platform with the mIRage-LS product enables a sample registration free combination of these methods into a single instrument, heralding an advancement in life science research.
This novel product allows researchers to truly exploit these two techniques with potent synergy, accessing additional information and insights not available with either technique on its own while validating existing life science workflows.
Including the new counter-propagating mode, improves IR spatial resolution even further, opening up new applications for O-PTIR spectroscopy.
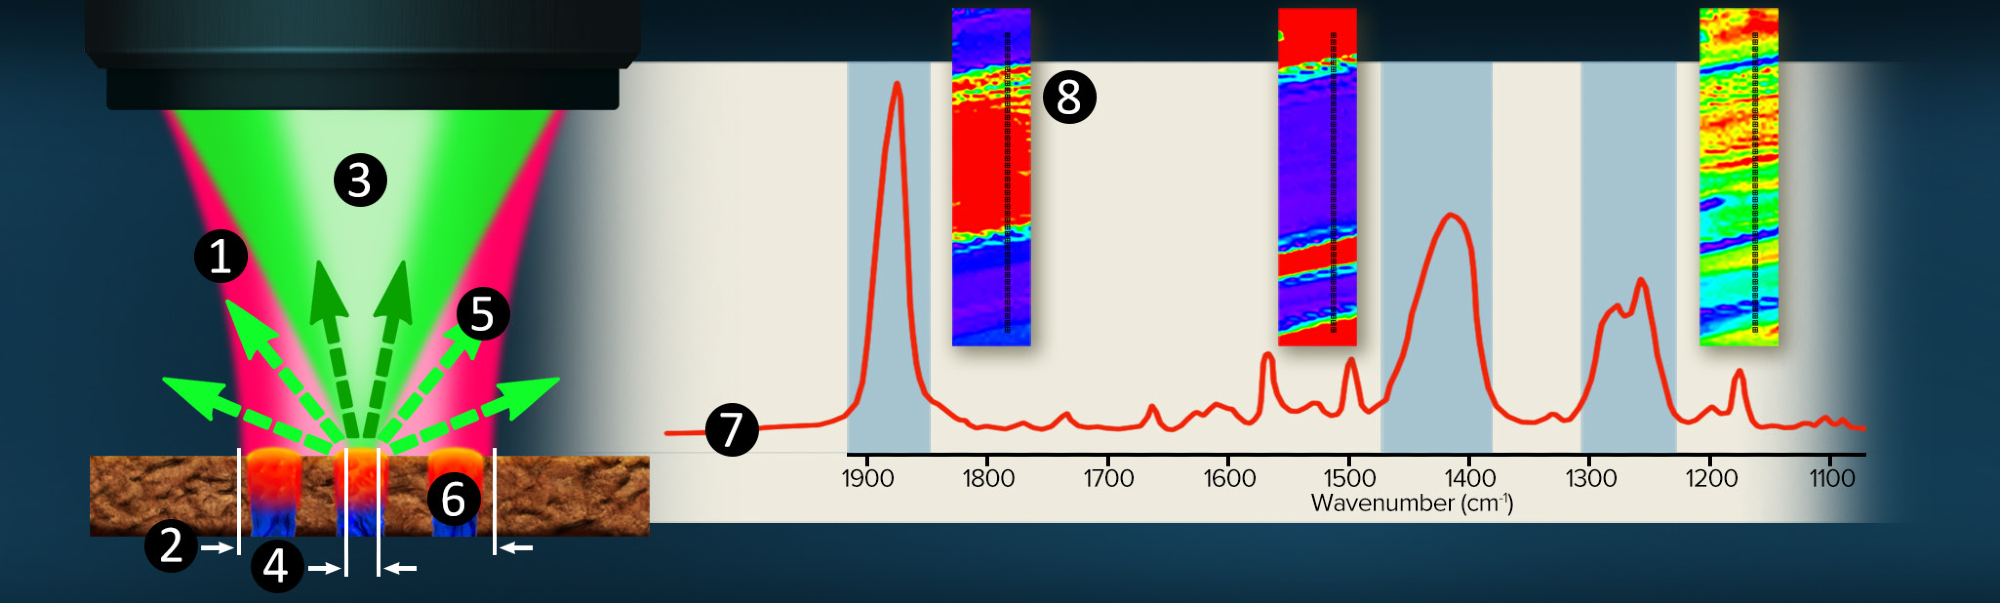
Figure 2. O-PTIR Co-propagating technique overview. Image Credit: Photothermal Spectroscopy Corp
Breaking the IR Spatial Resolution Barrier with O-PTIR
With the advent of O-PTIR microspectroscopy, the 10-20 micrometer spatial resolution limitation of infrared spectroscopy has been removed, enabling IR to be used for sub-micrometer spatial resolution, high-resolution (<500nm) chemical structural imaging, and cellular and sub-cellular structures spectroscopy.
O-PTIR Reflection Mode Co-Propagating Technique
The technique is illustrated in figure 2.
- A pulsed, tunable, infrared laser source (pump) is focused through a reflective (Cassegrain) objective.
- The infrared beam is focused to 10-20 µm (diffraction limited spot)
- A co-linearly introduced visible laser, typically a 532 nm green Raman excitation laser (probe), is focused through the same objective.
- The shorter wavelength green laser can be focussed to 30x tigher spot at around 500nm, allowing it to solely focuses on the blue region.
- As a function of IR laser wavelength adjustment, the green reflected (or transmitted) laser is detected.
- When the infrared wavelength overlaps an absorption band in the sample, energy is absorbed, resulting in a photothermal response and a change in the green reflectivity.
- Simultaneously monitoring the green laser reflectivity whilst tuning the IR source wavelenghts creates an infrared spectral response.
- Fixed frequency imaging or hyperspectral data sets are accessible for mapping chemical functional group distributions.
With submicron IR spatial resolution, infrared spectra are recorded by indirectly by detecting a reflected (or transmitted) 532 nm visible laser. High quality (SNR) IR spectra can be collected in a few seconds.
O-PTIR Counter Propagating Technique
Figure 3 illustrates the inclusion of a new high spatial resolution IR mode known as “counter-propagating”, another significant advancement with the mIRage-LS platform. Using regular high-power glass objectives as the probe delivery and collection optic is the key enabler of increased spatial resolution.
In contrast to the “co-propagating” mode, where the IR pump and visible probe beam are focused using all-reflective Cassegrain optics, the two beams are separated, with the IR beam being directed via the sample’s underside. This enables the use of high-power glass objectives for the delivery and collection of the probe beam.
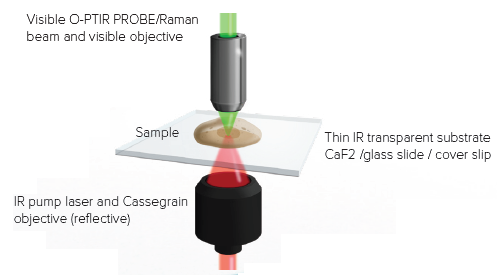
Figure 3. Counter propagating mode. IR light arrives from the bottom and the probe laser measures the sample response from the top with a high NA visible objective. Image Credit: Photothermal Spectroscopy Corp
The counter-propagating approach keeps all of the benefits of O-PTIR while significantly increasing spatial resolution and experimental versatility, with the ability to utilize water-dipping and oil-immersion objectives. Figure 4 depicts some of these novel forms of functioning.
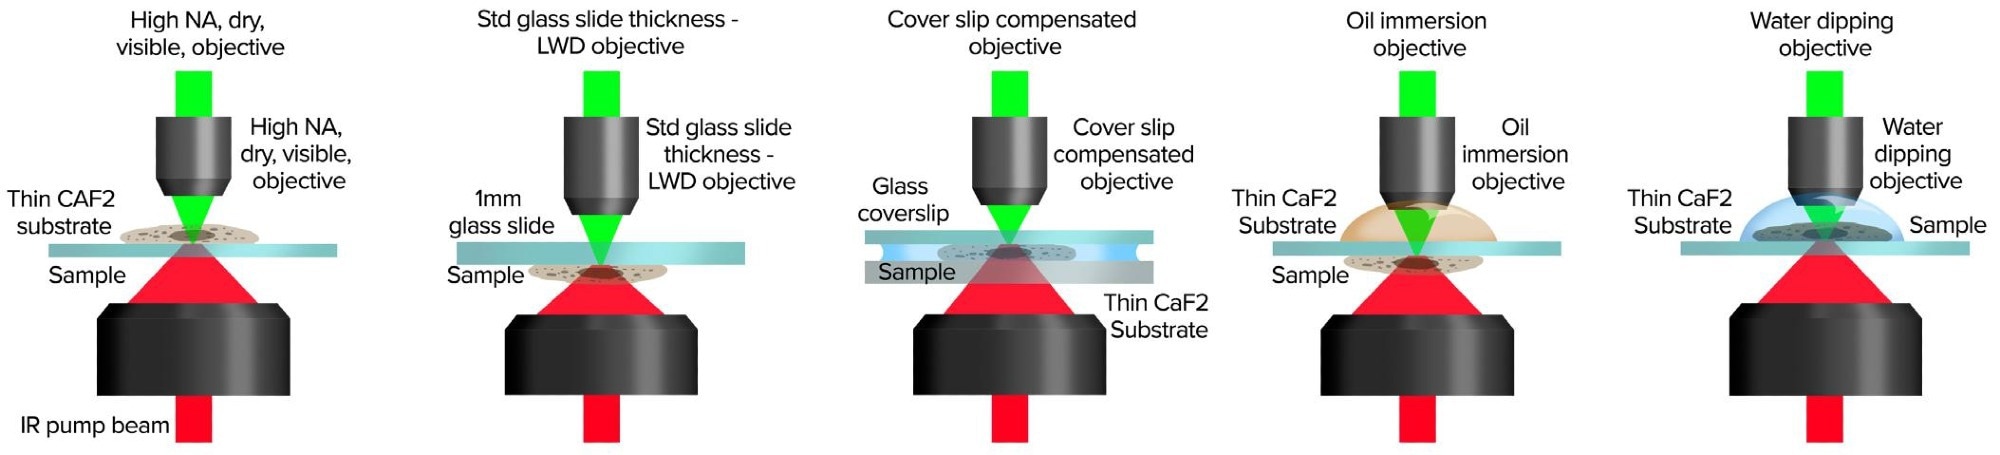
Figure 4. Counter-propagating mode provides application flexibility with a wide range of set ups for sample presentation. Image Credit: Photothermal Spectroscopy Corp
Simultaneous Raman/O-PTIR Principle of Operation
The mIRage-unique LS's idea and design, as shown in figure 5, allows Raman and O-PTIR to operate simultaneously on the same region on the sample, with identical spatial resolution.
Researchers can use the complementary nature of both approaches and provide a confirmatory spectral information for more precise results with these simultaneous measurement capabilities.
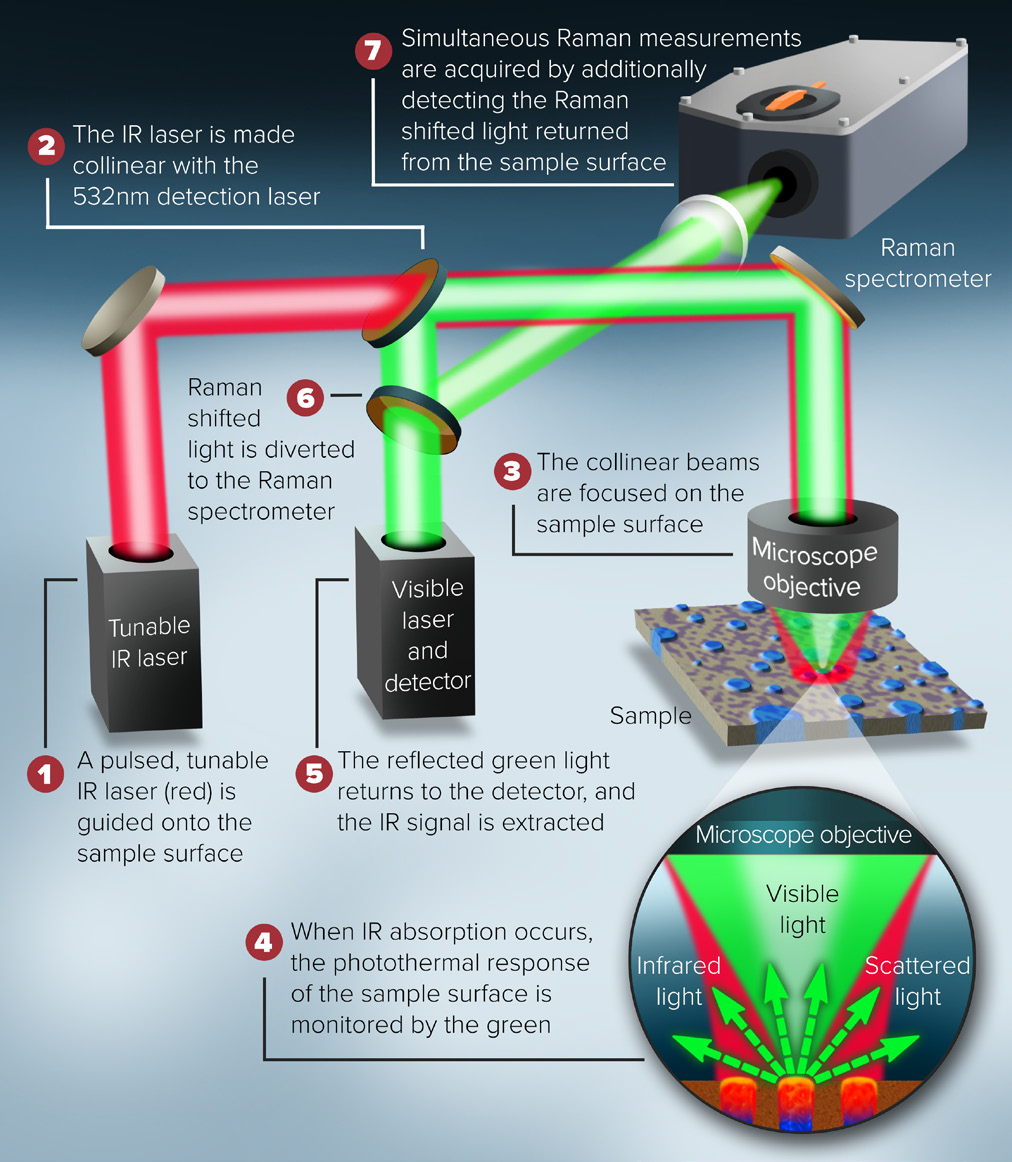
Figure 5. Schematic description of the combined O-PTIR and Raman instrument. Image Credit: Photothermal Spectroscopy Corp
mIRage LS Principle of Operation O-PTIR and Fluorescence Microscopy
Figure 6 depicts the system configuration for a combined O-PTIR sub-micron IR microscope, co-located with fluorescence microscopy. The pulsed IR beam is focused on the sample’s underside in counter-propagating mode. The fluorescence and visible probe beam paths are co-linear via the microscope objective enabling co-located measurements.
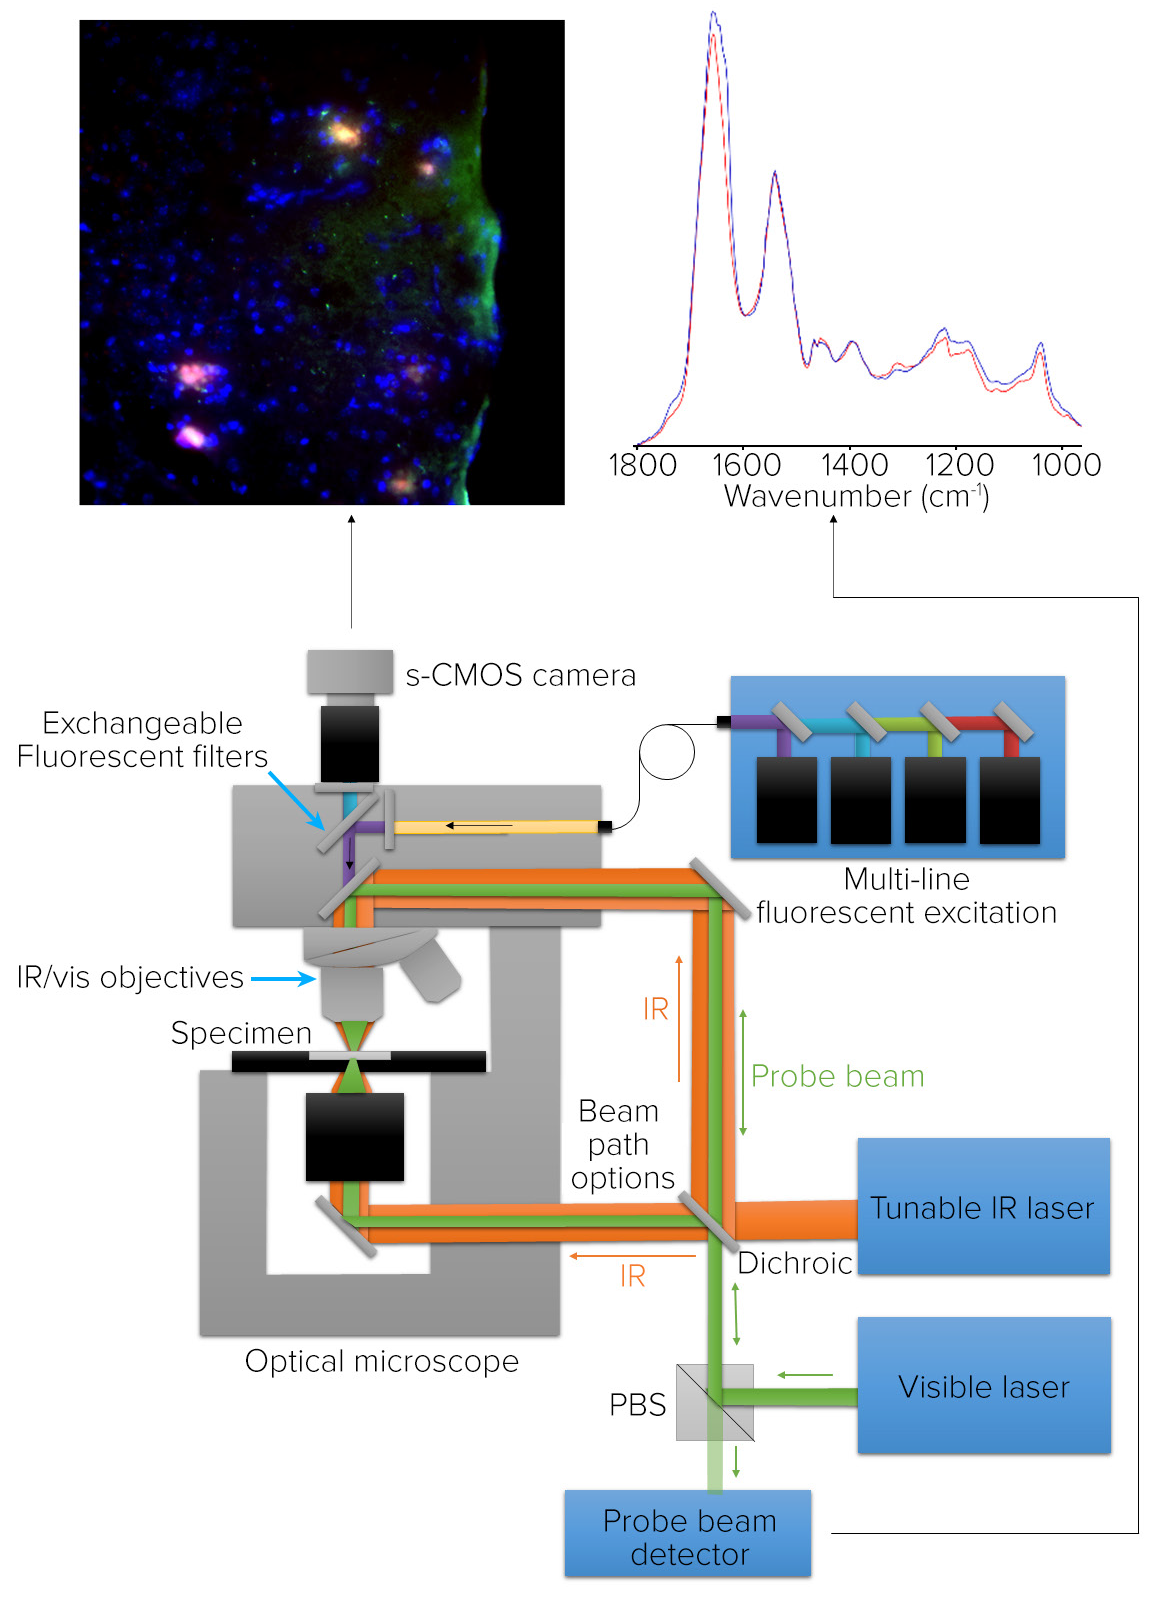
Figure 6. Microscope schematic for O-PTIR and co-located fluorescence microscopy. Image Credit: Photothermal Spectroscopy Corp
O-PTIR uses high-resolution IR spectroscopy and imaging to quantify the same properties that the fluorescence microscope uses to identify biomolecules of interest with high molecular specificity.
To accommodate a variety of fluorescence applications, the fluorescence camera has an illumination component with a brightfield filter cube and a capacity for seven other filter cubes.
Cellular, Protein, and Tissue Applications with O-PTIR and Combined Techniques
Neuroglioma Cells Characterization Using Counter-Propagating Mode
Figure 7 depicts the staining of neuroglioma cells with G3BP1 for protein stress granules, DAPI for nuclei, and BODIPY for lipids.
An RBG overlay widefield epifluorescence image with red displaying protein stress granules, blue revealing nucleus, and green indicating lipids is shown on the left. Square markers show O-PTIR spectral collecting sites. The brightfield image is located in the right.
The O-PTIR spectra, collected in a few seconds from the marker locations depicted in the left and right panes, are located at the bottom. It is possible to observe distinct spectrum changes compatible with the intended sub-cellular properties. The slight variation in the Amide I band of the protein stress granule, which indicates a distinct protein secondary structure from the other locations, is particularly noteworthy.
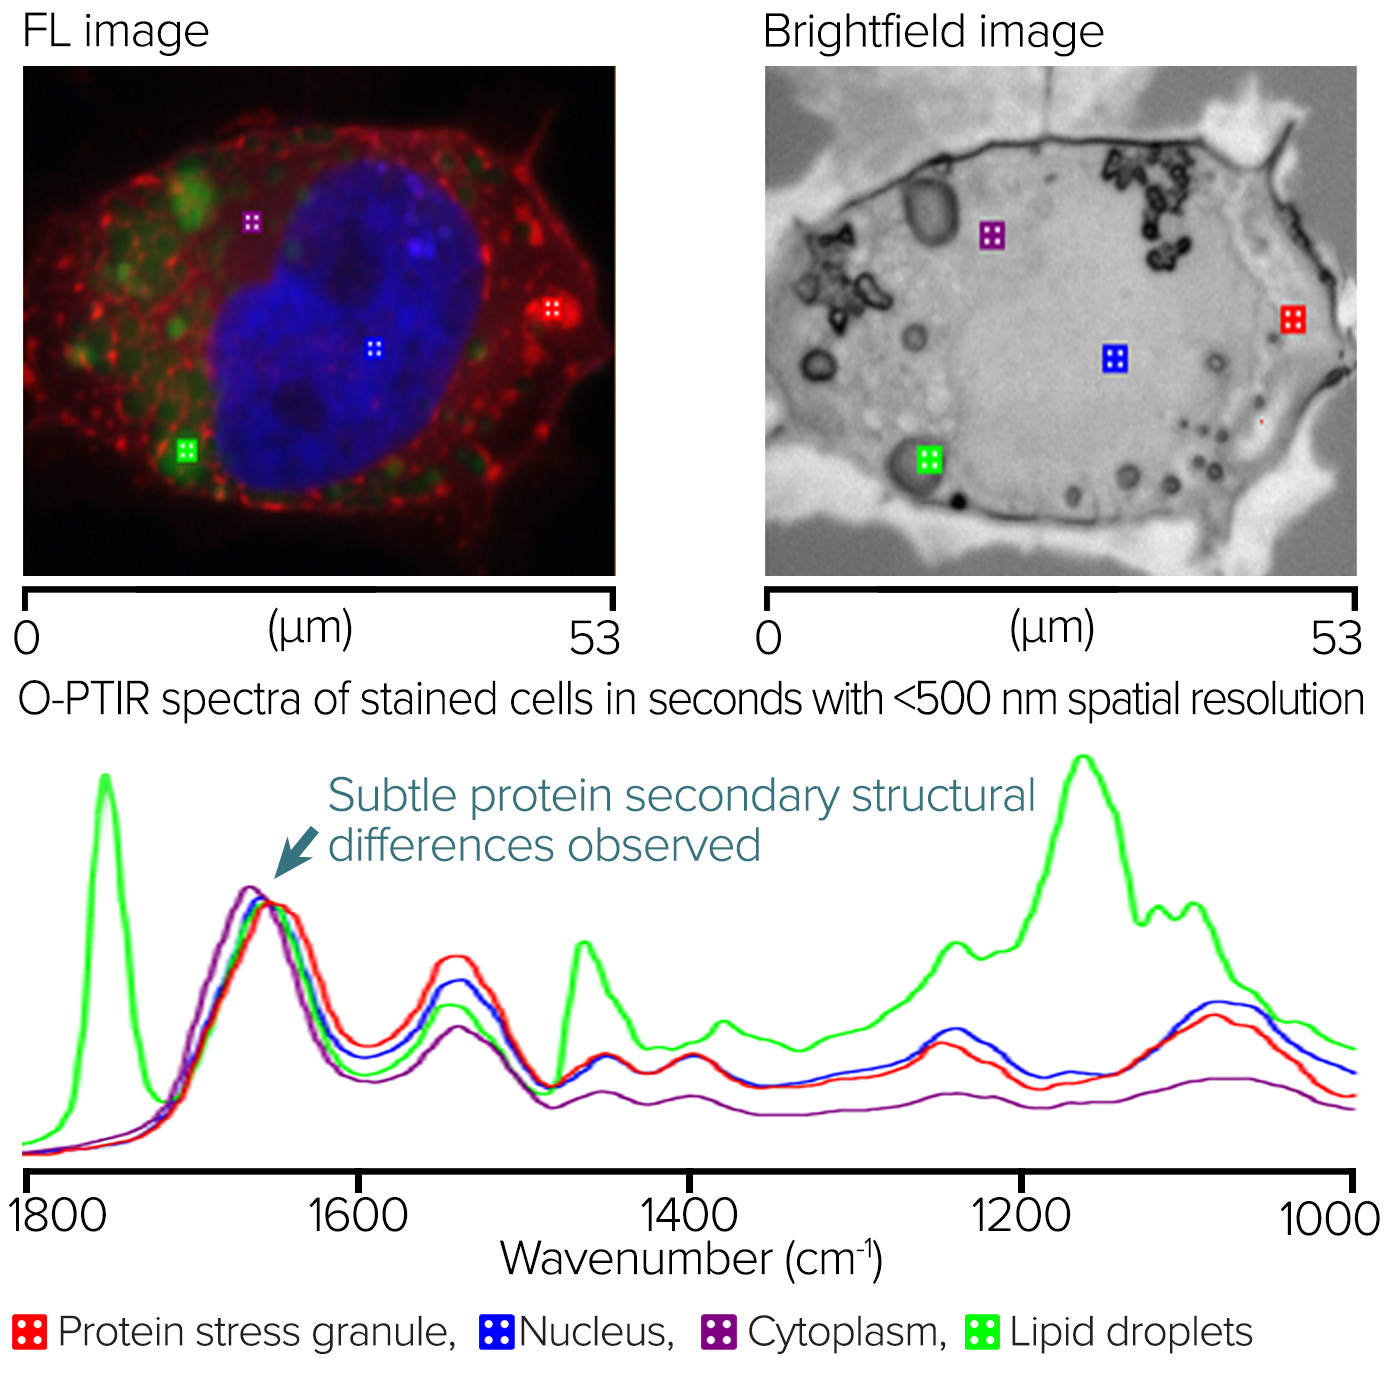
Figure 7. Fluorescence-guided Stained Neuroglioma cells and corresponding O-PTIR spectra. Image Credit: Photothermal Spectroscopy Corp
Blood Cells – Monolayer Measurement Using IR + Raman
Figure 8 depicts an IR + Raman study of a monolayer of red blood cells collected in co-propagating mode from the surface of a glass microscope slide. The left pane image displays an optical image of a 70 µm x 70 µm region from which a Raman image was collected, with a false color displayed at 1583 cm-1 using 532 nm excitation.
The bottom O-PTIR and Raman spectra on the bottom were acquired from a selected red blood cell (sub-micrometer resolution). This example significantly demonstrates the complementarity of IR and Raman spectroscopy. The hemoglobin protein bands dominate the O-PTIR spectrum, while the heme group’s resonance-enhanced porphyrin ring vibrations dominate the Raman spectrum.
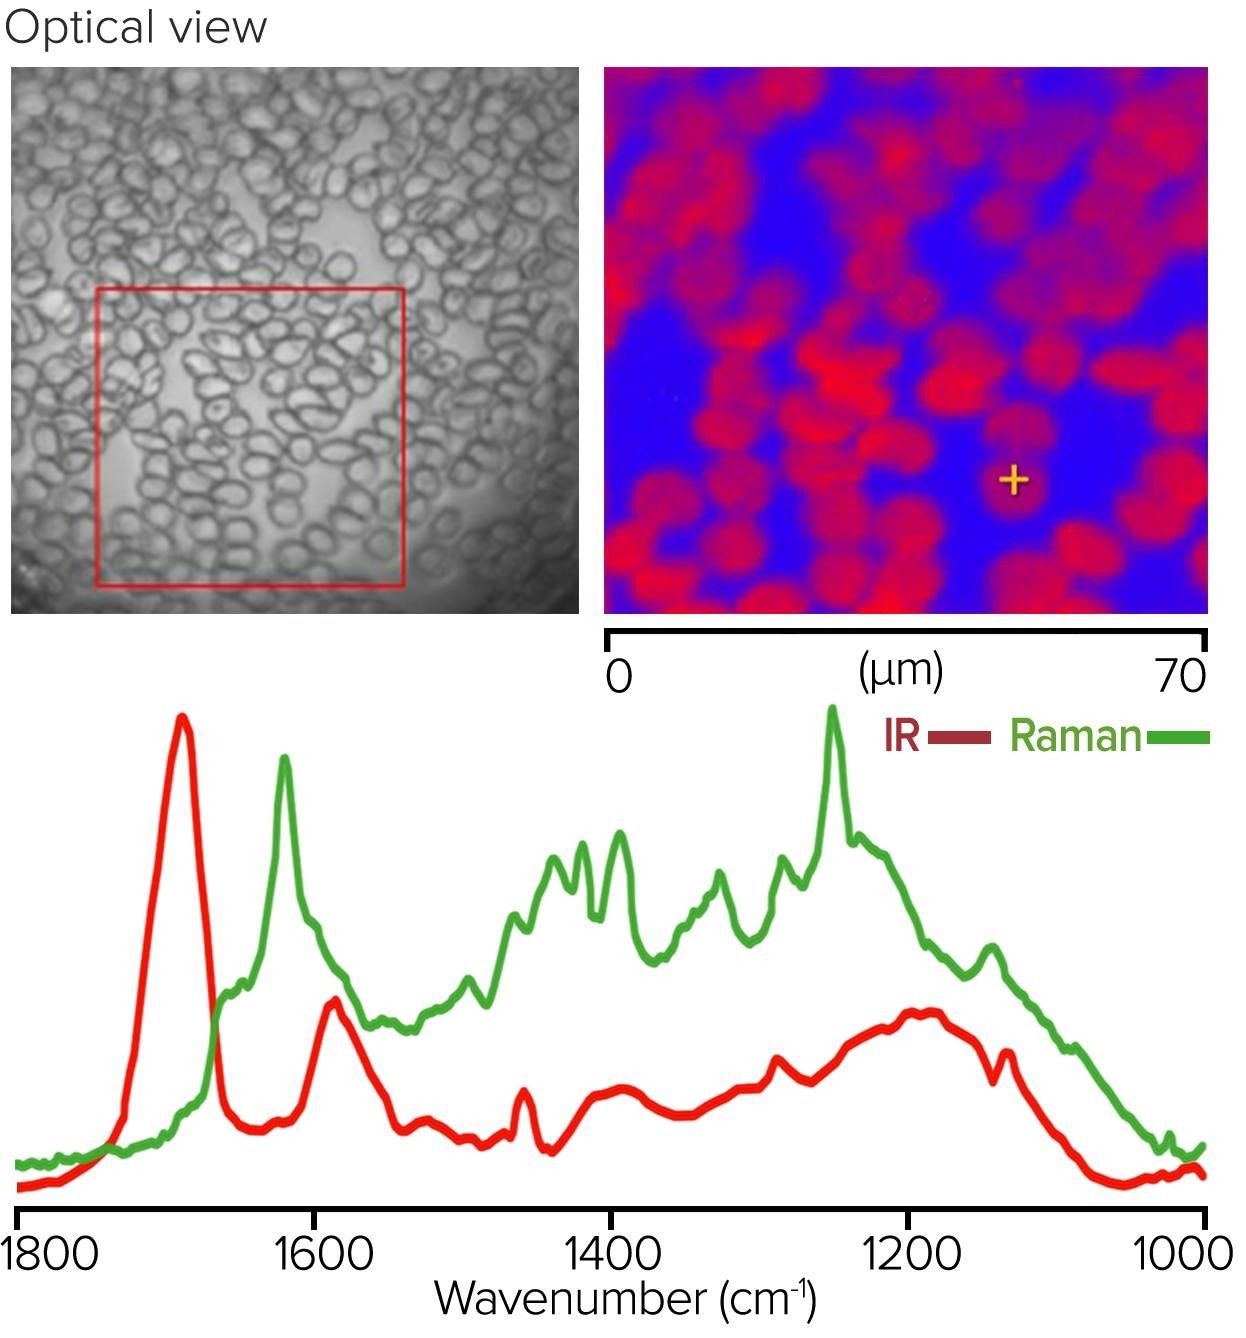
Figure 8. Monolayer of red blood cells, with Raman image and corresponding O-PTIR and Raman spectra. Image Credit: Photothermal Spectroscopy Corp
Tissue Measurement with O-PTIR and Co-Located Fluorescence Microscopy
In a mouse model of Alzheimer's disease brain tissue slice, Amytracker 630 was used to identify the amyloid aggregates, AF488 was used to highlight proteins, and DAPI was used to identify the nucleus.
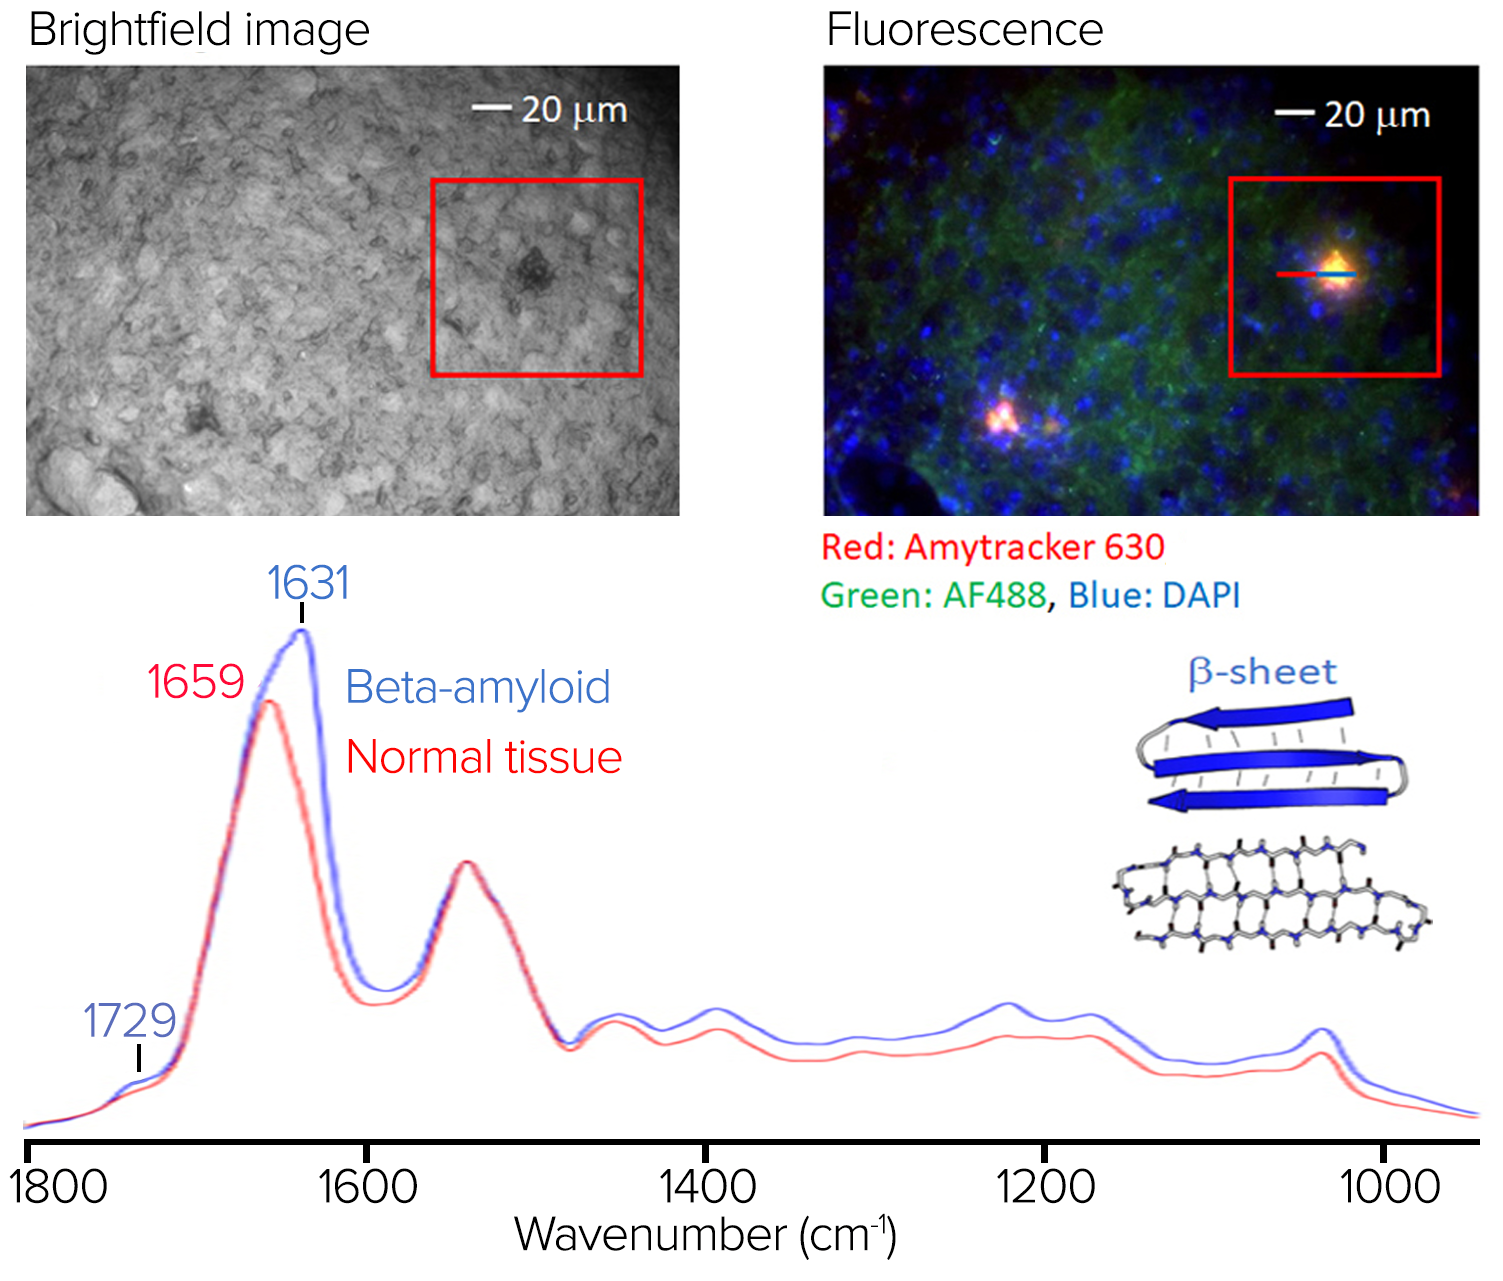
Figure 9. Stained tissue sample with fluorescence image and spectra showing significant spectral differences at 1631 cm-1. Image Credit: Photothermal Spectroscopy Corp
The top left of figure 9 depicts a brightfield image of the stained sample.
Figure 9 displays the RBG composite fluorescence image, which reveals amyloid aggregation in red/orange regions. Some amyloid aggregates identified in the fluorescence image are challenging to discern in the brightfield image.
The O-PTIR spectra averaged on (in blue) and off (in red) the aggregate are shown in figure 9, from the line profile indicated in the right pane. In the amide I band, where protein beta-sheet structures are characteristic, the aggregate's average spectrum exhibits various spectral variances and a prominent spectral signature at 1631 cm-1.
This exemplifies the value of combining submicrometer O-PTIR spectroscopy, which can then provide the molecular compositional information, in this case, being particularly sensitive to protein secondary structure, a characteristic strength of IR spectroscopy with fluorescence imaging to highlight regions of amyloid aggregation, some of which cannot be readily seen in brightfield microscopy.
Saltwater Algae
Both brightfield and autofluorescence (Ex 650 nm, Em 690 nm) images were captured using a 50 x, 0.8 NA objective in epi-fluorescence mode. Figure 10 illustrates how autofluorescence can display a wealth of contrast correlating to known sub-cellular structures, while the brightfield image is relatively feature-free.
Owing to its better contrast than the brightfield image, this autofluorescence image was used to direct the subsequent submicrometer IR and simultaneous Raman observations.
Despite the Raman signals being entirely overwhelmed by the sample’s autofluorescence, high-quality IR spectra devoid of any dispersive scattering artifacts (typical of direct IR methods such as FT-IR and QCL microscopy) could be produced in seconds from ~500 nm spots on the samples.
A simple lipid-to-protein ratio image was acquired at 1743 cm-1 and 1655 cm-1 using single frequency imaging mode for the lipid and protein to further investigate the macromolecular distributions.
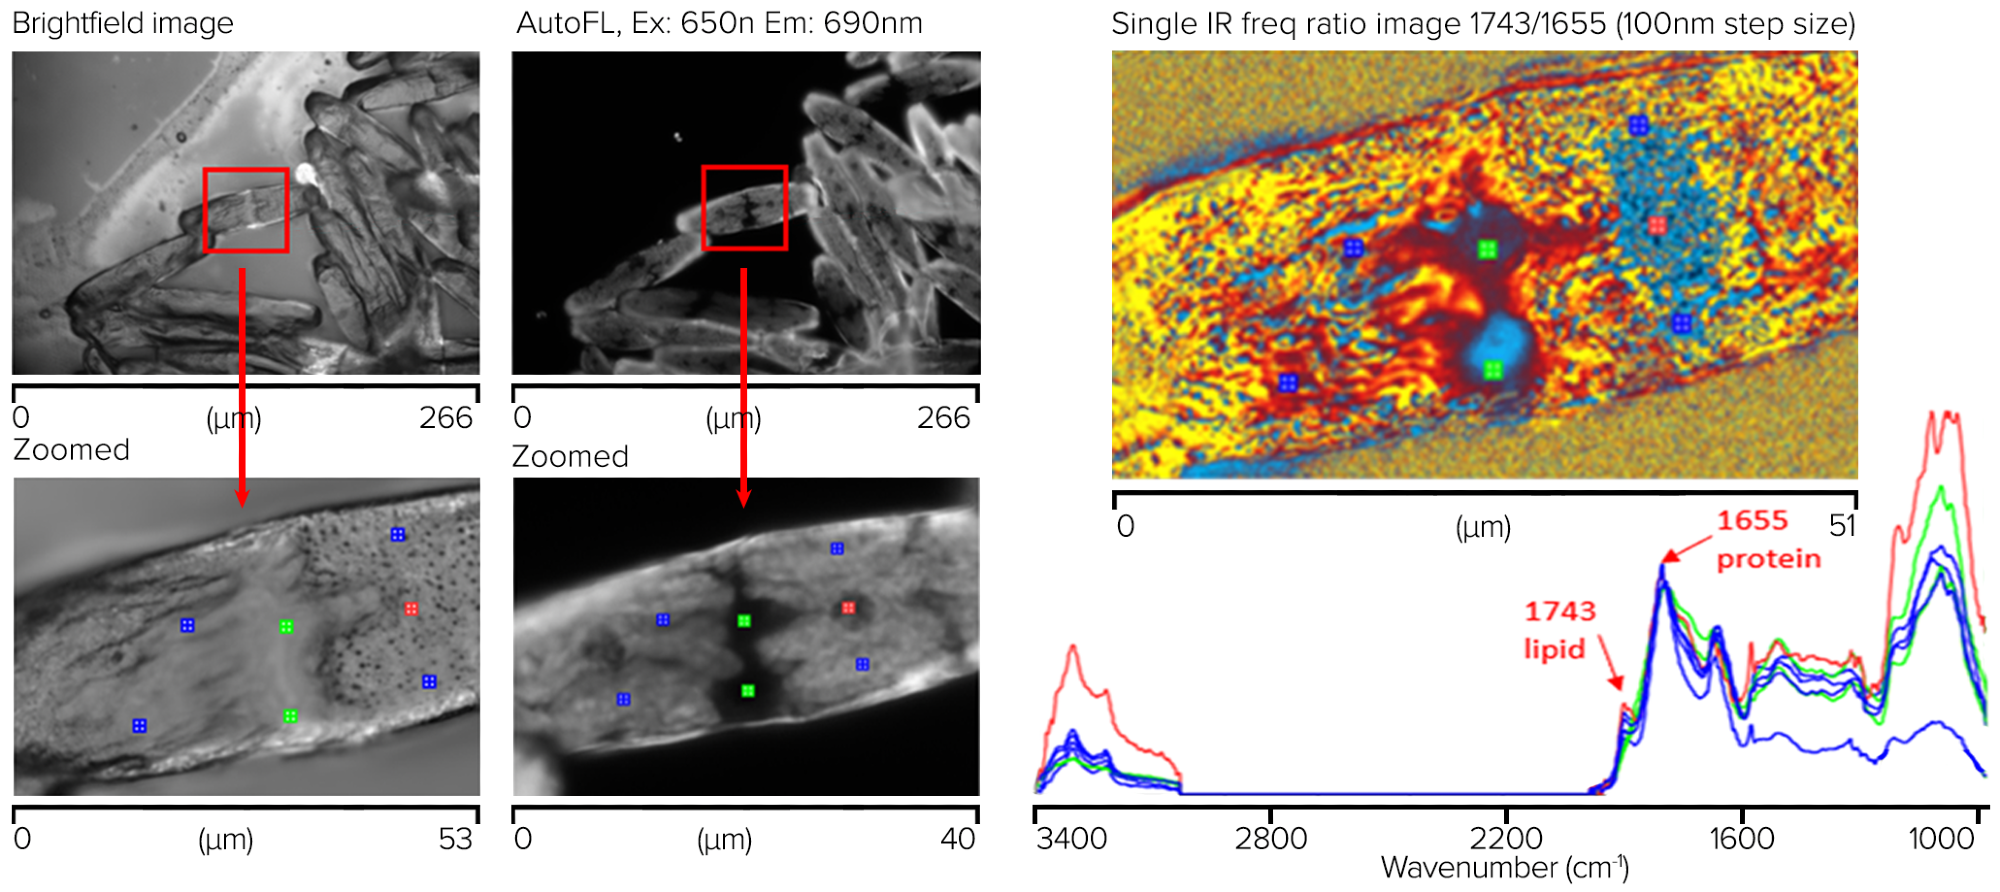
Figure 10. Saltwater algae sample showing measurement locations for corresponding spectra with chemical ratio image (1743/1655 cm-1). Image Credit: Photothermal Spectroscopy Corp
These results demonstrate the potential of this technique to investigate such samples for against external perturbations, such as nutrient depletion, changes in nutrients, and exposure to chemicals and drugs.
Single Bacterial Cell Using Simultaneous O-PTIR and Raman Spectroscopy
A single bacterial cell’s simultaneous O-PTIR and Raman spectra were acquired off a CaF2 substrate. On the top left of figure 11, there is a visible image of bacterial cells. The orange box shows where the single-wavenumber IR image at 1655 cm-1 and a 50 nm step size was taken, highlighting the absorption of protein components.
The bottom image displays simultaneous submicrometer O-PTIR and Raman spectra taken from a single spot on the single bacterial cell. O-PTIR spectra were acquired in a single unit, using a dual range QCL covering the 3000-2700 and 1800-950 cm-1 regions. The O-PTIR spectra were not post-processed, while the Raman spectra were baseline corrected.
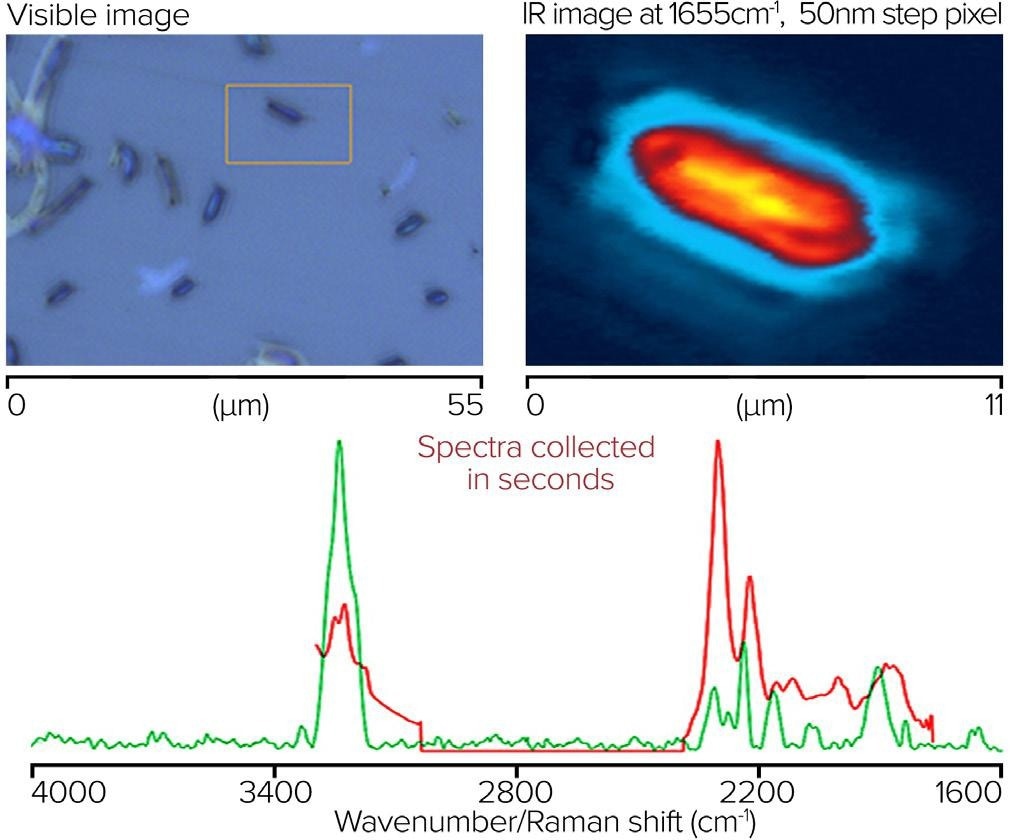
Figure 11. Single bacterial cell, with IR image and corresponding spectra from O-PTIR and Raman. Image Credit: Photothermal Spectroscopy Corp
Fixed Cell Measurement with Oil Immersion Objective
An oil-immersion objective (100x, 1.3 NA) was utilized in counter-propagating mode to measure IR spectral and images of a human cheek cell on an inverted glass coverslip to demonstrate the ultimate in optical and IR spatial resolution. Figure 12 illustrates how IR features as small as 285 nm can be observed in a rapid ultra-high-resolution image obtained by gathering molecularly specific single-frequency images, in this case at 1740 cm-1 for lipid.
Even though the sample was mounted on glass, spectra are not entirely obscured by glass, unlike conventional IR methods such as FTIR and QCL microscopy. Instead, a wide silicate feature from the glass is observed, overlaid by cellular nucleic acid and carbohydrate characteristics. At the same time, the protein and lipid regions remain entirely free of any glass contributions.
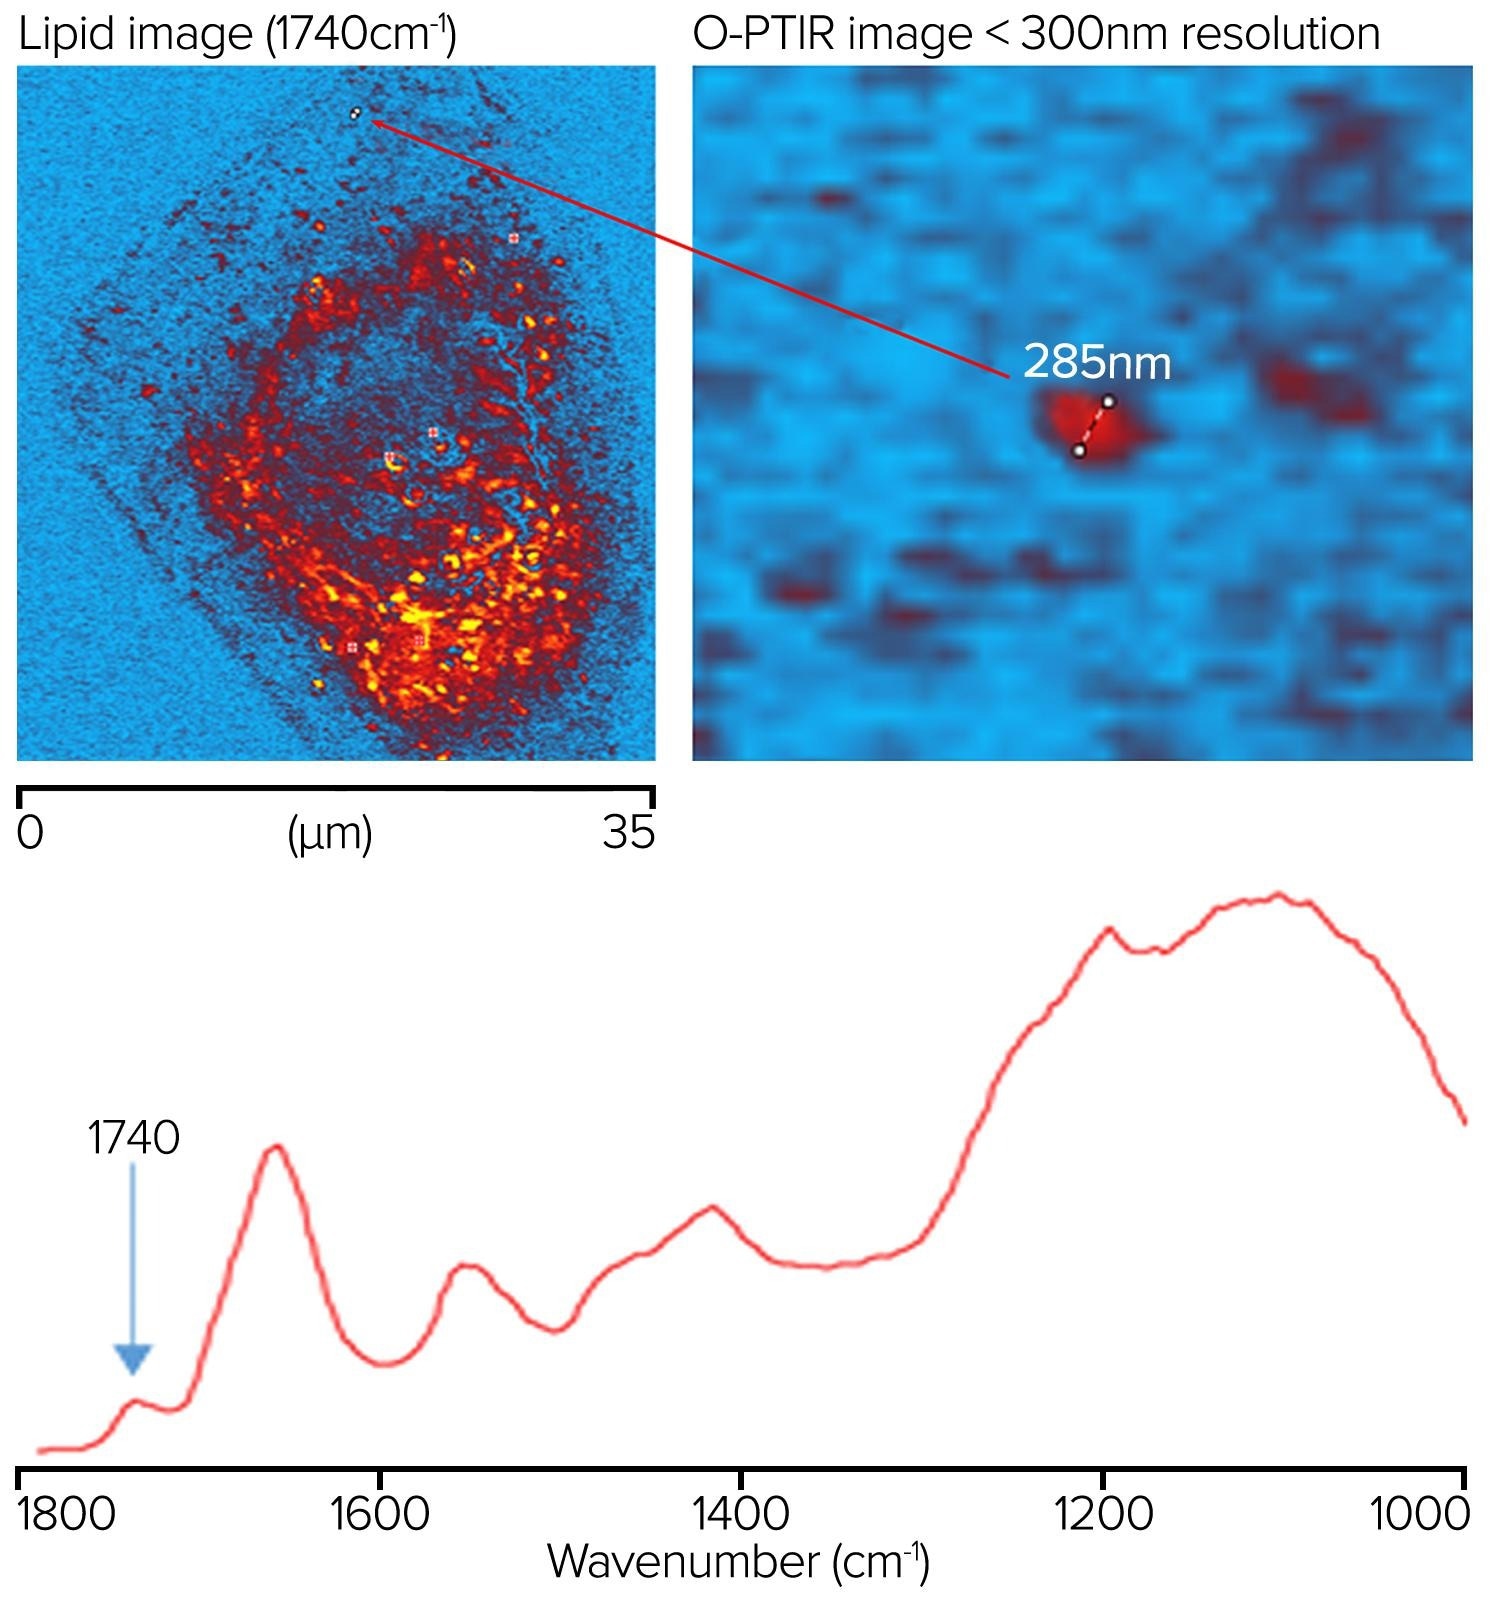
Figure 12. Lipid sample measured at 1740 cm-1 showing a feature resolution of <300 nm with O-PTIR imaging. Image Credit: Photothermal Spectroscopy Corp
Live Cells in Water with O-PTIR and Water Dipping Objective
Cheek cells were produced on a 300 µm-thick CaF2 substrate. A drop of water was placed on the sample, and a reflecting Cassegrainian objective was used from beneath to deliver the IR light, with a visible water dipping objective being used to deliver and collected the probe beam in counterpropagating mode (refer back to the right side of figure 4). A clear image of the sample is displayed on the top left of figure 13.
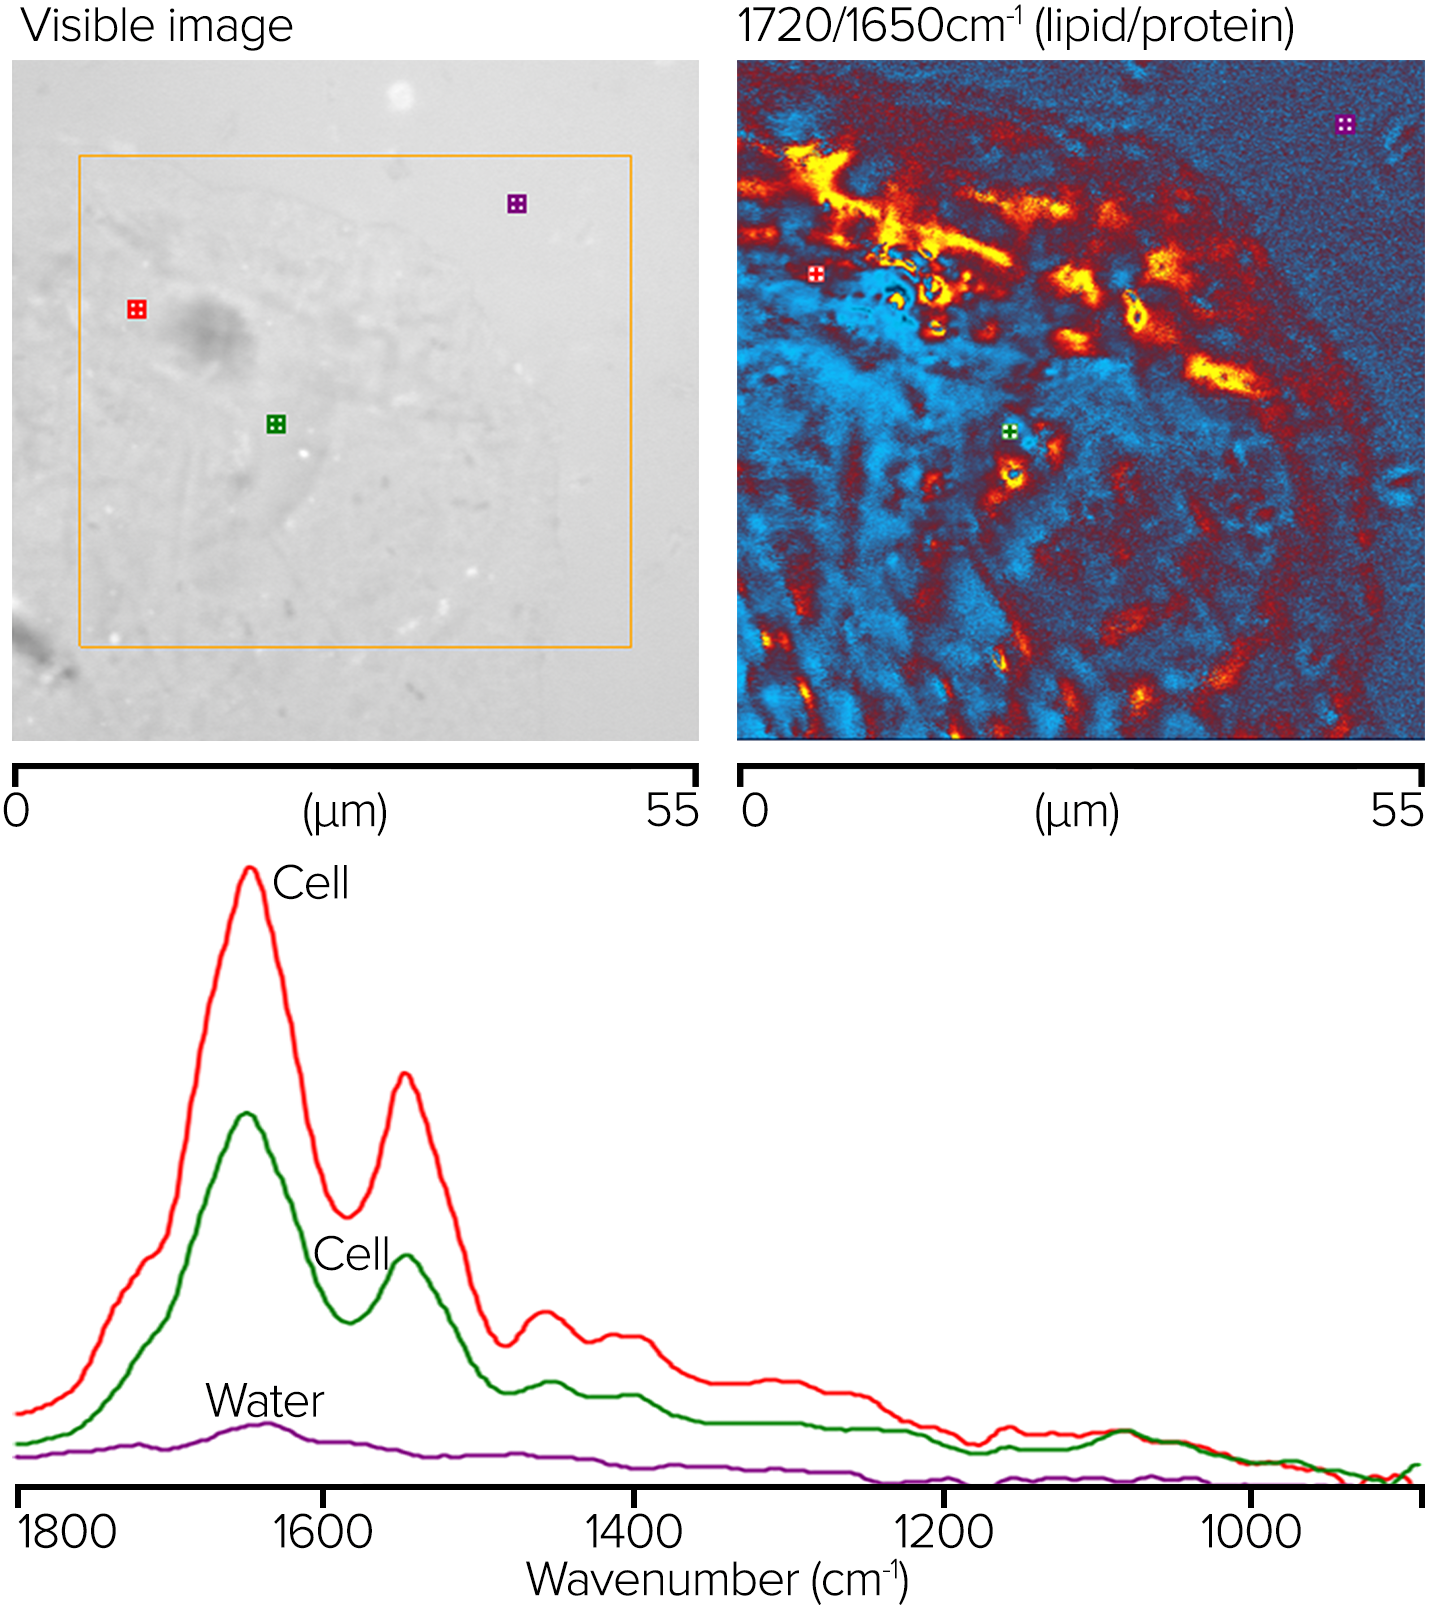
Figure 13. O-PTIR ratio image showing corresponding lipid/protein regions and measured spectra at noted locations. Image Credit: Photothermal Spectroscopy Corp
The orange box indicates the region where single-wavenumber O-PTIR images were acquired with 50 nm spacing at 1720 and 1650 cm-1. The top right corner shows a ratio of these two images. The ratio image's red/orange parts reflect areas with greater lipid concentrations, whereas the blue sections have higher protein concentrations.
The bottom graphic shows where single-point complete O-PTIR spectra and the appropriately colored spectra were acquired. Although no water background adjustment was used, the spectra show little to no water absorption.
Conclusion
This article demonstrates different life science applications of O-PTIR microspectroscopy and imaging integrated with simultaneous Raman and fluorescence measurements.
The mIRage-LS product incorporates the simultaneous measurement of submicrometer O-PTIR and Raman spectra with widefield epi-fluorescence imaging, heralding a breakthrough for life science research by enabling the sample-registration-free combination of these techniques into a single instrument.
This breakthrough allows researchers to exploit these two techniques with powerful synergy, accessing additional information and insights not obtainable with either technique alone while aligning with existing life science workflows.
mIRage Product Overview
mIRage® - Sub-micron IR spectroscopy. Image Credit: Photothermal Spectroscopy Corp
mIRage®-R - Simultaneous sub-micron IR and Raman spectroscopy. Image Credit: Photothermal Spectroscopy Corp
mIRage®-LS - New <500 nm IR with simultaneous Raman and co-located Fluorescence. Image Credit: Photothermal Spectroscopy Corp

This information has been sourced, reviewed and adapted from materials provided by Photothermal Spectroscopy Corp.
For more information on this source, please visit Photothermal Spectroscopy Corp.