As far as the biomedical, precision tools, aerospace industry, electronics, and environmental fields are concerned, the worldwide demand for ceramic materials with wide-ranging applications is rising. Sophisticated ceramics tend to extend the unique thermal, wear, and corrosion-resistant abilities of conventional ceramics by increasing toughness.

Image Credit: Bettersize Instruments
One of the primary techniques to enhance the mechanical properties is using high-purity and ultra-fine inorganic non-metallic powder as raw materials to improve the ceramic products’ microstructure.1
The ceramic powder’s particle size distribution (PSD) plays a crucial role in green strength, green density, and shrinkage, and impacts the performances of final products. Precisely regulating the PSD is indispensable for quality control.
Difficulties and requirements for ceramic powder quality control:
- During ceramic powder production, the product is continuously sampled and detected from lines to guarantee the stability of quality and save the measurement data for traceability. As a result of the huge number of samples, particle size measurement is laborious, and repetitive work increases the quality control cost.
- Adjusting the PSD by integrating the finer and coarser powder in some proportion is a common technique to increase the green density. The evenness of mixed powder will identify the success of sintering. A feasible technique is needed to track uniformity.
- Generally, the particle size of ultra-fine ceramic powder is submicron-scale. The conventional PSD measurement method, such as sieving, cannot quantify such fine powder. There are also difficulties regarding the analyzers’ performances in laser diffraction (LD) technology.
- During calcination and desiccation of ceramic powder, the fine ceramic particles tend to agglomerate. The existence of small amounts of oversized particles always turns out to be defects of products and decreases the product qualification rate. Finding them before use is crucial to quality control. However, the LD method does not enable displaying the images of oversized particles, and it is questionable if they exist.
- The Bettersizer S3 Plus integrates laser diffraction and dynamic image analysis in a single instrument. The laser diffraction system offers high accuracy, sensitivity, and resolution for even submicron-scale particle measurements.
The dynamic imaging system could envision the dispersion process, capture the images of oversized particles, and provide shape information to assist users in examining what happens to their powder products.

Figure 1. The Bettersizer S3 Plus, and BT-A60 autosampler. Image Credit: Bettersize Instruments
Case Study 1: Measuring the PSD of Alumina Powder Samples Automatically
In this case study, 60 alumina powder samples (five alumina powders with various PSDs, alumina A~E, each alumina powder was split into 12 samples) were quantified automatically in a single run by the Bettersizer S3 Plus and BT-A60 autosampler.
The BT-A60 is known as a high-throughput autosampler. Being compatible with the Bettersizer S3 Plus, it has the potential to offer completely automated sample analysis. Before measurements, the 60 powder samples were dispersed ultrasonically in aqueous solutions together with sodium metaphosphate in 60 sample tubes.
Every tube was joined with a bar code related to an SOP edited in advance and further saved in the software. When the measurement starts, the working process is:
- The BT-A60 scans the bar code, determines the sample, and chooses the SOP
- The sampling needle of the BT-A60 helps withdraw the suspension in the sample tube, injects it into the dispersion pool, and then executes the measurement
- The sampling needle is cleaned ultrasonically and made to proceed to the next measurement

Figure 2. The D10, D50 and D90 of the 60 samples (unit: um). Image Credit: Bettersize Instruments
Figure 2 displays the D10, D50, and D90 of the 60 alumina powders. Prior to the extraction of the suspension from sample tubes, suction and injection were automatically performed several times using the sampling needle to keep the suspension uniform.
The 12 samples of every alumina powder exhibit good reproducibility. The PSD outcome of each measurement was automatically saved in the software.

Figure 3. The PSD and cumulative curves of sample A, B, C, D, and E. Image Credit: Bettersize Instruments
Figure 3 displays the PSD and cumulative curves of five alumina powders. Alumina A, B, and C have comparatively narrower monodistribution and alumina D consists of a broader bimodal distribution. The various shapes of PSD curves denote their different preparation and processing techniques.
Table 1. The PSD of sample E. Source: Bettersize Instruments

The coarse particles’ content in fine powder is a significant indicator of the defects formed frequently by the coarse particles. Most coarse particles could be removed with correct processing methods, such as milling and sieving. The raw material used here is Alumina E which has not been sieved and milled. As per the cumulative content in Table 1, the volume percentage of particles over 45 µm in sample E is nearly 9%.
The usage of the Bettersizer S3 Plus and BT-A60 autosampler offers a highly automatic and comfortable method for particle size measurements of large numbers of samples.
Case Study 2: Determining the Uniformity of Alumina Powder
The poor uniformity of the ceramic powder has caused the low mechanical strength and nonuniform microstructure of the products. Several methods and mixers have been developed to achieve perfect mixing uniformity. Simultaneously, finding a simple technique to track the mixing effect is also necessary for quality control.
In this case study, two mixed ceramic powders were quantified. They were all generated by mixing a coarser alumina powder (D50 is about 3.0 µm) and a finer alumina powder (D50 is about 0.5 µm). The variation was that one was mixed by the wet method (with water) and one by the dry method (without water).
Before measurement, every mixed powder was sampled five times at various spots. The Bettersizer S3 Plus and BT-803 wet dispersion unit were utilized to quantify the particle size distribution of the 10 samples.
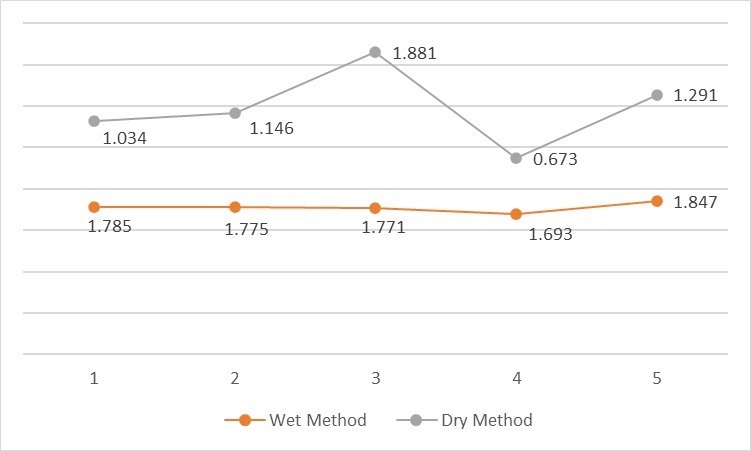
Figure 4. The D50 (µm) of the mixed alumina powders. Image Credit: Bettersize Instruments
The D50 of every sample of the mixed powders has been displayed in Figure 4. The D50 of the sample mixed by dry method displays a severe fluctuation, denoting that the proportions of the finer and the coarser particles have a great difference. The D50s of the wet mixed sample are highly consistent, denoting the fact that it has good uniformity.

Figure 5. The PDS curves of the dry mixed alumina powder and wet mixed alumina powder. Image Credit: Bettersize Instruments
From the PSD curves shown in Figure 5, it can be noted that the reproducibility of the dry mixed powder has been extremely poor. The dry mixed sample 3 consists of the most content of big particles than the other samples, whereas sample 4 has almost only small particles.
The PSD curves of the wet mixed powder have shown good consistency. The outstanding reproducibility denotes that the wet method might be highly suitable for blending such fine ceramic powders.
Case Study 3: The Detection of Alumina Agglomerates
Oversized particles in fine ceramic powder frequently denote quality degradation and changes in manufacturing and processing conditions. When oversized particles appear on the PSD curve variably, verifying their presence is essential.
In this context, the dynamic imaging system of the Bettersizer S3 Plus has utilized the detection of the agglomerates present in the ultrafine alumina powder to offer the images and shape information involved for analysis.

Figure 6. The PSD curves of Alumina powder. Image Credit: Bettersize Instruments
Figure 6 exhibits the PSD curves of two batches of alumina powder with a similar model. Compared to the reference batch, there are few oversized particles in the range of 6 µm to 20 µm in the abnormal batch.
It might be attributable to the agglomeration of ultra-fine alumina particles during the production process. To guarantee that the agglomerates are present, the measurement parameter was fixed to capture the particles ranging from 6 µm to 20 µm.

Figure 7. The images of oversized particles. Image Credit: Bettersize Instruments
High-speed CCD cameras captured images of oversized particles (Figure 7). The particle diameters were provided (the numbers above the images) via image analysis. With the help of the captured images, the presence of the oversized particles is verified.

Figure 8. The scatter plot of particles in the range of 6~20 µm. Image Credit: Bettersize Instruments
The particles present in the range of 6~20 µm were counted in the scatter plot, displayed in Figure 8. Integrating the images and the scatter plot of the aspect ratio, it is possible to quantify that the abnormal PSD curve has been caused due to the amounts of irregular alumina agglomerates.
The appearance of agglomerates might also show a few volatile factors in the manufacturing process that need to be checked and improved.
Conclusion
The Bettersizer S3 Plus and BT-A60 autosampler has the potential to offer ceramic powder producers and ceramic product manufacturers a highly automatic and time-saving technique for quantifying large numbers of samples.
The high performances and combination of dynamic image analysis allow the Bettersizer S3 Plus to be a trustworthy and strong tool for quality control at the time of any process of ceramic production.
Reference
- T. A. Otitoju, P. U. Okoye, G. Chen, Y. Li, M. O. Okoye, and S. Li, Advanced Ceramic Components: Materials, Fabrication, and Applications, Journal of Industrial and Engineering Chemistry, 2020, Volume 85, 34-65

This information has been sourced, reviewed and adapted from materials provided by Bettersize Instruments.
For more information on this source, please visit Bettersize Instruments.
