Polymers are a popular material for everyday objects and have many industrial applications, with their use increasing rapidly. However, for new polymers to be developed and commercialized is often a lengthy and costly process.
To satisfy the growing requirements for particular mechanical properties, processability, thermal stability, or chemical resistance, blending two or more polymers is a simple, cost-effective method to produce tailor-made material properties for applications that range from household products to automotive and even aerospace components.1
Dependent on the thermodynamic properties of their different chemical components, polymer blends are characterized by their phase structure on a molecular level either to be fully immiscible (heterogeneous, phase separation) or miscible (homogenous, single phase).
Various blend systems are only completely miscible in a limited temperature, concentration, and pressure range and can separate if these conditions are not satisfied. Both heterogenous and homogenous components are present and are regarded as partially miscible.2
Since polymer blends are categorized by phase structure, most characterization methods for such systems are associated with their glass transition.
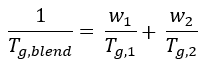
Single phase, miscible blends display a single glass transition temperature Tg,blend, which is usually between the glass transition temperatures of the components of the blend.3 This relationship can be explained by the Fox equation (1) for amorphous blends.4
 |
(1) |
In the Fox equation, w1 and w2 denote the weight fractions while Tg,1 and Tg,2 denote the glass transition temperatures of the separate components. The presence of a single Tg for polymer blend systems does not satisfy the thermodynamic criteria for miscibility.
Despite this, the presence of a single Tg for miscible polymer blends is well-documented within literature.1-3
For example, polycarbonate (PC) is an amorphous thermoplastic polymer, which has exceptional heat and impact resistance, transparency, and other properties. The key technical weaknesses of this polymer are scratch sensitivity and low chemical resistance.
Blending PC and polymethyl methacrylate (PMMA) improves these weaknesses. However, due to the immiscibility of commercially available transparent PC and PMMA grades at many blend ratios, opacity is typically seen as an undesired material property.5
Melt mixing with the use of twin-screw compounders is a popular technique for the preparation of polymer blends.3
Depending on the sample size and required throughput, various laboratory devices like small-scale twin-screw extruders, such as the Thermo ScientificTM Process 11 Parallel Twin-screw Extruder or the Thermo Scientific HAAKETM MiniLab 3 Micro-Compounder, are accessible for blend system development.
Dynamic Mechanical Thermal Analysis (DMTA) provides significantly increased sensitivity for determining glass transitions of polymers compared to alternative thermal analysis techniques such as Thermo-Mechanical Analysis (TMA) or Differential Scanning Calorimetry (DSC).6
This article evaluates the influence of various component ratios of binary PC/PMMA blend systems on the subsequent glass transitions obtained using DMTA. This provides insight into the phase structure present. This article focuses on physical mixtures; chemical mixtures of polymers, such as copolymers, are not within the scope of this article.
Materials and Methods
This investigation used commercially available PC and PMMA grades utilized for 3D printing applications. Different blend ratios of these materials were prepared, as shown in Table 1.
Table 1. Ratios of PC:PMMA blend systems used for this study. Source: Thermo Fisher Scientific – Materials & Structural Analysis
| Blend # |
PC / wt% |
PMMA / wt% |
| 1 |
60 |
40 |
| 2 |
50 |
50 |
| 3 |
40 |
60 |
The blend ratio of the neat component PC in X wt % to the neat component PMMA in Y wt % will be abbreviated as X:Y for the remainder of the article.
To guarantee a homogenous blend of the two components, the prepared systems were combined in a two-step procedure.
- The mechanical use of a blending machine
- 10 g of each polymer blend being input into the barrel of a HAAKE MiniLab 3 Micro-Compounder
Melt mixing was conducted at a temperature of 260 °C with a screw rotation speed of 50 rpm.
The micro-compounder was supplied with two pressure sensors and a bypass valve. To guarantee homogenous melt mixing, the polymer blend melts were mixed continuously utilizing a backflow capillary with a closed bypass valve.
The residence time for each blend system was modified according to the pressure difference.
Once the difference became constant or a five-minute residence time was attained, the bypass valve was opened and the melt was transported to an electrically heated injection cylinder of a HAAKE MiniJet pro Injection Molding Machine.
Following this, bars of 50 mm x 2 mm x 10 mm (length x width x thickness) were made. Neat component PC and PMMA reference samples were injection molded without further extrusion steps.
The temperatures of the mold and cylinder, in addition to the injection and holding pressures and their corresponding times, are all displayed in Table 2.
Table 2. Injection molding parameters for PC, PMMA and PC:PMMA blends. Source: Thermo Fisher Scientific – Materials & Structural Analysis
| PC:PMMA / wt% |
Cylinder temperature / °C |
Mold temperature / °C |
Injection pressure / bar |
Injection time / s |
Holding pressure / bar |
Holding time / s |
| 100:0 |
260 |
80 |
600 |
5 |
150 |
5 |
| 60:40 |
260 |
70 |
600 |
5 |
150 |
5 |
| 50:50 |
260 |
70 |
600 |
5 |
150 |
5 |
| 40:60 |
260 |
70 |
600 |
5 |
150 |
5 |
| 0:100 |
230 |
60 |
600 |
5 |
150 |
5 |
Dynamic Mechanical Thermal Analysis was carried out using a HAAKE MARSTM iQ Air Rheometer supplied with a temperature module (TM-CR-O450). All thermo-mechanical measurements were performed with the use of a solids clamping fixture. The temperature module in arrangement with the clamping fixture is shown in Figure 1.
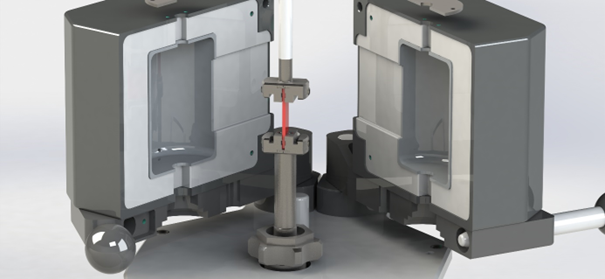
Figure 1. Temperature module TM-CR-O450 in combination with solids clamping fixture. Image Credit: Thermo Fisher Scientific – Materials & Structural Analysis
The test parameters were selected as an oscillation deformation amplitude γ0 of 0.04 % (within the viscoelastic range of the blend systems and their neat components) and a frequency f of 1 Hz. The temperature ramp varied from 30 °C to 200 °C, with a heating rate of 2 K/min.
To compensate thermal expansion, the normal force control of the rheometer was triggered and set to sustain a constant value of 0 N. Figure 2 displays the measurement routine of the HAAKE RheoWinTM Rheometer Control Software.
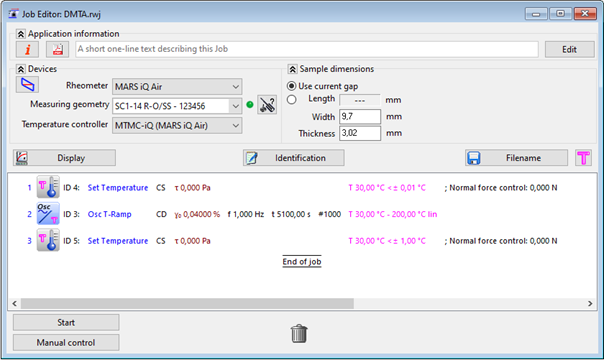
Figure 2. Measurement routine in HAAKE RheoWin Software. Image Credit: Thermo Fisher Scientific – Materials & Structural Analysis
Results & Discussion
Assessing the Thermo-Mechanical Properties Over a Broad Temperature Range
A material’s thermo-mechanical properties may be evaluated by applying a sinusoidal force or deflection to a solid sample while changing the experiment temperature. The numerous distinct physical states that an amorphous polymer undergoes with rising temperature obtained by torsional DMTA are displayed in Figure 3.
![Thermogram of an amorphous polymer and its various physical states with increasing temperature according to [7].](https://www.azom.com/images/Article_Images/ImageForArticle_22550_16789651012313316.png)
Figure 3. Thermogram of an amorphous polymer and its various physical states with increasing temperature according to [7]. Image Credit: Thermo Fisher Scientific – Materials & Structural Analysis
Polymer chains become progressively more mobile as the free volume grows with rising temperature.
Beyond a specific temperature, polymeric materials exhibit a phase transition from an inflexible and rigid glassy state into a flexible rubbery state before going into liquid flow. Observing the storage modulus G’ as a function of temperature provides an opportunity to distinguish the different physical states a polymer undergoes.
Commencing from a relatively constant storage modulus of ~109 Pa in the glassy state, the polymer grows more leathery as it begins its glass transition. Beyond the glass transition temperature, within the range of ~106 Pa, an amorphous polymer move into its rubbery plateau region and displays elastic behavior that is comparable to an elastomer.
The polymer still displays rubbery properties at even higher temperatures but also tends to flow and enter its rubbery flow regime. After this physical state, the polymer flows like a liquid.7
Various mechanical properties become evident, depending on the components in the tested material. The dependency of the storage modulus on the blend ratio PC:PMMA is shown in Figure 4.
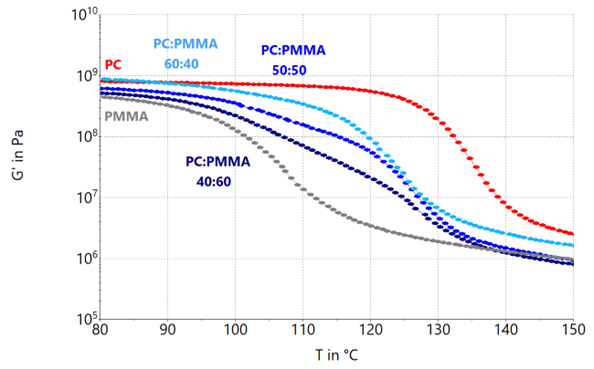
Figure 4. Storage modulus G’ of PC:PMMA blend systems with blend rations 60:40, 50:50 and 40:60 as well as their neat components. Image Credit: Thermo Fisher Scientific – Materials & Structural Analysis
All tested materials show a storage modulus in the range of ~109 at 80 °C, suggesting that they are in their glass region.
At approximately 115 °C, PC begins to soften and moves into its glass transition. For blends with a declining PC content, the commencement of glass transition moves considerably towards lower temperatures. Decreasing the PC content to less than 60 wt.% will reduce the strength of the resultant blend in the glassy region.
However, adding PMMA to PC widens the transition range for all blend systems. Subject to the final blend application, this influence must be considered.
The 40:60, in addition to the 50:50 blend system, exhibits a less steady transition, indicative of partial miscibility, which can be analyzed more efficiently using the loss factor tan(δ) or the loss modulus G’’.
At temperatures exceeding 130 °C, both blend systems exhibit a comparable rubbery plateau/flow regime, such as neat PMMA, while a 60:40 composition is closer to the properties of PC in its rubbery state.
Characterizing Miscibility of Polymer Blends by Their Glass Transition
A glass transition of polymers does not occur at one specific temperature but over a particular range of temperatures. Various evaluation methods, such as the maximum of G’’ or tan (δ), may be utilized to find a single reference value (Tg) as an indicator for the glass transition.
Further information concerning the evaluation of DMTA measurements can be found.7 The maximum tan (δ) glass transition evaluation technique was selected for this research.
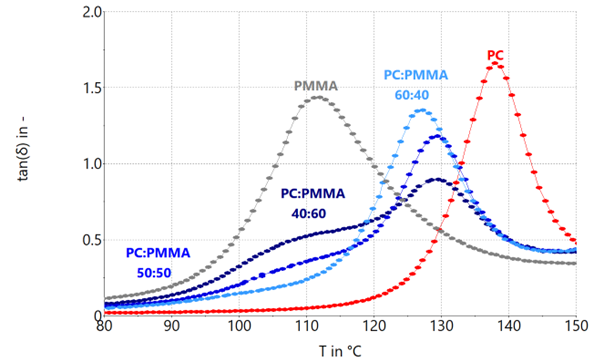
Figure 5. Loss factor tan (δ) of PC:PMMA blend systems with blend rations 60:40, 50:50 and 40:60 as well as their neat components. Image Credit: Thermo Fisher Scientific – Materials & Structural Analysis
Since the maximum in tan(δ) of the PMMA component in the 40:60 and the 50:50 ratio cannot be adequately determined, the inflection point was utilized to approximate this maximum. The attained values for Tg are shown in Table 3.
Table 3. Obtained glass transition temperatures for the neat PC and neat PMMA component as well as their respective blend systems. Source: Thermo Fisher Scientific – Materials & Structural Analysis
| PC:PMMA / wt% |
Tg,PC / °C |
Tg,PMMA / °C |
| 100:0 |
138 |
- |
| 60:40 |
127 |
| 50:50 |
129 |
110 |
| 40:60 |
128 |
110 |
| 0:100 |
- |
112 |
When combining two different polymers to acquire a binary blend, miscibility depends on the solubility of the dispersed phase within the matrix component.2
A single glass transition temperature may find a satisfactory solubility and, thereby, potential miscibility of the two components. This temperature would be located between the glass transition temperatures of the two neat components.
If a binary blend has the incidence of two glass transition temperatures equal to the neat components, the blend is considered immiscible. However, if the glass transition temperatures move towards each other but do not completely merge into one single temperature, the components are soluble to a certain extent and the blend system may be considered partially miscible.
For the PC:PMMA blend systems examined here, the glass transition temperature of the PMMA component for both the 40:60 and 50:50 blend ratios are not identified as a maximum, but instead as a shoulder within the range of the Tg of the neat PMMA.
However, the Tg of the PC:PMMA blend component can be found for all ratios.
Reducing the PMMA content from 60 wt % to 50 wt %, the shoulder becomes less prominent, but the point of inflection as a measure of Tg continues to be approximately 110 °C, which is typical for immiscibility.
A PC:PMMA blend ratio of 60:40 exhibits just one maximum in tan(δ) and seems fully miscible. One potential explanation may be that the PMMA in the PC:PMMA blend systems is only miscible up to a specific saturation concentration.
As previously discussed, miscible polymer blends follow the Fox equation (1). Regarding the 60:40 blend system, the theoretical glass transition temperature is 126°C. This is relatively close to the 127°C observed experimentally.
Microscopic analyses using transmission electron microscopy (TEM) may be utilized as a final proof of miscibility.
Miscibility may not always be a desirable property of polymer blends. In an immiscible phase structure, all characteristic properties of the blend components stay, but a miscible blend is characterized with intermediate properties of the neat components.
Immiscible structures tend to be weak at the interfacial boundaries in between the polymer components. This means that specific properties, such as mechanical strength, may be significantly limited.
Reactive extrusion or compatibilization may enhance the interfacial strength of blend systems by producing physical or chemical interphase connections between the blend partners.2
In addition to enhancing mechanical properties, optical properties may be improved, among other factors. For the PC:PMMA blend systems, the observed opacity for commercially available transparent PC and PMMA grades at most blend ratios may be overcome by utilizing reactive extrusion.5
Conclusion
In this article, miscibility of polymer blend systems was explained and DMTA as a thermo-mechanical method to scan for miscibility was described.
To compare with industry standards, PC:PMMA blends with differing blend ratios were compounded through melt mixing, and specimen required for thermo-mechanical analysis were produced using injection molding.
The storage modulus G’ was presented to distinguish the various physical states a polymer undergoes with rising temperatures.
Lastly, the maximum and shape of the loss factor tan(δ) curve was described as an evaluation technique for a characteristic glass transition temperature to characterize miscibility. The Fox equation was utilized to proof miscibility for a 60:40 PC:PMMA blend ratio.
Acknowledgments
Produced from materials originally authored by Philipp Beutler from Thermo Fisher Scientific Karlsruhe, Germany.
References and Further Reading
- Thomas, S., Grohens, Y., Jyotishkumar, P. – Characterization of Polymer Blends: Miscibility, Morphology, and Interfaces – 1st Edition (2015)
- Utracki, L. A., Wilkie, C. A. - Polymer Blends Handbook – 2nd Edition (2014)
- Robeson, L.M. – Polymer Blends – 1st Edition (2008)
- Fox, T., G. – Influence of Diluent and of Copolymer Composition on the Glass Temperature of a Polymer System – Bull. Am. Phys. Soc. 1, 123 (1956)
- Bubmann, T., et al. – Transparent PC/PMMA Blends with Enhanced Mechanical Properties via Reactive Compounding of Functionalized Polymers – Polymers, 14, 73 (2022)
- Menard, K. – Dynamic Mechanical Analysis – A practical introduction – 2nd Edition (2008)
- Menczel, J., D, Prime, R., B. – Thermal Analysis of Polymers - Fundamentals and Applications – 1st Edition (2009)
- Beutler, P. – V301 - Impact of irradiation time on reaction kinetics and thermo-mechanical properties of an UV light sensitive adhesive (2022)

This information has been sourced, reviewed and adapted from materials provided by Thermo Fisher Scientific – Materials Characterization.
For more information on this source, please visit Thermo Fisher Scientific – Materials Characterization.