The ability to understand and control the moisture sorption properties of pharmaceutical materials is vitally important. From excipients to drug formulations and packaging films, these properties are fundamental in determining the overall quality, stability, processing, and performance of pharmaceutical products.

Image Credit: Thirteen/Shutterstock.com
The effective control of water vapor or moisture is crucial in numerous pharmaceutical procedures, a fact acknowledged by experts and regulatory authorities such as the US Pharmacopeia.
The Dynamic Vapor Sorption (DVS) technique facilitates accurate and precise characterization of the water sorption properties of solid-state materials. The technique is pivotal in the development and quality control of pharmaceutical products for several key reasons:
Moisture Sensitivity: Many pharmaceuticals are moisture-sensitive, and even a small amount of moisture can lead to degradation, altered dissolution rates, or changes in physical properties. DVS instruments provide precise control over humidity levels, allowing researchers to determine how susceptible a material is to moisture absorption and desorption.
Formulation Development: The choice of solid-state forms (such as polymorphs, hydrates, or amorphous phases) can significantly impact a drug’s solubility, stability, and bioavailability. DVS enables investigations into how different forms of a drug interact with moisture or other vapors, helping to find the most stable and effective formulation.
Quality Control: DVS is an effective tool for quality control in pharmaceutical manufacturing. It allows the consistency of raw materials, intermediates, and final products to be assessed. Any deviations in sorption properties can indicate variations in material characteristics or processing conditions.
Storage and Packaging Optimization: Understanding the sorption behavior of a pharmaceutical material is essential if appropriate storage conditions and packaging are to be designed. DVS can simulate real-world conditions, enabling researchers to establish optimal storage parameters to ensure product stability and extend shelf life.
Patent Protection: Solid-state characterization, including sorption studies, can be essential in patent applications and litigation. Demonstrating a deep understanding of a drug’s physical properties and potential issues related to sorption can strengthen a company’s intellectual property position.
Safety and Efficacy: Changes in sorption properties can result in undesired changes to the safety and efficacy of pharmaceutical products. An example of this is where moisture-induced crystallization may result in inconsistent dosing or even render a product ineffective. By using DVS, pharmaceutical experts are able to spot possible issues early in the development process.
Cost Reduction: Precise understanding of sorption behavior can help to reduce costs associated with product recalls, failure, or suboptimal formulations. This proactive approach can save both time and resources in the long run.
Regulatory Compliance: Regulatory agencies, such as the FDA, require comprehensive data on the solid-state properties of pharmaceuticals. DVS experiments provide valuable data for regulatory submissions, helping to expedite approvals and ensure compliance with industry standards
This article discusses how the DVS technique is used by Surface Measurement Systems for several key applications related to excipients, drugs, and pharmaceutical ingredients.
Method
A schematic of the DVS-Resolution instrument is shown in Figure 1. The instrument uses the SMS UltraBalance to measure the uptake and loss of vapor gravimetrically, with a mass resolution of ±0.01 μg. The vapor partial pressure around the sample is generated using electronic mass flow controllers to mix dry and saturated carrier gas streams.
As well as controlling water vapor pressure (i.e., relative humidity), the DVS-Resolution instrument has the unique capability to actively measure and control the concentration of a variety of organic vapors.
This is accomplished utilizing a proprietary Speed of Sound sensor, which is calibrated specifically for a wide range of organic solvents. This technology enabled the instrument to measure and control water and organic vapor concentrations in real-time.
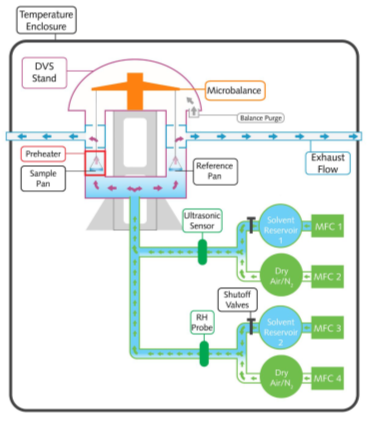
Figure 1. Schematic overview of the SMS DVS-Resolution instrument. Image Credit: Surface Measurement Systems Ltd
Moisture Content/Sorption Isotherm
The DVS family of instruments has been routinely used to determine moisture content isotherms. This is done by establishing an equilibrium by exposing the sample to a certain relative humidity for the required period.
This is subsequently repeated at numerous RH steps until a complete sorption and/or desorption isotherm has been established. Typical moisture sorption/desorption kinetics (a.) and isotherms (b.) for a generic starch sample are presented in Figure 2.
In contrast to the traditionally used desiccator jar method, the DVS allows for the continuous measurement of the sorption kinetics, from which moisture diffusion coefficients can be determined. The details of this process will be expanded on later.
The DVS also allows the sorption and desorption isotherms to be determined on the same sample, and moisture sorption hysteresis can therefore be measured.
Finally, because of the constant flux of (partially) humidified carrier gas, the DVS makes it possible to determine complete sorption/desorption isotherms in hours/days, as opposed to days/weeks/months for the desiccator jar method.
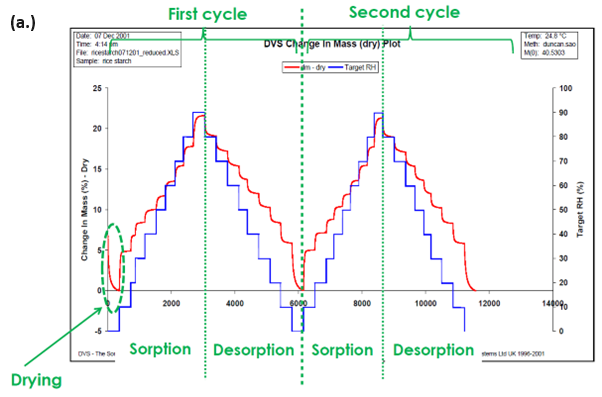
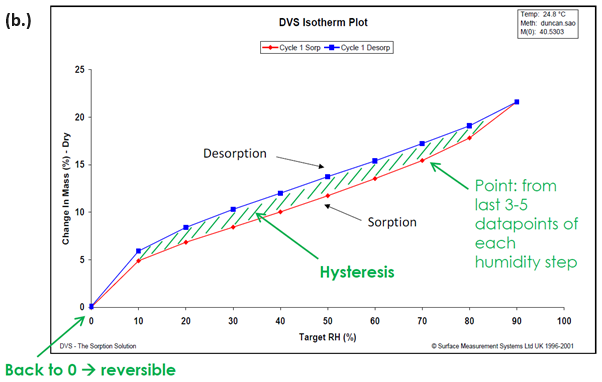
Figure 2. Moisture sorption kinetic (a.) and isotherm (b.) plots for starch at 25 °C. Image Credit: Surface Measurement Systems Ltd
Hygroscopicity of APIs
Measuring the ability of solids to take up water vapor from the atmosphere at a constant temperature with changes in RH is often referred to as a measure of hygroscopicity.
This measurement is now a standard preformulation activity to provide an early assessment of the potential effects of moisture on the chemical and physical properties of drug candidates.4
Hygroscopicity is also one of the primary criteria when it comes to selecting a form of drug crystal for development. Thus, water sorption data is often employed in the initial salt screening process to identify crystalline salt/neutral forms with ‘acceptable’ moisture stability.
How advantageous it is to classify hygroscopicity in terms of definitive sorption capacities is a matter of debate, but it has been attempted numerous times. It must also be noted that defining hygroscopicity is only the first step in evaluating the potential deleterious effects of moisture on API and formulation solid-state properties.
With the above in mind, the European Pharmacopeia has classified the hygroscopic nature of materials as a function of the percent water uptake at 80% RH and 25 °C.5 These values are given in Table 1.
Table 1. Hygroscopicity classification as defined by the European Pharmacopeia. Source: Surface Measurement Systems Ltd
Hydrate/Solvate
The ultimate hydration state of a pharmaceutical material may affect several physicochemical properties, including chemical and physical stability.6 Some hydrated materials become amorphous upon dehydration, for example.
Also, different hydrate forms can affect the material’s solubility, flow ability, dissolution rate, and compressibility. These factors influence every phase of the drug development process, from preformulation and solid form development to packaging and storage.
By one estimate, approximately one-third of all APIs are capable of forming crystalline hydrates.7 For these reasons, there has been increased regulatory pressure to fully characterize and control the physical form of excipients and active drugs.8
The DVS is instrumental in detecting and characterizing hydrate formation based on environmental relative humidity. Comprehensive details about DVS and hydrate stoichiometry are available in SMS Application Note 36. For visual representation, Figure 3 displays the water sorption isotherm for naloxone HCl at 25 °C.
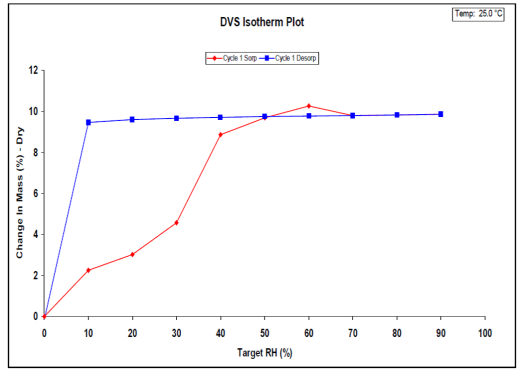
Figure 3. Water sorption (red) and desorption (blue) isotherms on naloxone HCl dihydrate at 25 °C. Image Credit: Surface Measurement Systems Ltd
The observed hysteresis is typical for a stoichiometric hydrate. The sample ultimately sorbs approximately 9.6% of its dry weight in water vapor. Using the known molecular weight of naloxone HCl, this correlates to 1.9 water molecules per naloxone HCl molecule (i.e., dihydrate).
Channel hydrates are a subset of pharmaceutical hydrates. For channel hydrates, both the hydrated and dehydrated crystal structures are isomorphic, meaning there are no distinguishable phase changes during the processes of hydration and dehydration.
Water molecules fill one-dimensional channels or two-dimensional planes running through the crystal structure in a channel hydrate. SMS Application Note 59 provides detailed information on using DVS for the identification and characterization of channel hydrates.
Typical water sorption results on a channel hydrate are shown in Figure 4. The isotherms show sharp increases in water vapor below 15% RH, followed by minimal water uptake between 20 and 95%. The water uptake at low % RH conditions is explained by the lattice channels filling with water.
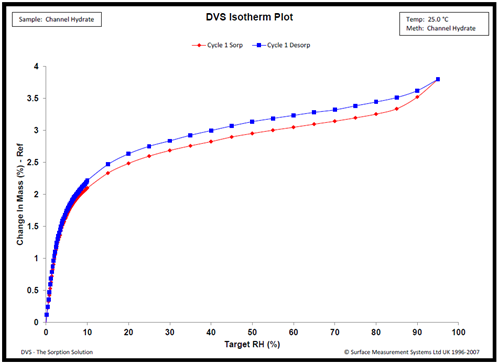
Figure 4. Water sorption kinetics Compound X at 25.0 °C. Image Credit: Surface Measurement Systems Ltd
Similar behavior has been observed for alternative channel hydrates, and the confirmation of channel hydrate formation was supported by complimentary variable RH PXRD, thermal analysis, NMR analysis, and vibrational spectroscopy.9,10,11
DVS can also be extended to measure the sorption properties of organic solvents. Therefore, the same methodology can be used to study stoichiometric solvates. SMS Application Note 41 details this approach.
Figure 5 illustrates the acetone vapor isotherms on a carbamazepine sample. The resulting isotherm shape and hysteresis are indicative of a 1:1 solvate formation above 80% P/Po. This solvate is relatively stable, as it does not desolvate until all of the acetone vapor is removed during the desorption drying step.
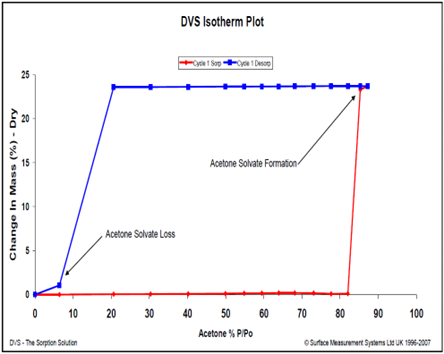
Figure 5. Acetone vapor sorption (red) and desorption (blue) isotherms for carbamazepine at 25 °C. Image Credit: Surface Measurement Systems Ltd
A final area of characterization in the formation of hydrates/solvates of pharmaceutical materials is the combined use of DVS with in-situ vibrational spectroscopy.
As moisture is absorbed by a sample, the intermolecular structure and forces within it adapt to accommodate water molecules. This leads to changes in the sample’s molecular vibrational characteristics, which can be monitored by changes in the Raman spectrum or Near-IR spectrum.12,13 Figure 6 shows the Raman spectra for Nedocromil sodium at 13 and 15% RH.
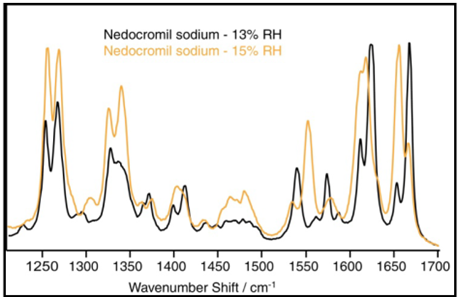
Figure 6. Raman spectra of nedocromil sodium at 13% and 15% RH. Image Credit: Surface Measurement Systems Ltd
The absorption of two moles of water is indicated by the DVS water sorption data in this region. The transition from the monohydrate to the tri-hydrate state is confirmed by the Raman spectra.
As the compound changes its hydration state, substantial modifications in pharmaceutically important properties can occur, such as solubility and bio-availability of the drug.
The examples in this section outline how DVS studies can be useful in the characterization of solvates and hydrates over a vast range of environmental temperatures and solvent concentrations.
Moisture-Induced Phase Changes
Amorphous solids often absorb significantly greater amounts of water vapor compared to their corresponding crystalline phases. Sorbed water can act as a plasticizing agent to significantly lower the glass transition temperature, leading to spontaneous phase transitions and lyophile collapse.
There is often a critical humidity at which the glass transition will occur at room temperature. This can lead to greater cohesiveness, powder caking and adhesion to other surfaces.
Research has shown that cohesion is influenced by the combined effects of moisture and temperature. Therefore, it is crucial for the storage and processing of amorphous pharmaceutical ingredients to determine the necessary threshold temperature and humidity conditions to prevent a glass transition.14
Investigating only a single parameter (i.e., moisture content or temperature alone) would not suffice to understand the likelihood of a powder to cake. The mechanism for sticking and caking of amorphous sugars is through the phase change of the amorphous sugar from a glass to a rubber at conditions above the glass transition point.
For in-depth insights into moisture-induced glass transitions, consult SMS Application Note 32 and Reference 15. In brief, a linear RH ramping experiment is conducted, revealing multiple moisture-induced phase transitions through the sample’s non-linear moisture sorption response. Figure 7 illustrates this phenomenon using a spray-dried lactose sample.
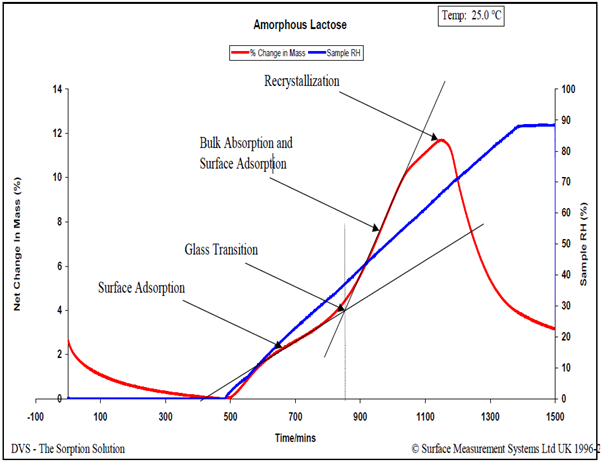
Figure 7. Relative humidity ramping experiment (6.0% RH/hour) for an amorphous lactose sample at 25.0 °C. Image Credit: Surface Measurement Systems Ltd
A 2-dimensional phase diagram, given in Figure 8, can be established by performing similar experiments in a range of temperatures. This can be used to determine the ideal storage and processing conditions to limit any moisture-induced phase transformations and subsequent powder caking.
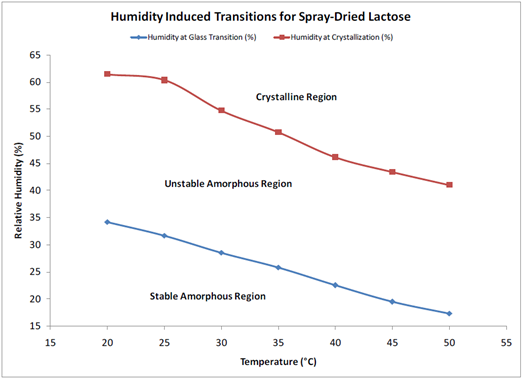
Figure 8. Humidity-induced phase transitions for spray-dried lactose measured via DVS. Image Credit: Surface Measurement Systems Ltd
Amorphous Content
The existence of the amorphous phase can create unique challenges in the formulation, processing, and storage of these materials. In particular, the caking behavior of powders can be dependent on the amount of material present in the amorphous state.17,18,19,20,21
The majority of these methods are based on the amorphous phase sorbing more vapor than the crystalline phase. Amorphous materials have a greater surface area and vapor affinity in general when compared to their crystalline counterparts. For vapor sorption methods, a calibration of known amorphous contents is typically necessary.
Then, the equilibrium vapor uptake at a given vapor concentration is plotted against the known amorphous content. The result is a calibration curve used to compare unknown amorphous contents.
Due to the aforementioned changes in crystalline state induced by water (polymorph, solvation, conversion, etc.), the use of a non-polar organic vapor is recommended for hydrophobic materials. Figure 9 shows the octane vapor sorption isotherms (a.) and calibration curve (b.) for lactose samples with varying amorphous contents.
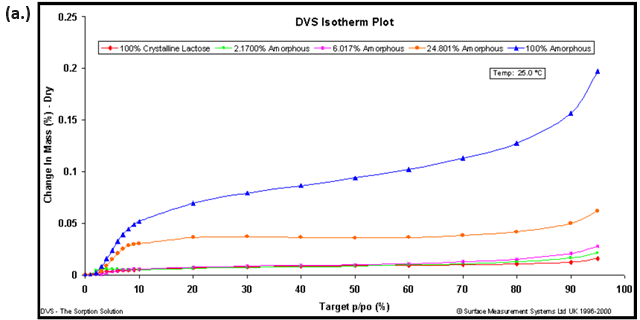
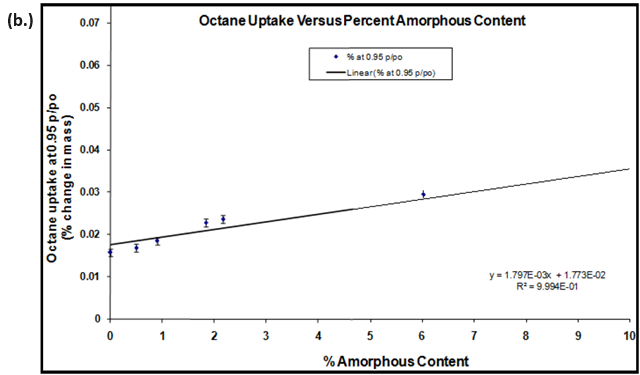
Figure 9. Octane vapor sorption isotherms (a.) and resulting calibration curve (b.) for lactose samples with various amorphous fractions. Image Credit: Surface Measurement Systems Ltd
Amorphous standards were created by making physical mixtures of 100% amorphous and 100% crystalline lactose. The resulting calibration curve and correlation coefficient (R2=0.9994) suggests that amorphous contents below 0.5% were achievable with an accuracy of ± 0.3%.
The error margins in Figure 9b were based on the 1st standard deviation for repeat measurements (n=3).16 There are several methods in the literature using gravimetric vapor sorption techniques to quantify amorphous contents.
Video Microscopy
Figure 10 presents 100x images of amorphous lactose taken at 0% (A), 50% (B), 60% (C), and 90% RH (D). This is the same material used in Figure 7. By 50% RH, the sample is evidently changed to the rubbery form due to the humidity-induced glass transition.
At 60% RH, the sample initiates crystallization. At 90% RH, crystallization of amorphous lactose becomes apparent, indicated by the increased opacity in the image. When correlated with the mass change results in Figure 7, the images presented in Figure 10 distinctly reveal various humidity-induced phase changes.
The physical changes inferred from the gravimetric data can be further supported by in-situ microscopic images collected during the experiment. This is done using the DVS-Video accessory. The long-working distance digital microscope allows the automatic collection of images during a DVS experiment with magnification up to 200X.
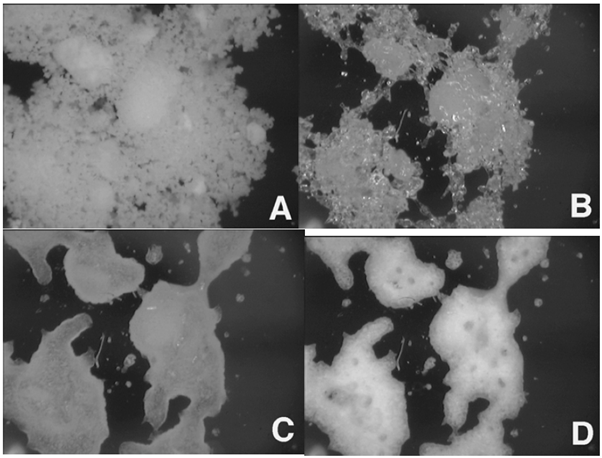
Figure 10. In-situ images collected on amorphous lactose at 0% (A), 50% (B), 60% (C), and 90% RH (D). Image Credit: Surface Measurement Systems Ltd
Raman/Near-IR
Vibrational spectroscopic techniques, which include Near-IR 25 or Near-IR spectrum22,23, 26 and Raman spectroscopy,24 have also been used in combination with gravimetric sorption methods.
As moisture is absorbed by a sample, the intermolecular structure and forces within it adapt to accommodate water molecules. This leads to changes in the sample’s molecular vibrational characteristics, which can be monitored by changes in the Raman spectrum25 or Near-IR spectrum.26
Raman spectroscopy can be sensitive to changes in hydrogen bonding and other subtle reorientation of the solid material. Raman spectroscopy has, for example, been used to determine the changes in the strength of hydrogen bonding between various pharmaceutical polymers and water.27
The same study reported observing changes in Raman spectra due to water plasticizing the polymers. The water sorption/desorption (a.) and Raman spectra (b.) for microcrystalline cellulose (MCC) at 25 °C are displayed in Figure 11.
MCC is not expected to form a stoichiometric hydrated species or undergo any first-order phase change when exposed to increasing humidity. However, there are clear differences in the Raman spectra as the humidity is increased.
MCC does experience a significant amount of bulk water absorption as humidity is increased. Therefore, the changes observed in Figure 11b could be due to increased hydrogen bonding, a decrease in void spaces, or other structural rearrangements.
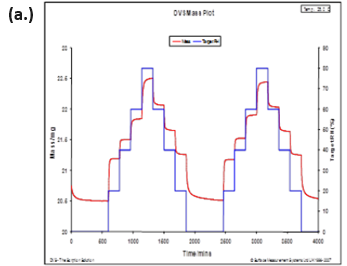
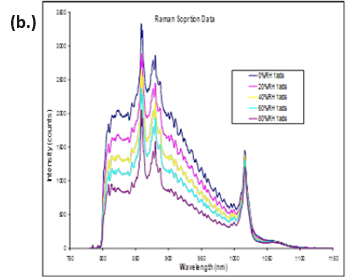
Figure 11. DVS water sorption/desorption results (a.) and in-situ Raman spectra (b.) for MCC at 25 °C. Image Credit: Surface Measurement Systems Ltd
Diffusion/Flux Experiments
Real-time mass change data can be collected as often as once a second, which enabled the diffusion coefficients to be determined for various geometries.
DVS has been successfully used to measure diffusion coefficients for films, powders, and fibers. Diffusion into films can be particularly useful for packaging applications.
SMS Application Note 16 outlines the theory and method for thin film diffusion coefficient determination, which, in brief, is as follows:
Diffusion equations first employed by Crank and Park are employed when evaluating diffusion coefficients.28
In a single humidity step and with a thin film of known thickness, analyzing the initial sorption kinetics into the bulk can help determine the diffusion coefficient. This analysis can be conducted across various temperatures to explore different storage conditions.
Figure 12 displays the water diffusion coefficients into a fluoropolymer-copolymer film over a range of temperatures.
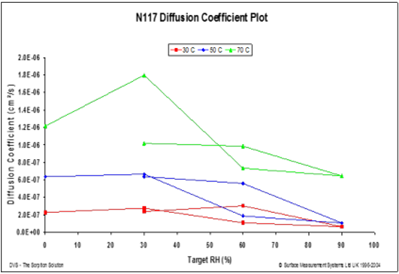
Figure 12. Diffusion coefficients at 30 °C (red), 50 °C (blue), and 70 °C (green) for a fluoropolymer-copolymer film (183 microns). Image Credit: Surface Measurement Systems Ltd
Water Vapor Transmission Rates (WVTR)
A new diffusion cell, based on the Payne style, was designed and developed specifically to measure the permeability and diffusion rate of thin films. The design of this cell is shown in Figure 13.
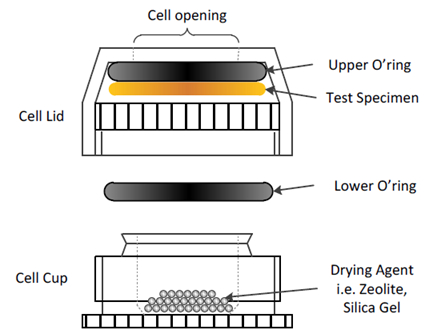
Figure 13. Experimental set-up for moisture vapor transmission rate measurement. Image Credit: Surface Measurement Systems Ltd
Full description of the cell, including dry-cup and wet-cup methods, can be found in SMS Application Note 52
This cell can be readily used to determine WVTR values. Combined with the diffusion coefficients previously mentioned, WVTR determination can be used for packaging/barrier applications.
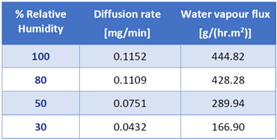
To illustrate the utility of this Payne cell, Table 2 displays the steady-state water vapor flux values on an electro-spun PCL membrane over a range of humidity boundary conditions. As expected, the flux across the membrane increases when the surrounding relative humidity increases.
Table 2. Water vapor flux through electrospun PCL membrane at varying relative humidity values. Source: Surface Measurement Systems Ltd
BET Surface Area
It is also possible to determine the BET surface area through the use of organic vapors in the DVS. This approach is outlined in detail in SMS Application Note 18. Using DVS as a means to measure surface area has many advantages over volumetric techniques used traditionally.
First, the DVS experiments are performed at room temperature and atmospheric pressure, as opposed to cryogenic temperatures and vacuum. In the latter case, there is a risk of altering the structure of fragile materials (i.e., magnesium stearate and microcrystalline cellulose).
Second, the necessary sample masses for DVS experiments are often significantly lower than for volumetric instrumentation - typically 100 mg or below. This can be particularly advantageous when quantities are limited (i.e., new drug entities) or with very low surface area materials (i.e., below 1 m2/g).
Finally, equilibration can often occur more rapidly in DVS - as it is a dynamic flow technique - than in static, volumetric techniques.
The BET plot for octane sorption on a hydrophobic drug (Metformin Hydrochloride) is shown in Figure 14.
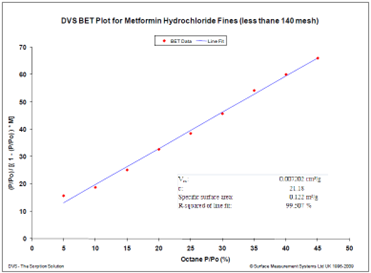
Figure 14. BET surface area plot for a hydrophobic drug using octane vapor at 25 °C. Image Credit: Surface Measurement Systems Ltd
Repeated experiments revealed an average surface area of 0.116 +/- 0.005 m²/g, conducted with a sample weighing approximately 450 mg. Obtaining the BET surface area proved challenging due to the relatively small sample size, which could not be accommodated by traditional nitrogen volumetric sorption systems.
Sorption Mechanisms
Understanding the vapor sorption mechanism in pharmaceutical materials is crucial for grasping the interaction between vapors and solids. This understanding can be enhanced by examining factors such as the heat of sorption (refer to SMS Application Note 19) or analyzing the isotherm shape (refer to SMS Application Note 26).
For instance, conducting heat of sorption measurements on α-lactose monohydrate, a model pharmaceutical excipient, using water and 1-butanol provides valuable insights into the sorption mechanism within solid-vapor systems.
A Type II sorption mechanism, for example, is shown in Figure 15. The n-butanol sorption isotherm on α-lactose monohydrate indicates a Type II sorption mechanism - monolayer, followed by multilayer sorption.
This isotherm shape differs from water on α-lactose monohydrate, where a Type III isotherm results in no monolayer formation.
The change in isotherm shape indicates a clear shift in the sorption mechanism to n-butanol from water. Here, the water-water interactions dominate due to water’s high polarity. Islands or clusters are thus formed at low coverages.
This is in contrast to n-butanol, which is significantly less polar, so the interaction with the lactose surface dominates at low coverages, resulting in monolayer formation. This information could be useful in informing choices of solvents as dispersion liquids.
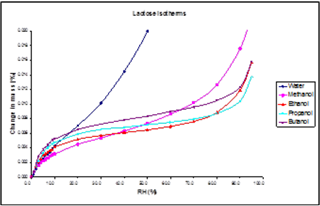
Figure 15. Adsorption isotherms for methanol, ethanol, 1-propanol and 1-butanol on the lactose sample at 25.0 °C (with water isotherm for comparison). Image Credit: Surface Measurement Systems Ltd
Conclusion
Dynamic Vapor Sorption (DVS) enables precise assessment of how pharmaceutical materials interact with moisture, a critical factor affecting product stability and quality, and is, therefore, essential within the pharmaceutical industry.
DVS aids in moisture-sensitive formulation development, quality control, and packaging evaluation, ensuring the safety and efficacy of pharmaceutical products over their formulation, manufacturing, and shelf life.
The technique can also be used to inform drying and storage conditions, address hygroscopicity challenges, and support regulatory compliance, making it an indispensable tool for pharmaceutical research, development, and manufacturing.
The option of using organic solvents facilitates investigations into other properties of the material, including Specific Surface areas, solvate formations and Amorphous content.
References
- P. York. Solid-state properties of powders in the formulation and processing of solid dosage forms. Int. J. Pharm. 14, 1-28 (1983).
- G. Buckton and P. Darcy, The use of gravimetric studies to assess the degree of crystallinity of predominately crystalline powders, Int. J. of Pharmaceutics, 123, 265-271 (1995).
- J Sun, American Pharmaceutical Review, 14(6): 76-80 (2011).
- AW Newman, SM Ruetzel-Edens, G. Zografi, Journal of Pharmaceutical Sciences, 97(3): 1047-1059 (2007).
- European Pharmacopeia Technical Guide, December 1999.
- Brittain, H.G. editor, Polymorphism in Pharmaceutical Solids, Marcel Dekker: New York (1999).
- Braimer. D.D., editor, Towards Better Safety of Drugs and Pharmaceutical Products, Elsevier/North-Holland Biomedical Press (1980).
- Office of the Federal Register. Q6A-Specifications. Test procedures and acceptance criteria for new drug substances and drug products: Chemical substances. Federal Register, Vol. 62. Washington, DC: Office of the Federal Register (1997) 62889-62910.
- Vogt, F.G., Brum, J., Katrincic, L.M., Flach, A., Socha, J.M., Goodman, R.M., and Haltiwanger, R.C., Crystal Growth & Design 6 (2006) 2333-2354.
- Authelin, J.-R., International Journal of Pharmaceutics 303 (2005) 37-53.
- Mimura, H., Gato, K., Kitamura, S., Kitagawa, T., and Kohda, S., Chem. Pharm. Bull. 50 (2002) 766-770.
- SMS Application Note 507.
- Hogan, S.E. and Buckton, G., International Journal of Pharmaceutics, 227 (2001) 57-69.
- KD Foster, JE Bronlund, AHJ Paterson, Journal of Food Engineering, 77:997-1006 (2006).
- DJ Burnett, F Thielmann, and J Booth, International Journal of Pharmaceutic,. 287:123-133 (2004).
- JJ.Fitzpatrick, M Hodnett, M Twomey, PSM Cerqueira, J O’Flynn, and YH Roos, Powder Technology, 178:119-128 (2007).
- BC Hancock and G Zografi, Journal of Pharmaceutical Science, 86:1-12 (1997).
- A Saleki-Gerhard, C Ahlneck, and G Zografi, International Journal of Pharmaceutics, 101 :237 (1994).
- G Buckton, and P Darcy, Proc. 1st World Meeting APGI/APV, Budapest, 9/11 (1995).
- L Mackin, R Zanon, JM Park, K Foster, H Opalenik, and M Demonte, International Journal of Pharmaceutics, 231 :227 (2002).
- PM Young, H Chiou, T, Tee, D Traini, H-K Chan, F, Thielmann, and D Burnett,, Drug Development and Industrial Pharmacy, 33 :91-97 (2007).
- RA Lane and G Buckton, International Journal of Pharmaceutics, 207:49-56 (2000).
- KL Vora, G Buckton, and D Clapham, Eur. J. Pharm. Sci., 22:97-105 (2004).
- AD Gift and LS Taylor, J. Pharm. And Biomedical Analysis, 43:14-23 (2007).
- SMS Application Note 507.
- SE Hogan and G Buckton, International Journal of Pharmaceutics, 227 :57-69 (2001).
- LS Taylor, FW Langkilde and G Zografi, Journal of Pharmaceutical Science, 90:888-901 (2001).
- J Crank and G. Park. Diffusion in Polymers, Academic Press New York (1968).

This information has been sourced, reviewed and adapted from materials provided by Surface Measurement Systems Ltd.
For more information on this source, please visit Surface Measurement Systems Ltd.