This article addresses a common misunderstanding among some users regarding non-volumetric particle counters.
Some users believe that dividing particle counts by the counting efficiency (CE) at the lower limit is necessary to determine the ‘true’ concentration of particles in a fluid system. Additionally, there is confusion about why particle counters with similar-sized channels but different detection limits report varying values.
This article will delve into the science behind these discrepancies and clarify misconceptions related to the characteristics of non-volumetric particle counters.
Background
When designing optical particle counters (OPCs), a compromise must be made between reducing system-generated noise and enhancing the signal generated by the particles.
Noise can originate from various sources, such as the light source itself, the optics that shape the light, window surfaces/capillary walls, the molecules in the sample fluid, and the electronic circuits responsible for collecting and processing the scattered light.
Particle counters with detection limits exceeding 100 nm have the capability to illuminate the sample cell walls while maintaining satisfactory signal-to-noise (s:n) ratios.
This ability to uniformly illuminate the entire sample cell using a laser or similar light source makes these instruments volumetric and ensures a clearly defined sample volume for the particles of interest.
In particle counters with detection limits below 100 nm, illuminating the sample cell walls tends to generate excessive noise compared to the light collected from the particles of interest. To address this problem, the laser needs to be focused to a size smaller than the sample cell, and only the central region of the cell is examined for particles.
However, this focusing process leads to a variation in power density within the beam. As a consequence of using a beam smaller than the sample cell, particles have the freedom to move through the laser at any location across the beam’s cross-sectional area.
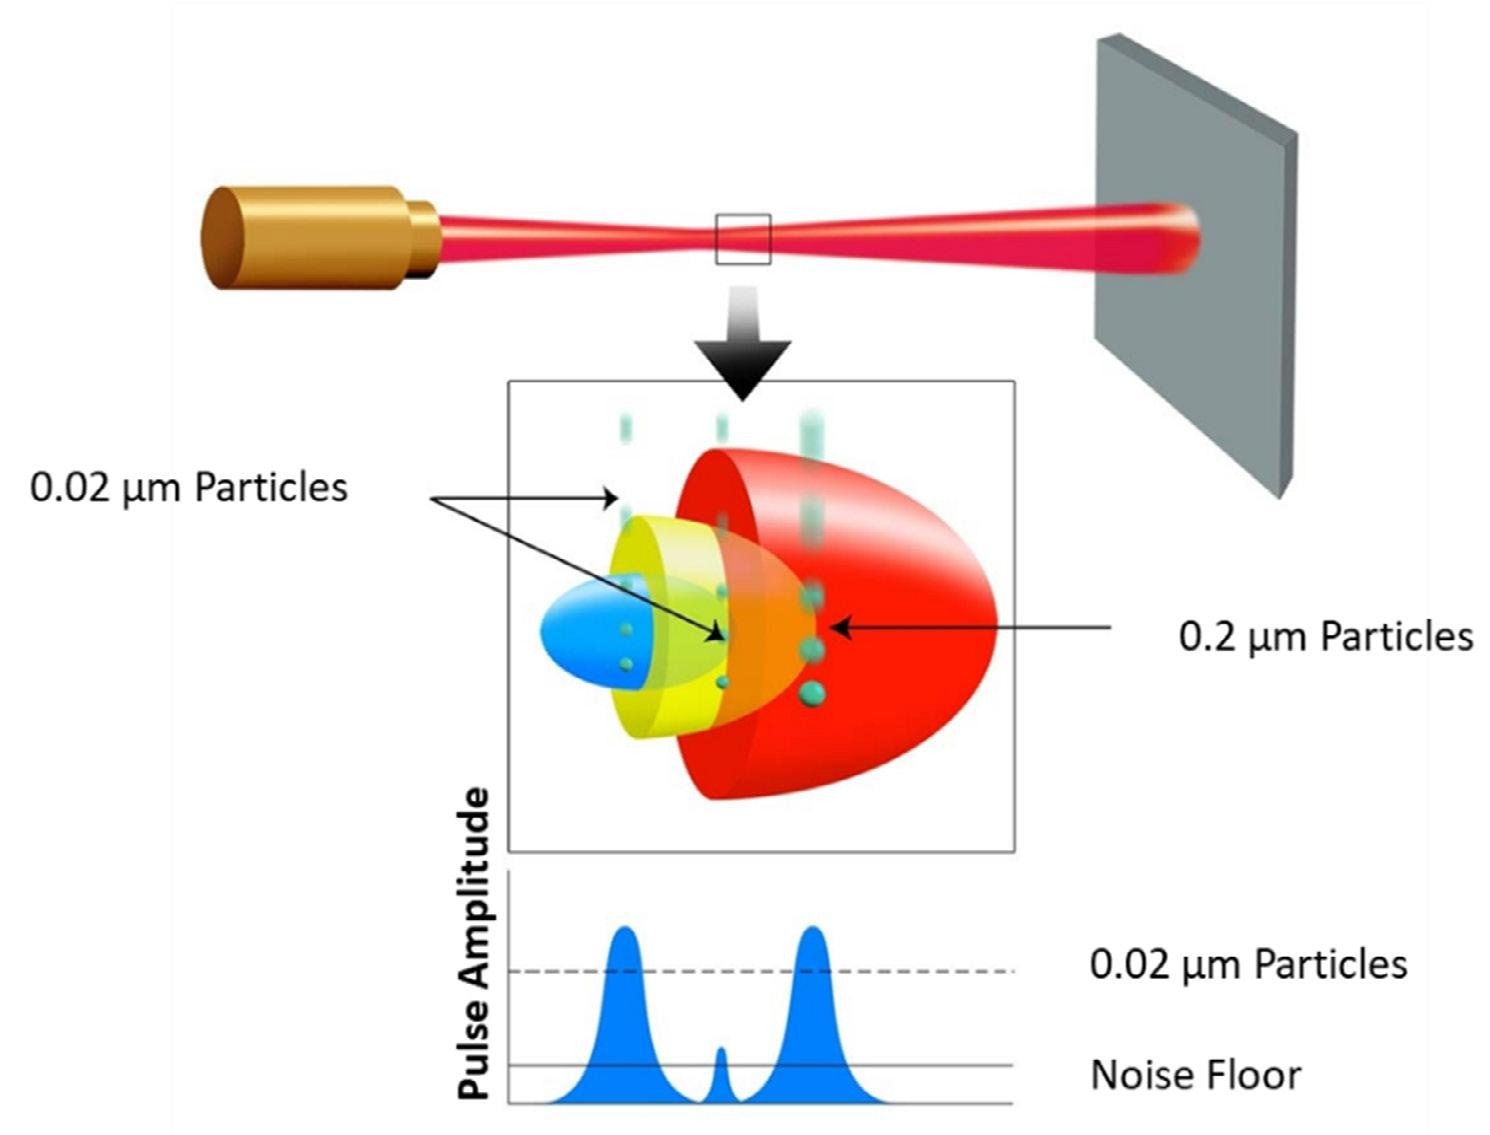
Figure 1. Sizing vs. Laser beam profile. Image Credit: Particle Measuring Systems
Certain particles will pass through the central region of the beam, which has the highest energy concentration (as shown in Figure 1). These particles will produce a strong signal and be measured as larger particles.
On the other hand, particles of the same size that traverse the laser beam near the edges, where the energy is significantly lower, will generate a weaker signal and be measured as smaller particles.
Particles at the detection limit of the particle counter can only be detected when they pass through the center of the laser beam. However, larger particles can generate a signal comparable to that of particles at the detection limit when they pass through portions of the beam that are located farther from the center.
Consequently, these larger particles will be counted and sized as smaller particles. This means that a larger percentage of the laser beam’s focal point can detect and size larger particles. In other words, as the particle size increases, the sample volume of the instrument also increases.
Particle Measuring Systems has termed this phenomenon “Sample Volume Growth.” All particle counters with instrument sample volumes less than 100% of the instrument flow rate will experience some degree of sample volume growth.
Discussion
Although the occurrence of sample volume growth and the consequent variation in counting efficiency with particle size may be less than ideal for some users of particle counters, it is an unavoidable aspect of their operation.
The industry demands particle counters capable of detecting particles as small as 20 nm, and there is a push for even greater sensitivity to detect particles of 10 nm or smaller.
Optical light scattering remains the most reliable and consistent technology for detecting yield-limiting particle excursions. Furthermore, sample volume growth is not a random variable that varies between instruments. It is defined by the product design, and all instruments following that design will exhibit similar levels of sample volume growth.
Due to the lower counting efficiency (CE) of the first channel, which is lower than 100%, some users choose to compensate for this by dividing the counts by the counting efficiency to obtain a total count value referred to as “real counts.”
It is crucial to understand that the counting efficiency at the lower detection limit is determined by introducing a known concentration of particles that precisely match the size of the lower detection limit (e.g., 20 nm in the illustrated CE curve in Figure 2).
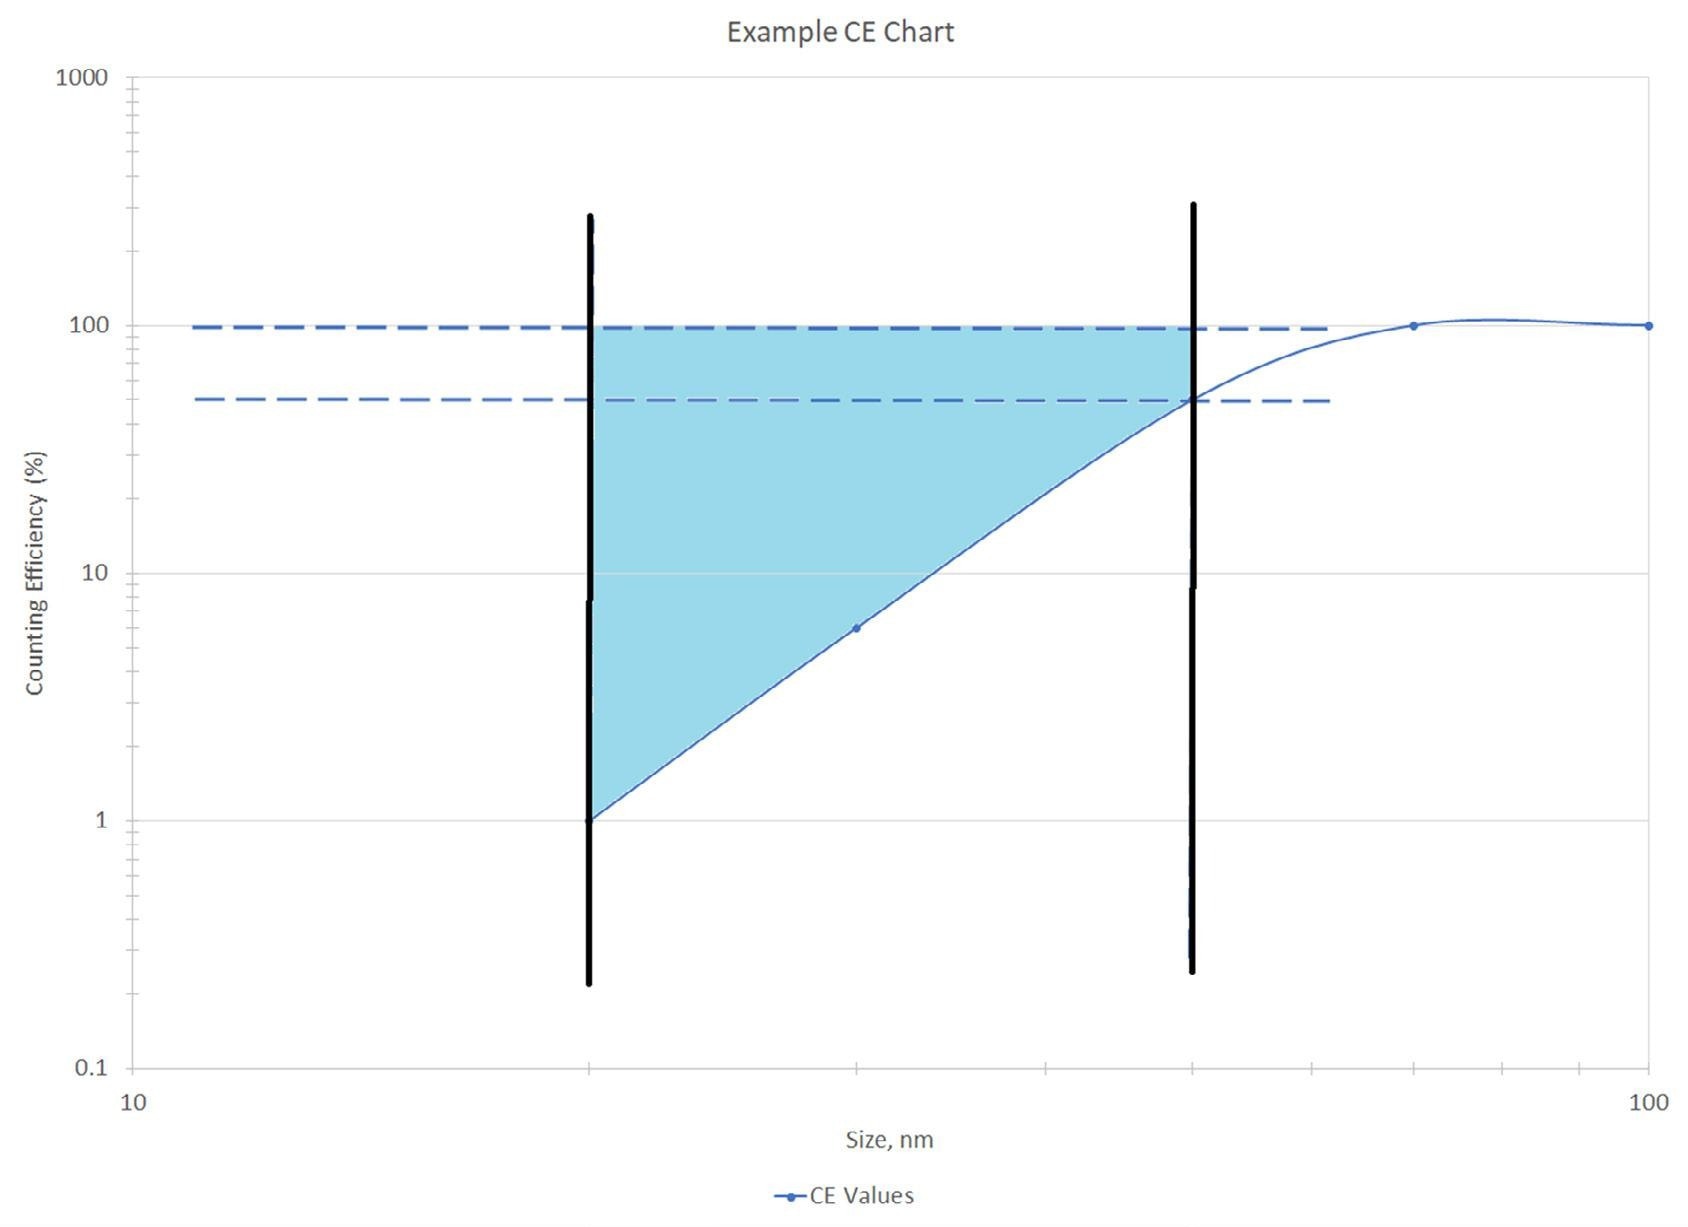
Figure 2. Ideal example of a counting efficiency chart. Image Credit: Particle Measuring Systems
The illustrated counting efficiency curve in Figure 2 represents an idealized scenario where there is a roughly linear increase in counting efficiency. In an actual particle counter, the 20 nm channel will count particles ranging in size from 20 nm to 50 nm.
Since the counting efficiency improves as particle size increases across the channel, it is not accurate to divide the reported counts by the counting efficiency measured at 20 nm to determine the actual counts for this channel.
In the provided chart of Figure 2, only the counts within the blue-shaded area are not reported. It is easy to construct a shape (consisting of a triangle and a rectangle) to represent these “missing” counts.
If the reported counts were corrected by dividing them by the counting efficiency of the 1st channel (which is 1% in this example), the counts would increase by a factor of 100. However, as clearly depicted in Figure 2, the “missing counts” in a less idealized version are only approximately four times greater.
In a real-world counting efficiency curve (as shown in Figure 3), the rise in counting efficiency is steeper, resulting in much smaller “missing counts” compared to the simplified example depicted in Figure 2.
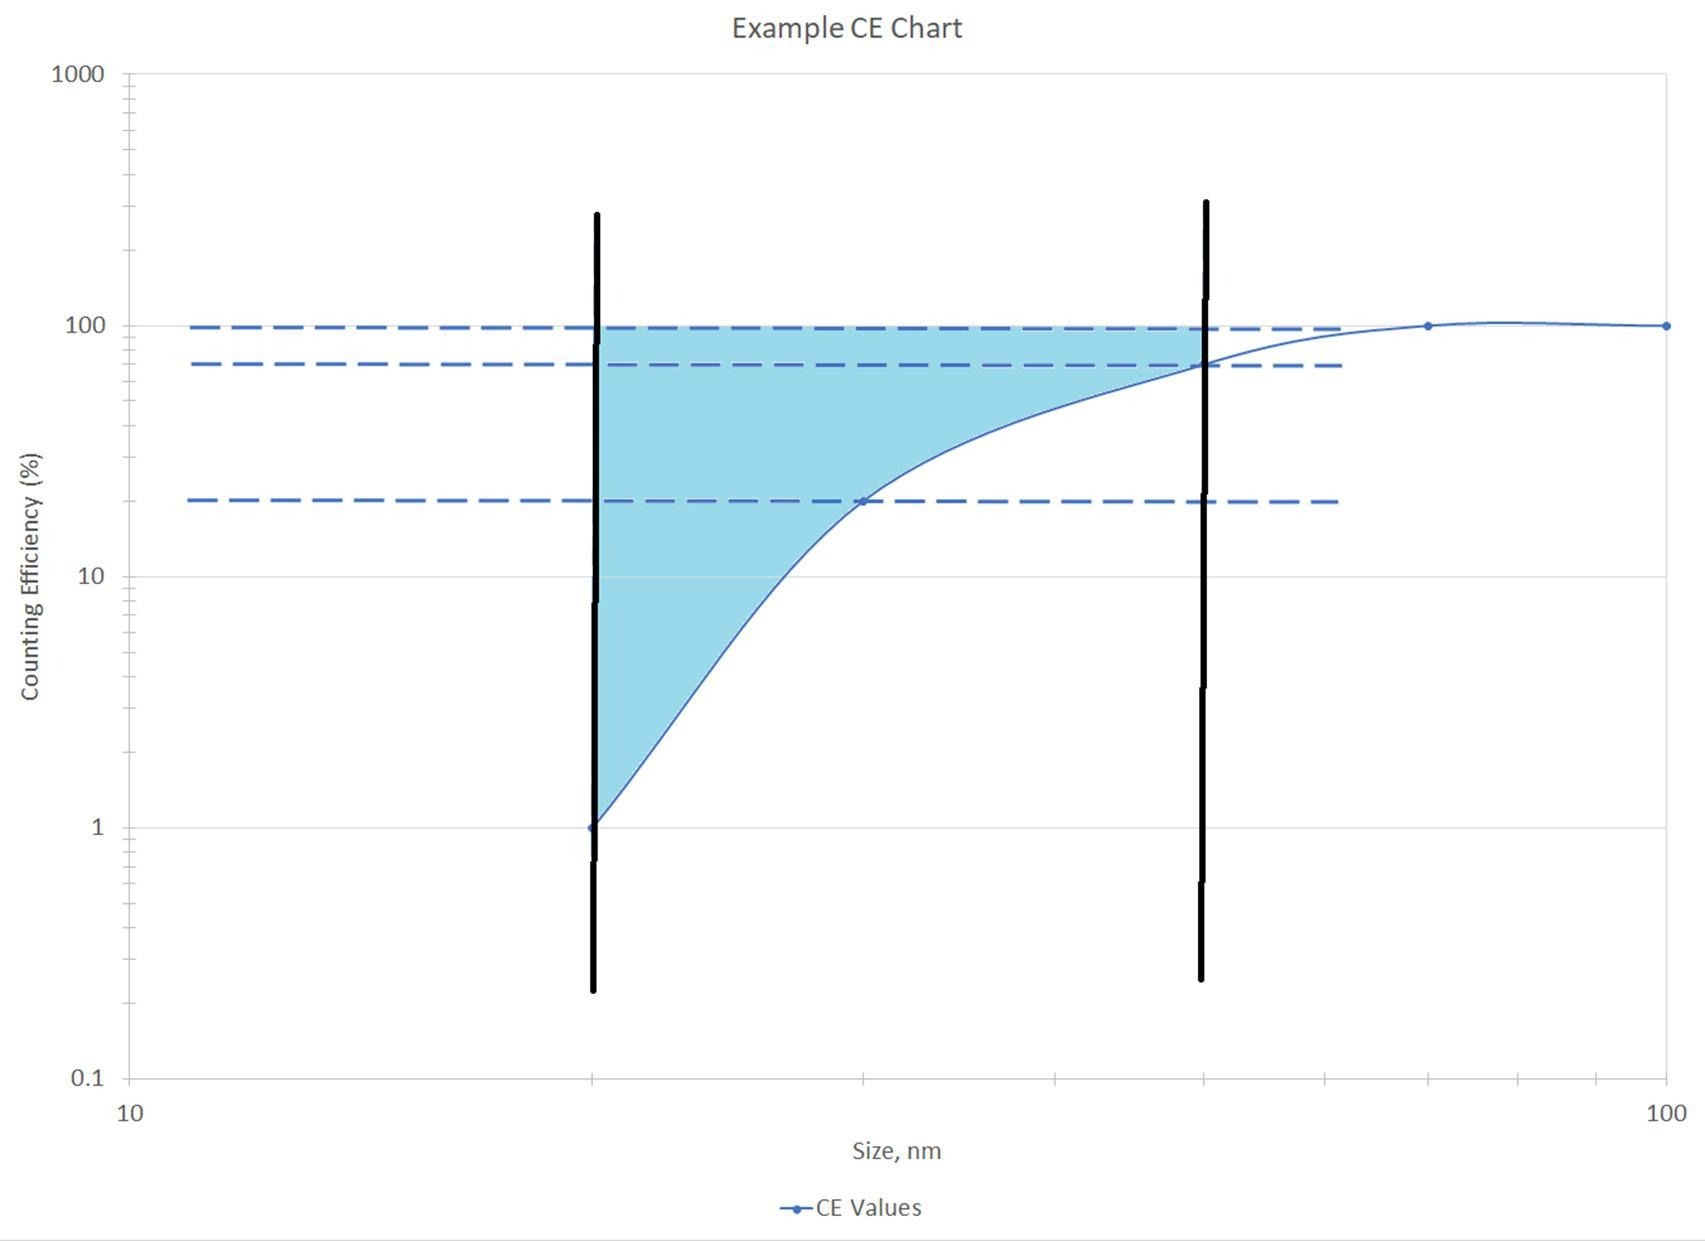
Figure 3. Real-world example counting efficiency chart. Image Credit: Particle Measuring Systems
Due to the complex nature of real-world variations, it is challenging to determine a universal correction factor that can be applied in all situations, even with the same fluid source. Calculating the exact number of particles is extremely difficult.
However, an optical particle counter still offers valuable data that reflects changes occurring within the system.
For example, in the event of an impending system failure, such as clogged filters or pump wear, the particle counts in this channel will increase proportionally. This provides the user with sufficient time to respond to the situation before it reaches a critical stage.
Comparing Two Different Sensitivity Particle Counters
Users often wonder why the upper channel of a more sensitive particle counter registers more particles than the first channel of a counter with a larger detection limit.
A specific example would involve comparing the UDI-20 channel to the UDI-50 channel, both of which measure particles larger than 50 nm.
However, once you grasp the concept of sample volume growth and familiarize yourself with the counting efficiency (CE) curve of these non-volumetric particle counters, the underlying reason for these discrepancies becomes evident (as depicted in Figure 4).
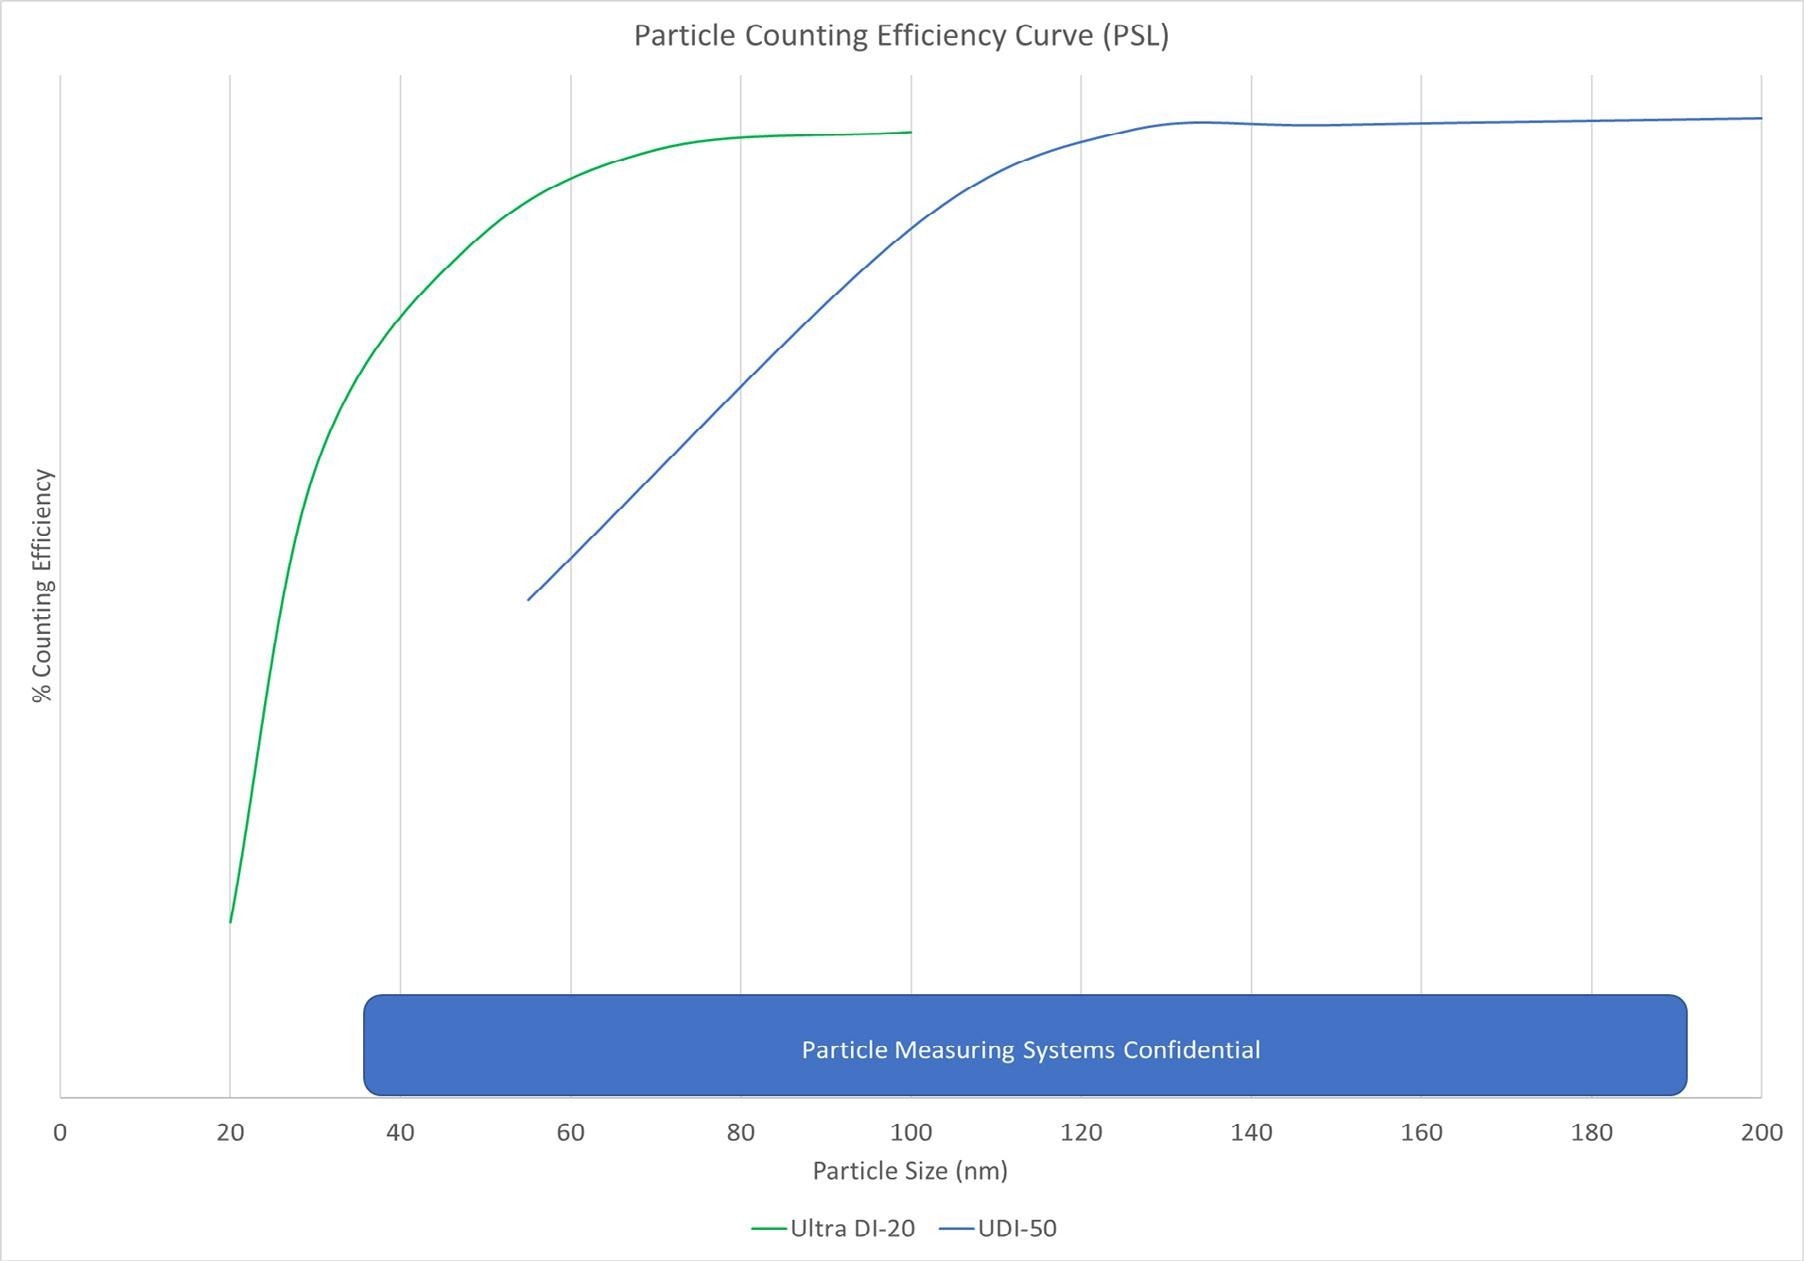
Figure 4. Particle counting efficiency curve comparison (UDI 20 vs UDI 50). Image Credit: Particle Measuring Systems
In Figure 4, it is evident that the UDI-20 particle counter, which is more sensitive, exhibits higher counting efficiency for particles larger than 50 nm compared to the UDI-50 counter at the same size range.
Consequently, within this size range, the UDI-20 is expected to count more particles than the UDI-50. It is important to note that the slight disagreement between these two particle counters in these channels is not a cause for concern.
The relationship between the reported data from each instrument will consistently hold true for system changes. If the system becomes dirtier, both instruments should register an increase in counts at 50 nm, and if the system becomes cleaner, the counts on both instruments should decrease.
The channels maintain their relative relationships with the system; however, they are designed to measure those particles differently.
Summary
To fulfill the semiconductor industry's requirement for detection limits below 100 nm, adopting a non-volumetric instrument design approach is essential.
All non-volumetric instruments exhibit some degree of sample volume growth, which leads to a lower counting efficiency at the lower limit of detection and variable counting efficiency across the lower channel sizes.
The increase in counting efficiency with particle size implies that the counting efficiency measured at a specific particle size within a channel cannot be applied to the entire channel. Therefore, using counting efficiency as a correction factor does not yield “true” particle counts.
Due to their design, particle counters with lower limits of detection will have different counting efficiencies at any given particle size channel compared to particle counters with larger lower limits of detection. While these particle counters may display different counts for individual particle channels, their overall trends will remain consistent.

This information has been sourced, reviewed and adapted from materials provided by Particle Measuring Systems.
For more information on this source, please visit Particle Measuring Systems.