As semiconductor devices become more complex and the critical particle size for today’s cutting-edge technology nodes falls into the sub-10 nm size range, controlling and mitigating potentially yield-impacting particle contamination at the lowest possible particle size becomes increasingly important.
Until recently, there was a considerable sensitivity gap between the critical particle size and the detection limit of standard chemical particle detectors.
The Chem 20™ chemical particle counter has industry-leading 20 nm sensitivity, making it a comprehensive solution for controlling and mitigating particle contamination at 20 nm in ultra-pure chemical applications.
The use cases described here demonstrate how Chem 20 may be used in various applications throughout the microelectronics sector, including chemical suppliers, semiconductor manufacturers, and tool and component suppliers.
Introduction
Identifying and removing yield-impacting particle contamination in high-purity process chemicals has long been a challenge in the semiconductor sector, and it is becoming increasingly important as the critical particle size for today’s technology nodes approaches 10 nm (or smaller).
Conventional chemical particle counters, generally restricted to particles 30 to 40 nm in diameter or bigger, are no longer sensitive enough for modern high-end process chemical applications.
Owing to recent advances in laser optics and detector technology, Chem 20 chemical particle counter can identify particles as small as 20 nm in process chemicals, with 9 nm sensitivity for metallic particles.
This makes Chem 20 the world’s most sensitive in-line chemical optical particle counter, delivering real-time, actionable 20 nm particle data ideal for a broad range of high-purity process chemical applications in the microelectronics sector.
Because the refractive index of the chemical being measured influences the performance of chemical particle counters, Chem 20 comes in two configurations to guarantee optimal particle sensitivity in all applications.
The standard Chem 20 is suited for low refractive index fluids like water, hydrogen peroxide, hydrofluoric acid, and ammonium hydroxide. In contrast, Chem 20-HI is ideal for higher refractive index fluids such as sulphuric acid and hydrochloric acid.
For high-sensitivity optical particle counters like Chem 20, background light scattering from a chemical medium, known as molecular scattering, can be a significant issue. For some substances, it can overload the optical detector, preventing the detection of light dispersed by the particles.
Chem 20’s High-Scatter mode identifies particles in several high-scattering compounds that would otherwise be impossible to detect, resulting in industry-leading particle sensitivity across various process chemicals.
This article includes several examples that show how Chem 20 can be an effective tool for controlling and mitigating particle contamination down to 20 nm.
Chemical Suppliers
As the critical particle size for semiconductor devices decreases, the purity of the process chemicals employed in their manufacture increases.
Chemical suppliers will use techniques such as filtration, distillation, and ion exchange to achieve the lowest possible particle contamination levels in their products. However, without the capability to identify and quantify particle contamination, there is no assurance that contamination levels will meet today’s increasingly stringent semiconductor manufacturing requirements.
Chemical companies use Chem 20 to verify in real-time that particle levels are below permissible limits before shipping products to end customers. Particle contamination is evaluated at the cleanest in-line sample point just before the product is dispensed into the shipping container, giving suppliers confidence in their quality checks.
Figure 1 depicts Chem 20 being used to fill shipping containers with high-purity sulphuric acid. The open supply valve pumps acid under pressure into the container and through Chem 20, which is connected in parallel.
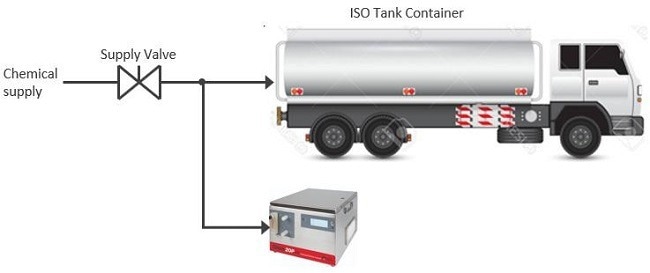
Figure 1. Schematic of particle measurement and filling of chemical shipping container occurring in tandem. Image Credit: Particle Measuring Systems
After the containers are filled, the supply valve is closed, and a second post-fill measurement is taken. The container is initially compressed, allowing a small amount of acid to flow back out of the container and through Chem 20.
This measurement indicates the amount of particle contamination introduced to the chemical from the filling process and the inside surfaces of the shipping containers.
Figure 2 depicts a series of measurements taken over many weeks during the filling and post-filling of nine ISO Tank Containers.
The solid bars represent the average particle concentration observed during the container-filling process, while the shaded bars represent the extra particles found in each container during the post-fill measurements.
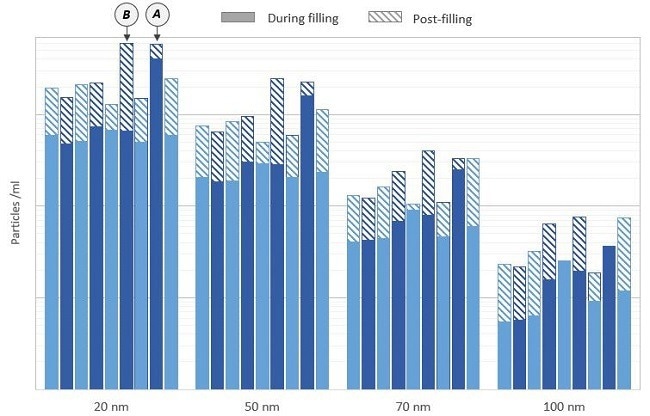
Figure 2. Shipping container fill and post-fill measurements at the chemical supplier. Image Credit: Particle Measuring Systems
In general, particle levels during filling were reasonably consistent, with one test (labeled “A” in Figure 2) being an obvious outlier. The particle concentration during this test was discovered to be excessive because of the particles emitted by a malfunctioning valve upstream, which was eventually repaired.
As predicted, more particles were found in the post-fill testing than during filling. The bulk of these particles are assumed to have originated on the inner surfaces of the shipping containers. These values also show far greater variability, indicating considerable differences in the cleanliness of individual containers.
The container labeled “B” in Figure 2 introduced an unusually high degree of particle contamination to the chemical, suggesting a cleanliness issue with the container that must be rectified.
The post-fill particle measurements offer a valuable indication of particle levels in the chemical when the semiconductor manufacturer receives it. They demonstrate the negative impact that individual shipping containers can have on particle contamination levels in the final chemical distribution, even if the chemical is highly clean at the filling point.
Semiconductor Manufacturers
Incoming Chemical Deliveries
When semiconductor manufacturers receive deliveries of high-purity process chemicals from their chemical supplier, they frequently perform particle measurements to ensure the chemical is adequately clean before accepting it into their facility, where it can be very difficult or impossible for their filtration system to clean it of impurities, even with repeated circulation.
Figure 3 shows a series of measurements taken with Chem 20 for inbound sulphuric acid supplies as they arrived at the semiconductor manufacturer’s facility.
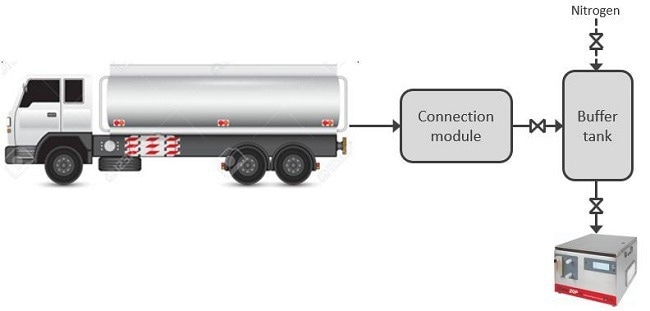
Figure 3. Schematic of particle measurements performed on chemical deliveries arriving at the semiconductor manufacturer. Image Credit: Particle Measuring Systems
The connecting module delivered a small amount of chemicals from the shipping container to a smaller intermediate transfer container. The transfer container was then briefly compressed with nitrogen to allow the chemical to pass through Chem 20.
This interim step was required to ensure that the particle readings were not influenced by the pulsations produced by the large diaphragm pumps often used to remove the chemical from the container.
Chemical supplies were examined from two distinct chemical suppliers, identified in Figure 4 as Supplier A and Supplier B, with two deliveries tested from each supplier.
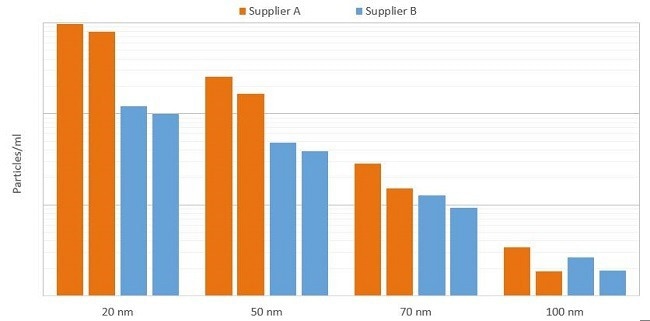
Figure 4. Particles measured in chemical deliveries arriving at the semiconductor manufacturer. Image Credit: Particle Measuring Systems
There was a noticeable and consistent difference in the cleanliness of the deliveries between the two suppliers. At 20 nm, Supplier A’s chemical was determined to be one order of magnitude more polluted than Supplier B’s chemical.
The difference between the two suppliers gets less noticeable as particle sizes increase, and it is almost impossible to see above 100 nm. Because particles smaller than 100 nm are a significant problem for modern semiconductor manufacturers, this highlights the benefit of detecting particles at the smallest sizes.
If particles larger than 70 nm or 100 nm were identified, the difference in chemical purity between the two providers would be substantially less noticeable in the key sub-70 nm particle size range.
Chemical Distribution Module
Chemical distribution modules within the semiconductor production plant regulate the supply of ultra-pure process chemicals to the point of use (POU).
Because the chemical distributed at the POU frequently comes into close contact with wafers, masks, and other critical surfaces, the chemical must be free of yield-threatening particle contamination at the distribution point.
Figure 5 depicts a design for measurements performed using a Chem 20 linked upstream and downstream of the final 2 nm filter within a chemical distribution module (CDM) for sulphuric acid.
The filter is placed just before the acid is dispensed to the POU. The acid had previously been cycled with 2 nm filtration before being moved to the day tanks, so particle readings in the CDM upstream and downstream of the filter should be quite comparable.
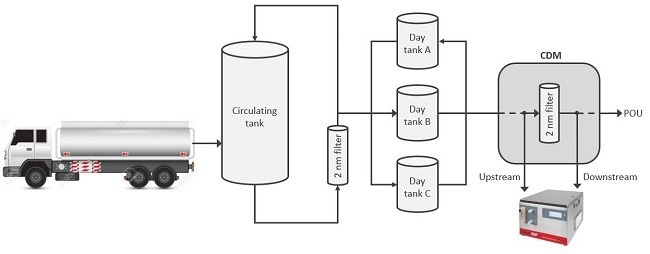
Figure 5. Schematic of particle measurements performed before and after filtration in the chemical distribution module. Image Credit: Particle Measuring Systems
Measurements were carried out over many days following the delivery of four separate chemical batches, and the average findings are shown in Figure 6.
As predicted, particle readings upstream and downstream of the filter in the CDM were relatively similar for most batches; however, a considerable variation was discovered after the first batch was delivered. The acid reaching the CDM from the day tanks had considerably more 20 nm particles than the other three batches.
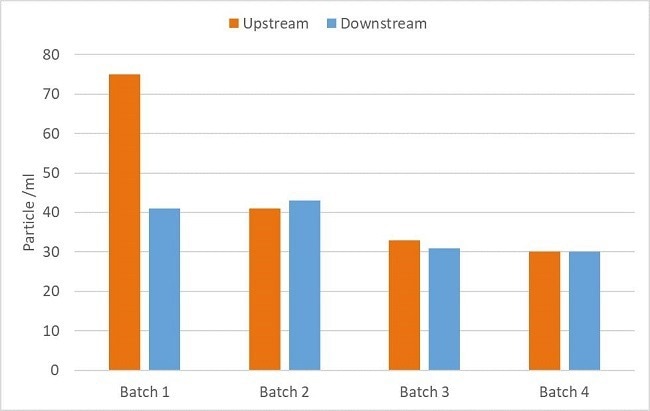
Figure 6. Particles measured upstream and downstream of filtration in the chemical distribution module. Image Credit: Particle Measuring Systems
Not only did Chem 20 reveal a relatively high level of particle contamination in the chemical that reached the CDM, but the results also show that additional filtration inside the CDM was effective in reducing particle contamination to a more typical level before the chemical was dispensed to the critical POU.
Filter Wetting
Particle filtration is one of the most significant strategies for preventing particle contamination in high-purity chemicals. However, particle filter performance can decline due to wear and tear on the filter membranes and fouling.
Filters should be maintained and replaced according to the manufacturer’s recommendations to ensure optimal filtration performance. Before a new filter can be used in a chemical system, the filter membranes must be wetted by passing liquid through the filter.
This is commonly done using a low surface-tension fluid, such as an IPA and water solution, followed by a flush with UPW to eliminate the IPA and any remaining particle contamination.
Figure 7 depicts a schematic for measurements taken with a Chem 20 in a customized filter-wetting machine used by a semiconductor manufacturer to wet and flush new particle filters before they are put into production.
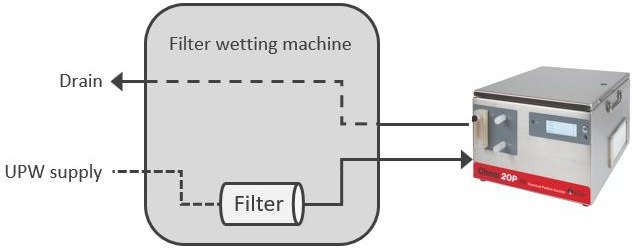
Figure 7. Schematic of particle measurements performed in the filter-wetting machine. Image Credit: Particle Measuring Systems
This system evaluated two new particle filters with filtration ratings of 2 nm and 15 nm. Chem 20 monitored the particle concentration downstream of each filter for 24 hours. Figures 8A and 8B illustrate the results of these measurements.
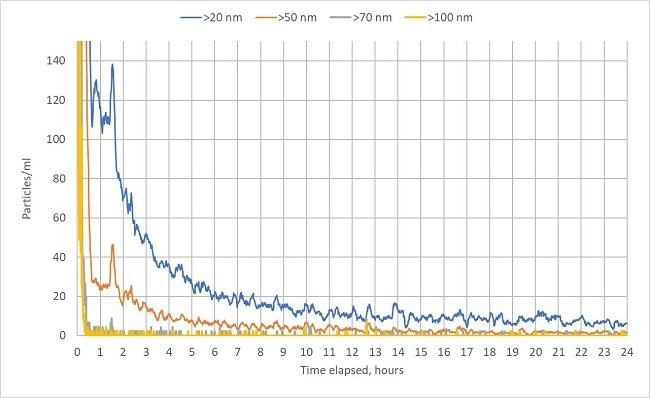
Figure 8.A. Particle measurements with a 15-nm-rated filter during wetting with IPA/water. Image Credit: Particle Measuring Systems
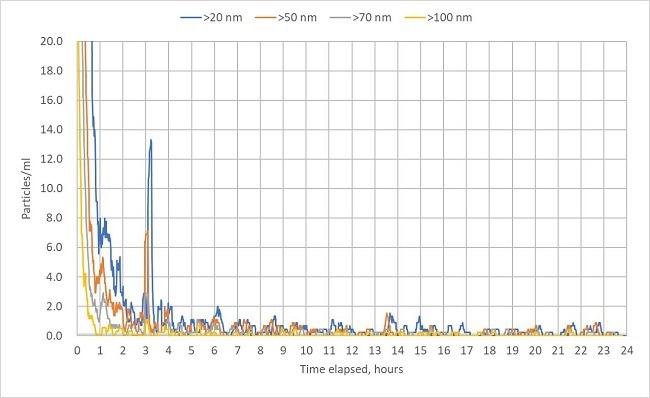
Figure 8.B. Particle measurements with 2 nm rated filter during wetting with IPA/water. Image Credit: Particle Measuring Systems
In both scenarios, the filters discharged a large amount of particle contamination during the first wetting phase, but the particle concentration steadily dropped as the filters cleaned up.
The 15 nm filter had a far higher concentration of sub-70 nm particles than the 2 nm filter, and it took considerably longer to settle at baseline particle levels.
The 15 nm filter took more than 12 hours to settle at the baseline level, while the 2 nm filter stabilized after around four hours and at a substantially lower particle concentration.
As described above, real-time particle data can be utilized to develop a time-saving filter-wetting routine, ensuring that filters are sufficiently clean before production.
Filter Aging
When replacing particle filters as part of a routine maintenance program, a valuable aspect to remember is that the manufacturer’s quoted filter rating may not match the filter’s actual performance.
The real-world performance of particle filters varies depending on the filter type, manufacturer, and even the duration of the operation. Older filters gather particulate matter over time, reducing the filter’s porosity and resulting in more particle retention at the expense of higher flow resistance.
At the end of its lifespan, the filter may begin to shed some of the accumulated particulate matter, leading to increased particle contamination downstream. Newer filters may also require some time to ‘settle in’ after installation before operating at peak efficiency.
Figure 9 depicts a schematic of measurements obtained with Chem 20 with IPA circulation within a wafer cleaning tool. IPA is pumped from the rinse tank through a particle filter and heater and back into the tank, where Chem 20 is attached via a T-connector directly downstream of the filter.
Because IPA is a high molecular scattering fluid, Chem 20 operated in high-scatter mode throughout these experiments, resulting in a slightly larger minimum detectable particle size of 24 nm.
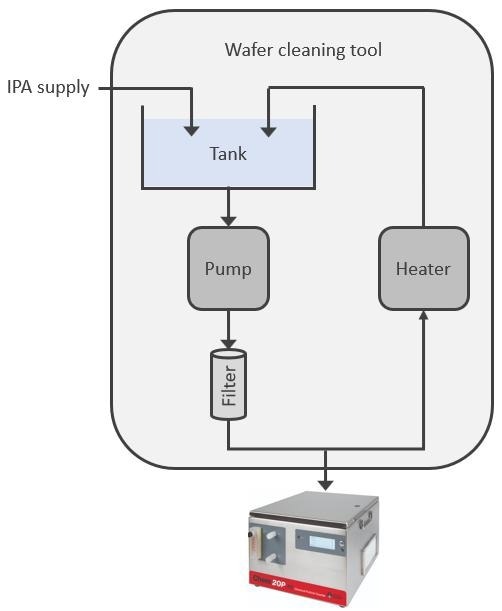
Figure 9. Schematic of measurements performed in the wafer cleaning tool. Image Credit: Particle Measuring Systems
The original filter, rated at 10 nm, had been in the tool for over a year before testing. Following the test, it was replaced with a brand new 5-nm-rated filter, and the measurement was repeated.
Figure 10 summarizes the average particle concentrations before and after replacing the old 10 nm filter with the new 5 nm filter.
Despite being rated for smaller particle size, the old 10 nm filter outperformed the new 5 nm filter during testing, with less than half the amount of particles larger than 24 nm discovered downstream.
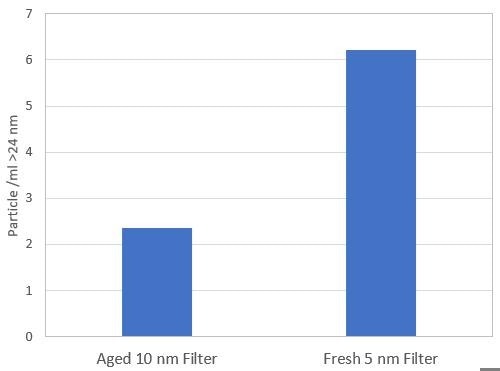
Figure 10. Particles larger than 24 nm measured downstream after filtration in the wafer cleaning tool. Image Credit: Particle Measuring Systems
These findings show how the predicted effectiveness of particle filters based on manufacturer specifications can differ from reality. One possible explanation for the performance discrepancy between the two filters is that the newer filter is not yet operating at its peak filtration efficiency.
Chem 20 provides real-time data, allowing users to analyze the actual effectiveness of their particle filters.
Chem 20 can assess older filters' functionality to determine whether they are still functioning well or nearing the end of their useful life and should be replaced. It can also be useful for determining whether new filters are filtering at peak efficiency before they are used in production.
Mask-Blank Manufacturers
Photomasks transfer the small, very complex circuit patterns for semiconductors onto the wafers.
Mask blanks must be cleaned after fabrication to eliminate residual particle contamination, which can affect the integrity of the transferred circuit patterns. Hence, the fluid employed for cleaning must be free from particle contamination.
Figure 11 depicts the results of particle measurements performed with Chem 20 fitted in a mask blank cleaning tool. Chem 20 is attached when fresh cleaning fluid is introduced into the cleaning bath.
Measurement was taken initially using the standard configuration that would be utilized normally during the cleaning process and then again after installing an extra filter right before the sample point.
A measurement was first performed with only ultrapure water (UPW) as the cleaning fluid, and then it was repeated with a potassium hydroxide (KOH) solution.
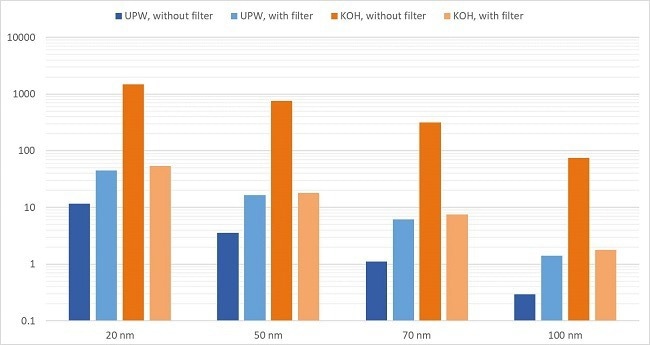
Figure 11. Particle measurement results in the mask-blank cleaning bath with UPW and KOH. Image Credit: Particle Measuring Systems
The findings with UPW were unexpected, with particle concentration greater after installing the filter. The reason for this remained unknown; however, the UPW was already very clean, and particles might have entered the system when the filter was installed.
When the test was repeated using a less clean KOH solution, the particle concentration dropped by more than an order of magnitude.
In this scenario, Chem 20 data informs the manufacturer that employing the additional filter with UPW as the cleaning liquid did not provide any benefit, but it provided a considerable benefit when KOH was used as the cleaning liquid.
Process Tool Manufacturers
Wet process equipment is widely used in semiconductor manufacturing plants, where various chemicals are used for cleaning, plating, etching, developing, and other wet process applications. Such instruments will likely include several active components, such as pumps, filters, and valves, which can generate or shed particle contamination.
The instruments also have several internal surfaces that can act as particle ‘traps’, increasing the time required for the tool to clean up. Consequently, process tools can require extensive post-manufacture cleansing before being used in production.
Figure 12 depicts a concept for evaluating particle cleanliness of a single wafer wet process cleaning tool using Chem 20 at the equipment manufacturer facility.
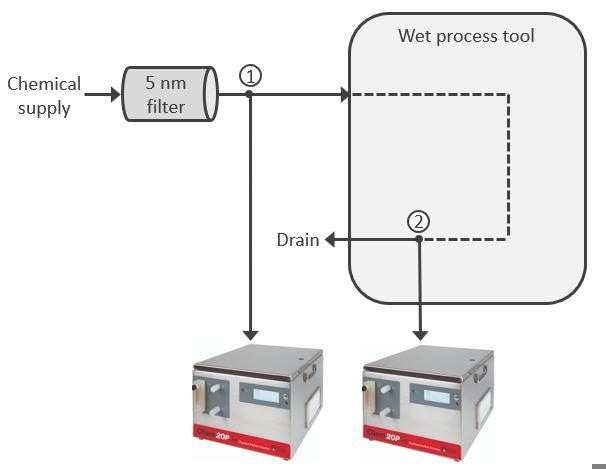
Figure 12. Schematic of measurements performed on a wet process tool at the equipment manufacturer. Image Credit: Particle Measuring Systems
Particle measurements on the fluid entering the wet process tool (Sample point 1), filtered immediately upstream to 5 nm, and the fluid exiting the tool (Sample point 2) can be used to identify how many particles the tool is adding to the outgoing fluid.
Figure 13 summarizes the results from both sample points after approximately 10 hours of flushing.
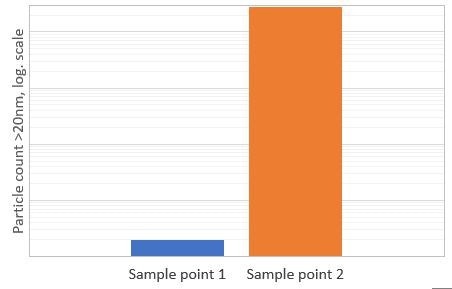
Figure 13. Particle measurement results on a wet process tool at the equipment manufacturer. Image Credit: Particle Measuring Systems
The particle concentration at Sample Point 1 was extremely low, as would be expected immediately downstream from a 5 nm filter.
However, the particle concentration at Sample Point 2 increased by many orders of magnitude, demonstrating that this tool continued to release a considerable amount of particle contamination even after ten hours of flushing.
Generally, the tool manufacturer has a final particle cleanliness standard that must be satisfied, and they will flush the tool until it is clean enough. Chem 20 enables such particle qualification inspections to be done effortlessly in real time.
In addition to qualification and overall particle cleanliness tests, Chem 20 may be employed to troubleshoot particle contamination issues and detect high-contamination components that need to be replaced. Figure 14 compares particle readings from a photoresist coater and developer track.
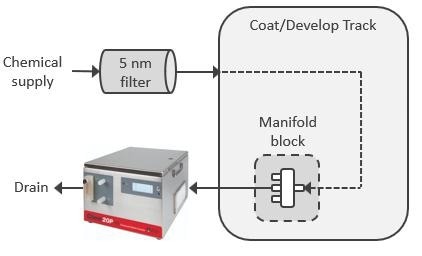
Figure 14. Schematic of measurement performed on a coater and developer track at the equipment manufacturer. Image Credit: Particle Measuring Systems
Chem 20 sampled a trademarked photoresist thinning agent connected to the POU via the chemical dispensing nozzle. Because this compound produced significant molecular scattering, Chem 20 worked in high-scatter mode, with the size sensitivity decreasing slightly to 24 nm.
The tests were conducted sequentially from several tracks, with the tool manufacturer also doing SP5 wafer scanning tests in parallel. The findings are summarized in Figure 15.
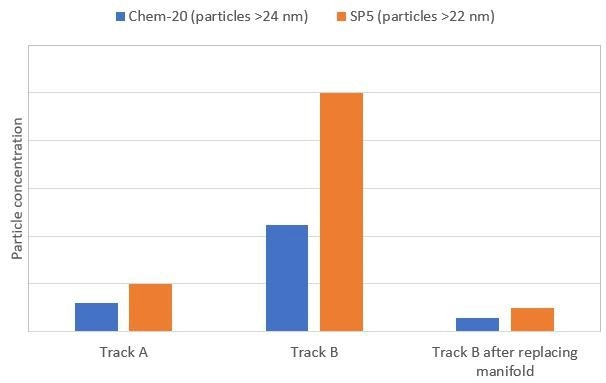
Figure 15. Particles measured on a coater and developer track at the equipment manufacturer. Image Credit: Particle Measuring Systems
After some troubleshooting, an aged manifold block within Track B was replaced, and the experiment was repeated. Chem 20 and SP5 analyses measured significantly larger particles at Track B than at Track A.
After replacing the manifold block, the particle concentration was reduced by one order of magnitude and was lower than at Track A. In addition, Chem 20 measurements correlated consistently with the SP5 wafer scanning test results.
Although the SP5 tests detected a greater number of particles during each test, this was not surprising, given that they measured particles of a smaller size.
Because wet process equipment comprises many components that might cause particle contamination, the capability to troubleshoot highly contaminating components in real time without the requirement for offline laboratory analysis is a huge advantage to equipment manufacturers.
Conclusion
Chem 20 has effectively controlled and mitigated yield-impacting nanoparticle contamination in process chemicals throughout the microelectronic sector.
The examples presented in this article illustrate how chemical suppliers, process equipment manufacturers, semiconductor manufacturers, and photomask manufacturers can use Chem 20 for various applications, such as verifying the cleanliness of outgoing and incoming chemical batch deliveries, evaluating filter performance, and analyzing process tool cleanliness.
Particle data provided by Chem 20 has also been successfully used to troubleshoot particle contamination sources and identify and validate possible improvement areas.
As the critical particle size for the most sophisticated technology nodes continues to reduce, the cleanliness of the chemical media, process equipment, and materials utilized in their fabrication will become increasingly important in determining the yield of these devices.
With an industry-leading 20 nm sensitivity, Chem 20 can detect particles as close as possible to the critical dimension size.

This information has been sourced, reviewed and adapted from materials provided by Particle Measuring Systems.
For more information on this source, please visit Particle Measuring Systems.