Sponsored by B&W TekReviewed by Olivia FrostNov 28 2023
Raman spectroscopy is an analytical technique that allows for the assessment of molecular structure and the identification of materials by examining the rotational and vibrational modes of molecules. The majority of commercial Raman systems in labs cover a spectral range from 200 to 3400 cm-1.
The B&W Tek i-Raman Plus BAC102 probe extends this range, accessing lower-frequency modes down to 65 cm-1, offering an affordable way for more comprehensive measurements.
This expansion into lower frequencies is particularly valuable for applications in protein characterization,1 polymorph detection and identification,2 as well as material phase and structural determination.
The low-frequency region of the Raman spectrum enhances the information available from the fingerprint region and expands the potential applications in molecular analysis, including the detection of hydrogen bonds. This leads to heightened detection sensitivity and improved differentiation of materials that are otherwise very similar.
Amino Acids
Raman spectroscopy is a contemporary approach to examining the structure and conformation of these protein building blocks. Specifically, the vibrational details in a Raman spectrum aid in interpreting molecular interactions and biological processes.3
Unlike numerous substances that lack peaks below approximately 400 cm-1, the low-frequency segment of the Raman spectrum plays a crucial role in providing essential information for a thorough examination of amino acids. This becomes evident when examining the complete Raman spectrum of L-asparagine, spanning the range from 65 to 3200 cm-1 (Figure 1).
Figure 1 displays both the fingerprint area (blue) and the low-frequency Raman zone (red) for L-asparagine, showcasing three prominent bands below 200 cm-1.
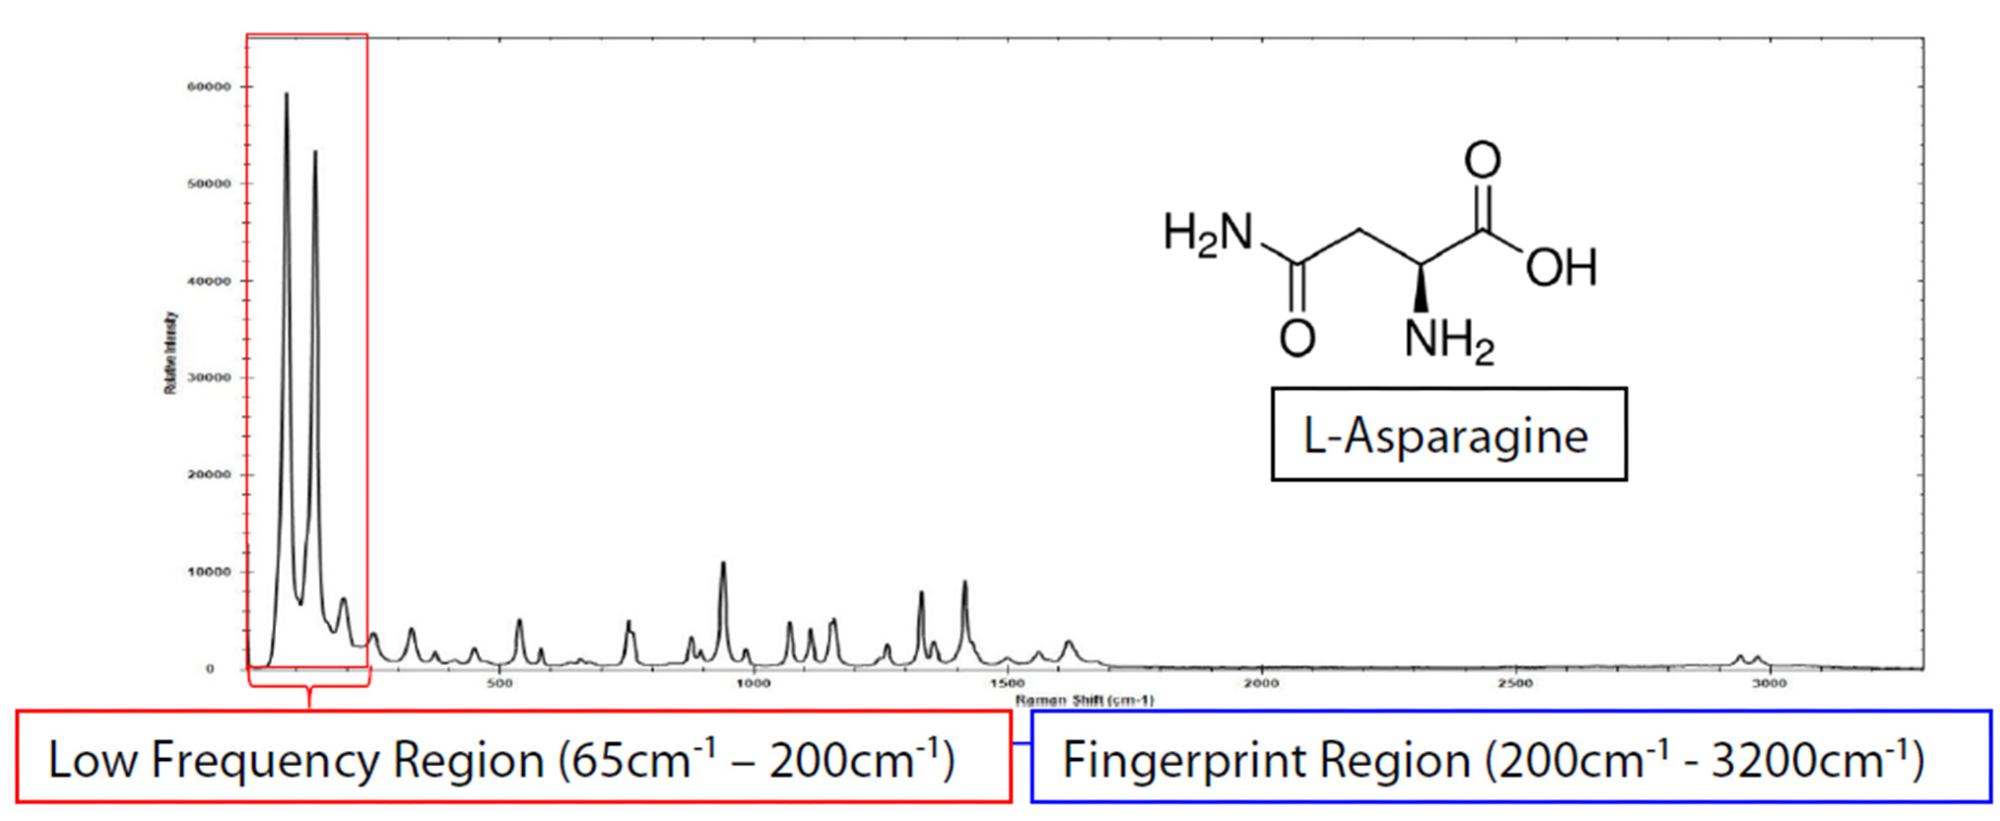
Figure 1. i-Raman Plus and a BAC102 E-grade probe were used to collect the low-frequency spectra of L-asparagine with a total integration time of 1.2 s. Image Credit: B&W Tek
Experiment
In this application, the i-Raman Plus 785S, a laboratory Raman spectrometer by B&W Tek, was employed. This instrument harnesses the patented CleanLaze® technology and utilizes a 785 nm laser excitation source with an impressively narrow linewidth of less than 0.2 nm and a maximum power output of 300 mW.
Equipped with a sensitive TE-cooled, back-thinned CCD and a BAC102 E-grade probe, this setup allows data collection across a wide spectral range of 65–33500 cm-1 at a spectral resolution of 4.5 cm-1.
Raman spectra was captured at room temperature using laser powers ranging from 300 mW with integration times varying between 100 milliseconds to 10 seconds (Table 1).
Source: B&W Tek
| Equipment |
Acquisition settings |
| i-Raman Plus 785S |
Laser Power |
300 mW |
| BAC102 probe |
Integration time |
1.2 s |
| BWSpec software |
Averages |
1 |
Results: Polymorph Detection
Identifying the structural composition of active pharmaceutical ingredients (APIs) is crucial in the pharmaceutical field, especially in drug development, production, and quality checks.
APIs display polymorphism—similar chemical composition but distinct solid-state structures. These variations can impact drug effectiveness, potentially compromising its efficacy.2
Pseudopolymorphs include solvents suspended in a lattice structure. In Figure 2, an instance of pseudo-polymorph D-glucose demonstrates the E-grade probe's capability to discern differences between the monohydrate and anhydrous forms at frequencies below 200 cm-1.
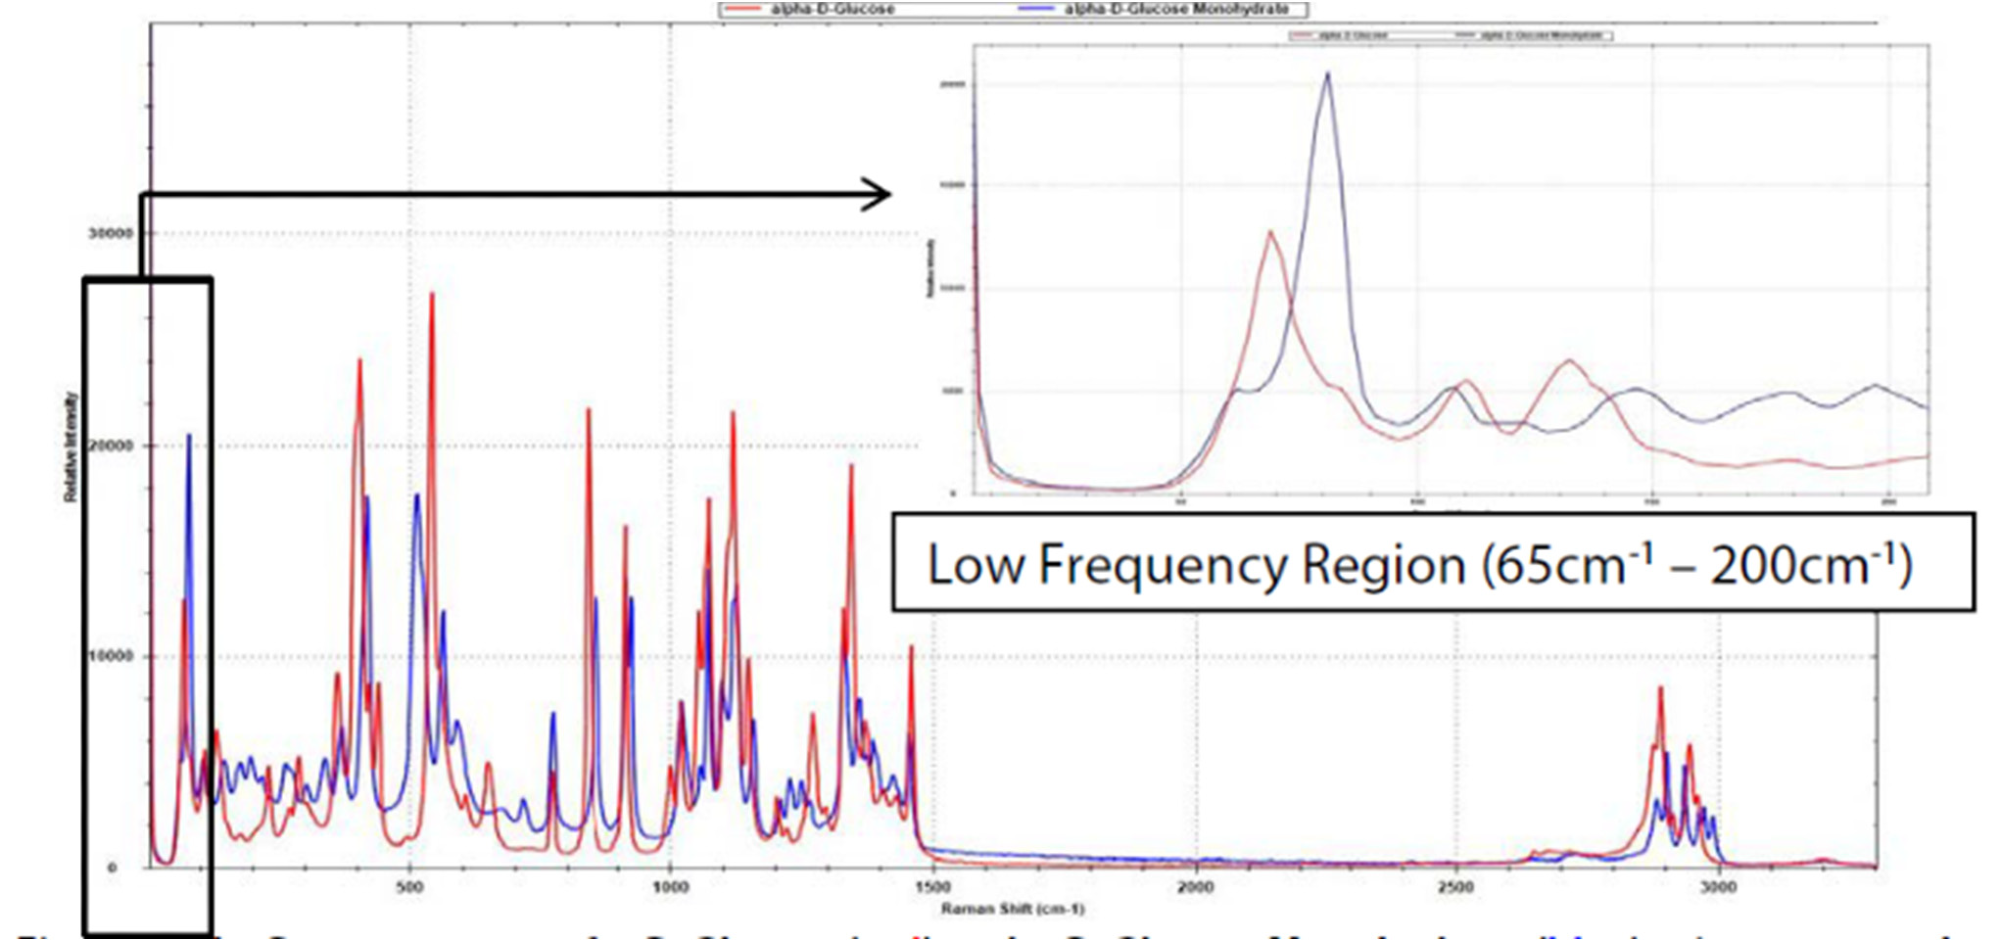
Figure 2. Raman spectra of α-D-glucose (red) and α-D-glucose monohydrate (blue), taken with 10 s integration time. Note the significant difference between the two pseudo-polymorphs within the low-frequency range (see inlay). Image Credit: B&W Tek
Results: Monitoring Phase Change
An exceptionally specific tool is needed to effectively monitor phase changes, such as crystallization, in chemical processes. To this end, the low-frequency E-grade probe has demonstrated its capability to monitor these phase changes, as exemplified in the case of sulfur (Figure 3).
In this experiment, solid α-sulfur was positioned on an aluminum tray and subjected to heating with a hot plate. Raman spectra were subsequently acquired using both the E-grade probe and the i-Raman Plus spectrometer. The examination covered both the solid and liquid phases, with laser power set at 100% (approximately 300 mW) and an integration time of 0.1 seconds.
Following the heating of the sample beyond its melting point at 115.2 °C, there was an observable broadening and shift in the low-frequency peak at 83.6 cm-1, signaling the transition from the α-form to the λ-form. It is worth noting that there were no noticeable alterations in the fingerprint region (see Figure 3).
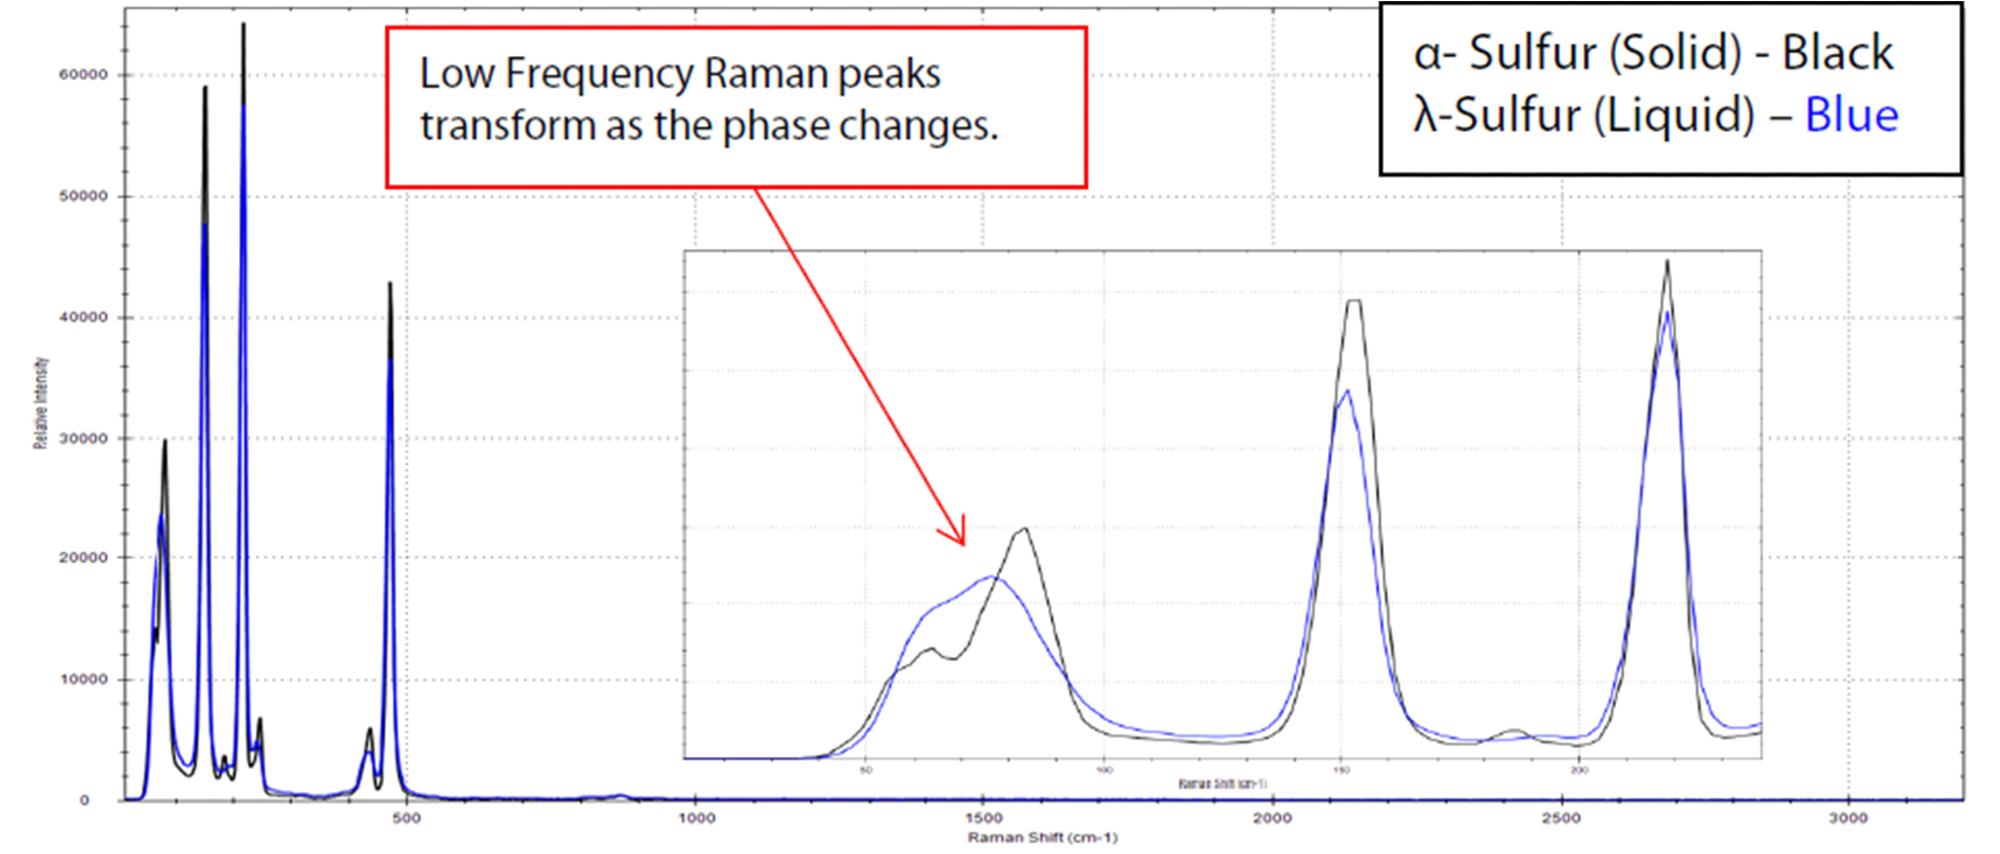
Figure 3. Raman spectra of sulfur transitioning from the α-crystalline form to the λ-liquid form, taken with 0.1 s integration time. Note significant broadening in the peaks located in the low-frequency region (see inlay). Image Credit: B&W Tek
Conclusion
The i-Raman Plus 785S Raman spectrometer, in tandem with the low-frequency E-grade probe, has proven to be a valuable tool for applications demanding detection as low as 65 cm-1. This capability to characterize polymorphs and solvated forms can help pharmaceutical and biological industries in their manufacturing and formulation processes.
Besides protein, polymorph, and phase characterization, low-frequency Raman spectroscopy finds utility in exploring semiconductor lattices,4 carbon nanotubes,5 solar cells, as well as various minerals, pigments, and gemstones.
References
- Teixeira, A. M. R.; Freire, P. T. C.; Moreno, A. J. D.; et al. High-Pressure Raman Study of l Alanine Crystal. Solid State Communications 2000, 116 (7), 405–409. https://doi.org/10.1016/S0038-1098(00)00342-2.
- Larkin, P. J.; Dabros, M.; Sarsfield, B.; et al. Polymorph Characterization of Active Pharmaceutical Ingredients (APIs) Using Low Frequency Raman Spectroscopy. Appl Spectrosc 2014, 68 (7), 758–776. https://doi.org/10.1366/13-07329.
- Golichenko, B. O.; Naseka, V. M.; Strelchuk, V. V.; et al. Raman Study of L-Asparagine and L Glutamine Molecules Adsorbed on Aluminum Films in a Wide Frequency Range. Semicond. Phys. Quantum Electron. Optoelectron. 2017, 20 (3), 297–304.
- Smith, E.; Dent, G. Modern Raman Spectroscopy: A Practical Approach, 2nd ed.; John Wiley & Sons, 2019.
- Pelletier, M. J. Analytical Applications of Raman Spectroscopy, 1st ed.; Blackwell Science: Oxford, 1999.

This information has been sourced, reviewed and adapted from materials provided by B&W Tek.
For more information on this source, please visit B&W Tek.