The term “bioethanol” refers to ethanol that is used as a fuel or or an additive in fuel. It is primarily sourced from sugar, starch, or lignocelluloses through biochemical processes.
Sugar can be fermented directly, while starch and celluloses require additional process steps to break them down into smaller sugar molecules. Starch and celluloses, also called oligo or polysaccharides, require a process by the name of enzymatic hydrolysis to disaggregate them into monosaccharides.
Originally, only sugars and starch from food crops like sugar beet and sugar cane were used as raw materials. However, there have been growing concerns that the use of these crops for fuel production will lead to serious competition for these feedstocks, resulting in rising food prices and regional shortages.
To tackle this issue, new feedstock sources and fuel production methods have emerged. They are based on non-food feedstocks, such as biomass residue from agriculture, paper, or timber industry (e.g., straw, sugar beet, sawdust, bark, and paper waste).
While this approach offers a viable alternative, it still contends with agricultural land use. Third-generation biofuels offer a solution by using non-food materials grown in areas unsuitable for agriculture (e.g., algae in microalgae reactors).
Today, algae is currently commercially employed for bioethanol production. Algae are specially modified to maximize starch yield and ensure profitability in ethanol production. This advanced generation of sustainable green fuels further aids in reducing CO2 emissions.
Over the past decade, ethanol production has more than doubled, owing to increased demand from the transportation sector. This surge stems from the need to swiftly reduce CO2 emissions, with sustainable fuels being the fastest method when integrated with fossil fuels.
The U.S. Department of Energy, referencing an analysis by Argonne National Laboratory, states that considering entire life cycles, both corn and ethanol have cut greenhouse gas emissions by an average of 34% compared to traditional fuels.
Depending on the feedstock used, cellulosic ethanol shows emission reductions ranging from 51% to 88% when considering land-use change emissions.1
To achieve this, various proportions of bioethanol are blended. Common blends like E5, E10, E15, and E85 denote the volume percentage of added alcohol. Most standard cars can handle blends up to E10 without modifications to their engine or fuel system, while any other blend requires flexible fuel vehicles (FFVs).
Pure bioethanol, labeled as E100, can be used but requires specialized engines. Sulfur naturally occurs in biobased feedstocks used for ethanol production unless it is eliminated during the production process.
This becomes crucial, especially when bioethanol is utilized as a fuel blend component or in its pure form, as sulfur-containing compounds contribute to air pollution through the formation of SO2. Similar to traditional fuels, they are rigorously monitored for their sulfur content and must meet strict permissible limits, such as 10 ppm in the European Union.
Analytical standards and product specifications (like ASTM D4806, D5798, DIN EN 15376, 15293) aid in ensuring compliance. Bioethanol, in general, serves as a high-purity additive, with expected sulfur impurities being nearly 1 ppm S or less.
This, along with its high oxygen content, demands a highly sensitive analysis method capable of detecting sulfur levels at sub-ng levels, unaffected by the sample’s high oxygen content.
Among various sulfur analysis techniques, combustion elemental analysis with UV-fluorescence detection stands out as the most suitable for this analytical challenge. The most commonly used analysis standards include ASTM D5453, DIN EN ISO 20846, and DIN EN 15486.
Beyond fuel production, ethanol can also be used in a variety of other ways. One notable way is in food production, as a beverage, flavor enhancer, or as an ingredient in pharmaceuticals and disinfection agents for health purposes.
In cosmetics, it acts as a carrier and solvent for creams, cleansers, and perfumes. Ethanol also plays a role in household products like detergents, antifreeze, and cleaning agents, as well as in paint and resin production.
Ethanol serves as a feedstock for the chemical industry, used in the production of various chemicals like 2-ethoxy2-methylpropane (ETBE), acetic acid (vinegar), ethene, ethyl acrylate, ethylene chloride, acetaldehyde, and more. Outlined below is a method specifically designed to enhance the speed and reliability of the determination of ultra-trace sulfur impurities:
This method, initially devised for pure alcohols like ethanol and methanol, is equally applicable to fuel blends with varying ratios of these alcohols and other matrices with high oxygen content (e.g., oxygenates).
Materials and Methods
Samples and Reagents
- Four alcohol samples of different grades, two for ethanol and two for methanol
- Kit calibration solutions ranging from 0.1 to 10 mg/L S (Analytik Jena GmbH+Co. KG, 402-889.070)
Sample Preparation
The samples and standards underwent direct analysis without any pre-treatment.
Calibration
Before measurements were conducted, the multi EA 5100 underwent calibration for sulfur determination. Liquid standards containing dibenzothiophene (S) in isooctane within the concentration range of 0.1 to 10 mg/L S were utilized, with a blank correction applied.
The calibration obtained was further validated using certified materials. Injection volumes of 40 µL were used for both calibration and verification measurements. Figure 1 illustrates the calibration curve for the ultra-trace range, showcasing its performance data as an example.
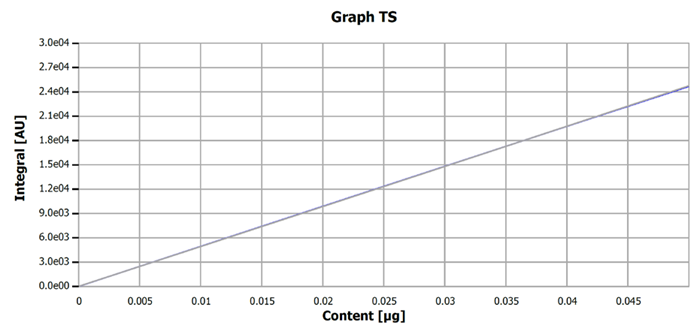
Figure 1. Example calibration curve for the sulfur determination, ultra-trace range. Image Credit: Analytik Jena US
Table 1. Performance data of sulfur calibration. Source: Analytik Jena US
| Parameter |
Value |
| Injection volume |
40 μL |
| Range |
0 - 0.05 μg S absolute |
| Detection limit |
3.56 μg/L S |
| Linearity |
linear |
| Correlation coefficient |
0.99999 |
Instrumentation
A multi-EA 5100 analyzer with HiPerSens UVFD for the determination of sulfur was used in vertical operation mode. Additionally, a multi-matrix autosampler type MMS in liquids mode facilitated the fully automated injection of liquid samples via a syringe, with a 40 µL volume injected for both samples and standards.
If required, the MMS can be cooled to prevent evaporation from taking place too soon, which could result in sample loss or vigorous combustion. Sample digestion occurred through efficient catalyst-free high-temperature combustion within a quartz glass tube.
Thanks to the quartz pyrolyzer and automatic monitoring and adjustment of process parameters, samples underwent complete and quantitative combustion.
The process comprises two phases. Initially, volatile components within the sample are evaporated using an inert gas stream. Subsequently, the formed gaseous products undergo combustion in an oxygen-rich atmosphere during the second step.
In this latter phase, heavier, non-volatile sample components and the products of pyrolysis are thoroughly oxidized in pure oxygen.
The system’s auto-protection feature and high-performance dryer ensure top operational safety (by trapping particles and aerosols) and enable swift, complete transfer of the resulting SO2 to the UV-fluorescence detector, minimizing condensation losses. With the multi EA 5100, detection limits as low as 5 μg/LS can be achieved.
Method Parameters
The analysis of both standards and samples utilized a method from the standard library. The key process parameters are outlined in Table 2. Specifically, the injection volume for the determination of total sulfur (TS) was established at 40 µL, facilitated by the MMS autosampler.
Evaluation Parameters
Table 3 summarizes the key parameters and metrics used in the evaluation of sulfur contents (TS) through UV-fluorescence detection.
Table 2. Process parameters multi EA 5100 – vertical operation. Source: Analytik Jena US
| Parameter |
Setting |
| Furnace temperature |
1050 °C |
| Furnace mode |
vertical |
| 2nd combustion |
60 s |
| Ar flow (1st phase) |
150 mL/min |
| O2 main flow |
200 mL/min |
| O2 flow (2nd combustion) |
150 mL/min |
| Draw up speed |
2.0 μL/s |
| Injection speed |
0.5 μL/s |
Table 3. Detection parameters for sulfur determination (UVFD). Source: Analytik Jena US
| Parameter |
Setting |
| Max. integration time |
360 s |
| Start |
0.2 ppb |
| Stop |
0.5 ppb |
| Block |
7 |
Results and Discussion
The outcomes from the analyses of both samples and standard solutions are consolidated in Table 4, reflecting the average values derived from three repeated measurements. Analyzing methanol and ethanol samples posed no challenges; their high repeatability is evidenced by the notably low Relative Standard Deviation (RSD) values.
This level of consistency in the analysis aligns closely with that of the standard solutions, demonstrating results that correspond well to specified concentrations with convincingly low standard deviations.
A significant observation from these experiments is the variance in sulfur-containing compounds depending on the production approach. A prime example of this is apparent in the comparison of two different ethanol samples.
Table 4. Results of sulfur determination of the given alcohol and standard samples. Source: Analytik Jena US
| Sample |
cS ± SD [mg/L] |
RSD [%] |
| Ethanol 1 |
2.61 ± 0.01 |
0.26 |
| Ethanol 2 |
5.49 ± 0.16 |
2.01 |
| Methanol 1 |
0.90 ± 0.02 |
1.86 |
| Methanol 2 |
0.85 ± 0.01 |
1.74 |
| Standard 1.10 mg/L S |
1.15 ± 0.01 |
1.05 |
| Standard 5.00 mg/L S |
5.06 ± 0.02 |
0.45 |
The measurement curves likely illustrate the process or results of sulfur determination for both samples and standard solutions.
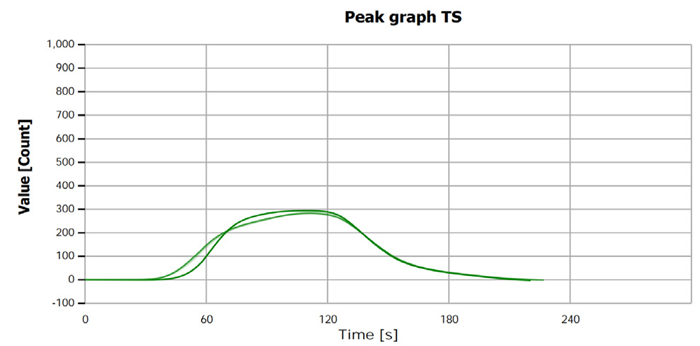
Figure 2. TS measurement curve for sample “Ethanol 1”. Image Credit: Analytik Jena US
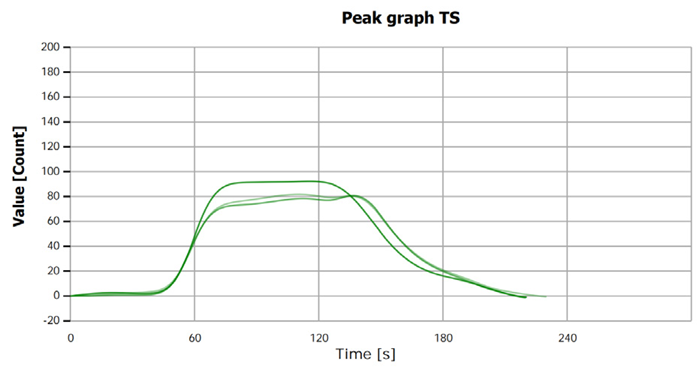
Figure 3. TS measurement curve for sample “Methanol 2”. Image Credit: Analytik Jena US
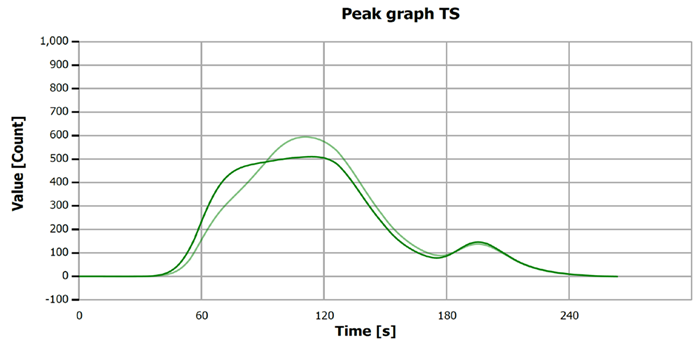
Figure 4. TS measurement curve for “Standard 5.00 mg/L S”. Image Credit: Analytik Jena US
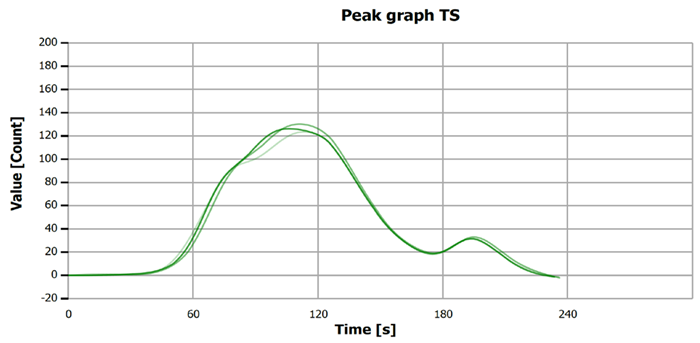
Figure 5. TS measurement curve for “Standard 1.10 mg/L S”. Image Credit: Analytik Jena US
Summary
Using the multi-EA 5100 alongside the MMS autosampler in vertical mode facilitates a direct and rapid analysis of trace sulfur in light, volatile, and ultra-pure alcohol.
This setup is particularly advantageous for determining element contents close to detection limits in highly volatile hydrocarbons like methanol. The cooling option for sample introduction becomes crucial, ensuring dependable results regardless of the matrix volatility.
Automatic optimization of the combustion process establishes optimal digestion conditions for any organic matrix, preventing incomplete combustion and system contamination. The analyzer’s method library offers ready-to-use, standard-compliant analysis methods, eliminating the need for manual adjustments.
A single method is enough to analyze the full spectrum of the given samples, independent of their concentration. This eliminates the need for matrix-specific method development and ensures optimal result comparability.
If necessary, the analysis system’s capabilities can be expanded by additional modules to aid in the determination of nitrogen, chlorine, and/or carbon contents. If sulfur is the only focus, the compEAct S elemental analyzer is a well-suited alternative, enabling remote operation of the analyzer.
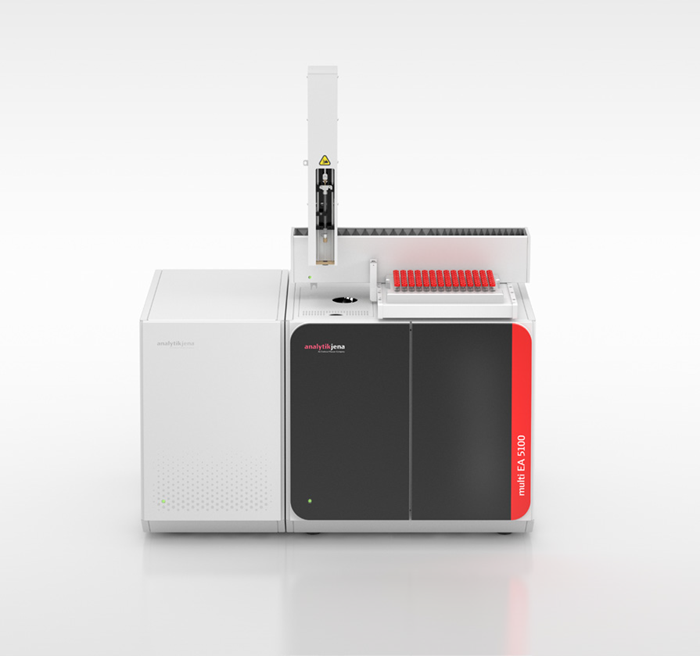
Figure 6. multi EA 5100 with MMS autosampler. Image Credit: Analytik Jena US
Table 5. Overview of devices, accessories, and consumables. Source: Analytik Jena US
| Article |
Article number |
Description |
| multi EA 5100 |
450-300.011 |
multi EA 5100 – combustion elemental analyzer |
| C/N/S high performance drier kit |
450-300.012 |
High performance reaction gas drier |
| S module basic |
450-300.021 |
Extension of multi EA 5100 for sulfur determination with UV-fluorescence |
| Multi Matrix Sampler |
450-300.030 |
For automatic sample supply |
| Liquids kit for MMS |
450-300.033 |
Extension of the MMS for automated dosing of liquids |
| multiWin software |
450-011.803 |
Operation and data evaluation software for multi EA 5100 inclusive method library |
References
- Ethanol Basics Fact Sheet - U.S. Department of Energy, p. 3

This information has been sourced, reviewed and adapted from materials provided by Analytik Jena US.
For more information on this source, please visit Analytik Jena US.