The retrieval of valuable metals like gold, silver, platinum, and palladium from discarded electronic devices is an integral part of recycling electronic waste. This method aids in diminishing electronic waste, preserving natural resources, and establishing a sustainable reservoir of precious metals.
Electronic waste is a rapidly growing global problem due to the increasing use of electronic devices and their short life cycles. However, e-waste also represents a significant opportunity for recycling precious metals, which are often used in electronic components due to their excellent conductivity, durability, and resistance to corrosion.
The recycling of precious metals from e-waste is thus a crucial part of sustainable development as it reduces the environmental impact of mining and helps to conserve natural resources.
It also provides a secure and sustainable source of precious metals, which are essential for producing new electronic devices.
However, precious metal recycling from e-waste requires specialized equipment and expertise to extract the metals safely and efficiently.
Working with certified e-waste recycling companies that adhere to best practices for handling and processing e-waste is thus essential, especially when it comes to ensuring the safe recovery of precious metals while protecting human health and the environment.
The recycling process encompasses the collection and categorization of e-waste, followed by the utilization of diverse techniques like chemical leaching, smelting, and electrolysis for precious metal recovery.
The environmental impact of these technologies fluctuates depending on the specific method, material types and quantities, and the energy source utilized.
For instance, chemical leaching involves the use of acids and cyanide to dissolve precious metals, an effective but potentially hazardous process requiring proper handling and disposal to prevent harm to the environment.
Smelting, which involves heating and melting materials for metal extraction, demands substantial energy and can produce emissions if fossil fuels are the energy source.
Electrolysis, another method, uses an electric current for metal extraction. This demands a substantial amount of electricity, and if the energy source lacks renewability, it can lead to noteworthy greenhouse gas emissions and other environmental repercussions.
To mitigate the environmental impact of these processes for recycling precious metals, it is crucial to employ smart techniques for processing recyclables and utilize equipment capable of detecting even the smallest traces of precious metals.
This guarantees a moderate use of environmentally harmful chemicals in combination with a maximum recycling rate.
From a technical perspective, ICP-OES technology proves particularly apt for accurately detecting precious metal concentrations in the metal compound of recyclables.
While many ICP-OES analyzers proficiently handle base metal determination, their limited sensitivity and significant spectral interferences from the complex matrix often hinder the detection of precious metals.
The robust plasma of the PlasmaQuant 9100 Elite can effortlessly withstand metallurgical samples, providing long-term stability. High-resolution optics and a charge-coupled device (CCD) detector deliver excellent spectral resolution, enabling interference-free measurement through well-separated lines.
The CCD detector concurrently depicts emission lines and background intensities, facilitating automatic background correction.
A finely ground electronic waste sample underwent analysis for Ag, Au, Pd, and Pt using high-resolution (HR) ICP-OES on the PlasmaQuant 9100 Elite, equipped with an HF-Kit after microwave-assisted digestion in a mixture of HNO3, HCl, and HF.
Calibration standards were prepared from the same acid mixture, and robustness was tested from multiple emission lines per element and a spike recovery test.
Consistent contents of about 1200 (Ag), 80 (Au), 10 (Pd), and 1 mg/kg (Pt) were detected from two lines per element, with matrix-specific detection limits of 14 µg/kg (Ag), 60 µg/kg (Au), 100 µg/kg (Pd), and 140 µg/kg (Pt) achieved.
All emission lines, except Au 242, were free from interference, thanks to the High-Resolution Optics of the PlasmaQuant 9100 Elite.
Correction of direct line overlap of Au 242 by manganese was accomplished using the CSI software tool. Recovery rates for all metals fell within the range of 95% to 110% and could potentially be further enhanced with the use of an internal standard.
Materials and Methods
Sample Preparation
All laboratory equipment underwent washing with deionized (DI) water sourced from a PURELAB system (18.2 MΩ-cm, ELGA LabWater, High Wycombe, England).
The chemicals used were of analytical reagent grade. About 0.25 g of a finely ground electronic waste sample was precisely weighed (0.0001 g) and placed into a digestion vessel (DAK-100).
Subsequently, 2 mL of HNO3, 6 mL of HCl, and 2 mL of HF were added to the sample. The mixture was carefully swirled and left to stand for at least 15 minutes before sealing the vessel.
Subsequent heating was performed stepwise (160 °C for 5 minutes, 190 °C for 5 minutes, 210 °C for 5 minutes, 230 °C for 30 minutes) in a speedwave XPERT microwave digestion system. Afterward, the vessels were left to cool to room temperature to avoid foaming and splashing.
A saturated H3BO3 solution (10 mL) was added, and the complexation of free HF occurred at a temperature of 190 °C. The solutions were then transferred to a graduated polypropylene tube, diluted to 50 mL with DI water, and subjected to centrifugation (1125 xg, 10 minutes). The resulting supernatants were directly utilized for analysis.
Calibration
Multi-element stock solutions were prepared using single-element standard solutions (Merck, Sigma-Aldrich). Working standards were created through serial volume/volume dilution in polypropylene tubes of the stock solutions using an acidic mixture of 4% (v/v) HNO3, 12% (v/v) HCl, 4% (v/v) HF, and 20% (v/v) H3BO3.
Calibration levels for each element were selected based on expected concentration ranges, with three calibration standards employed for each element (see Table 1). Figure 1 illustrates selected calibration curves.
Table 1. Concentration of calibration standards. Source: Analytik Jena US
| Element |
Unit |
Cal. 0 |
Std. 1 |
Std. 2 |
Std. 3 |
| Ag, Au, Pd, Pt |
mg/L |
0 |
0.1 |
1 |
10 |
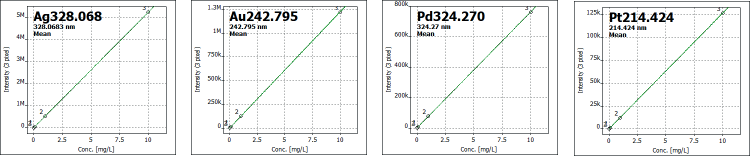
Figure 1. Selected calibration curves. Image Credit: Analytik Jena US
Instrument Settings
The analysis itself was conducted using a PlasmaQuant 9100 Elite ICP-OES, equipped with the HF-kit.
Sample introduction components were chosen to attain high sensitivity for trace elements in high-matrix samples while remaining resistant to hydrofluoric acid. Additionally, a Teledyne CETAC ASX-560 Autosampler was used in conjunction with the instrument. Detailed settings and components are summarized in Table 2.
Table 2. Instrument settings. Source: Analytik Jena US
| Parameter |
Specification |
| Plasma power |
1,200 W |
| Plasma gas flow |
12 L/min |
| Auxiliary gas flow |
0.5 L/min |
| Nebulizer gas flow |
0.7 L/min |
| Nebulizer |
Parallel path nebulizer, 1.0 mL/min, PFA |
| Spray chamber |
Cyclonic spray chamber, 50 mL, PTFE |
| Outer tube/Inner tube |
Syalon/Alumina |
| Injector |
Alumina, ID: 2 mm |
| Sample tubing |
PVC (black/black) |
| Pump rate |
1.00 mL/min |
| Fast pump |
4.00 mL/min |
| Measuring delay/Rinse time |
45 s/45 s |
| Torch position |
0 mm |
Method and Evaluation Parameters
Method parameters are shown in Table 3.
Table 3. Method parameters. Source: Analytik Jena US
| Element |
Line
[nm] |
Plasma
view |
Integration |
Read
time [s] |
Evaluation |
| Pixel |
Baseline fit |
Correction |
| Ag |
328.0683 |
axial |
Peak |
10 |
3 |
ABC1 |
- |
| Ag |
338.2891 |
axial |
Peak |
10 |
3 |
ABC |
- |
| Au |
197.7440 |
axial |
Peak |
10 |
3 |
ABC |
- |
| Au |
242.7950 |
axial |
Peak |
10 |
3 |
static |
CSI2 |
| Pd |
324.2700 |
axial |
Peak |
10 |
3 |
static |
- |
| Pd |
360.9550 |
axial |
Peak |
10 |
3 |
static |
- |
| Pt |
214.4240 |
axial |
Peak |
10 |
3 |
static |
- |
| Pt |
265.9450 |
axial |
Peak |
10 |
3 |
static |
- |
1 … Automated Baseline Correction
2 … Software tool for the correction of spectral interferences (see Figures 2 and 3)
Results and Discussion
It is a well-known challenge that emission lines from metals like copper, iron, and other transition metals can interfere with the analytical lines of specific elements, particularly impacting the determination of precious metals and platinum group metals (PGMs) in such matrices.
Matrix matching using pure standards or reference materials with minimal contamination for the elements of interest is usually recommended for calibration to address these challenges.
One effective solution to overcome these application issues is the utilization of high-resolution instruments capable of separating spectral interferences from the targeted analytical line.
The results presented here clearly showcase the substantial application advantages derived from the high resolution (2 pm @ 200 nm) of the PlasmaQuant 9100 Elite system compared to instruments with lower resolution. This allows for the selection of appropriate and sensitive analysis lines for the majority of elements.
The instrument's high sensitivity is attributed to the plasma geometry and efficient removal of the plasma tail using argon (recycled from optical system purge). Despite the system's high resolution, the most sensitive emission line of gold at 242.795 nm cannot be adequately separated in the complex matrix of electronic waste.
Comparing the spectra of the gold standard and the sample reveals differences in wavelength and emission spectrum shape, indicating that the sample spectrum is not solely gold (refer to Figure 2).
Using the spectra library integrated into the software, Mn was identified as the interfering element at a wavelength of 242.794 nm.
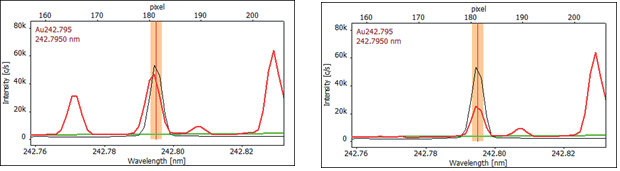
Figure 2. High-resolution spectra of Au 242.795 nm as recorded (left) and CSI corrected (right), showing the manganese interference on the gold spectrum (red: sample, black: calibration standard 1 mg/L Au, green: baseline correction (ABC)). Image Credit: Analytik Jena US
To address this interference, a spectral correction was conducted with a spectrum of the pure interferent. This correction spectrum was acquired by measuring a diluted single-element manganese standard, such as 100 mg/L Mn, specifically at the analytical line that required correction.
Figure 3 displays the correction spectrum and the correction model at 242.795 nm. Applying the CSI algorithm of spectral correction renders this highly sensitive gold line accessible for quantification.
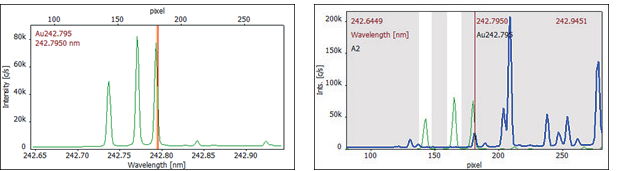
Figure 3. Correction spectrum of 100 mg/L Mn (left) and CSI correction model (right) (green: 100 mg/L Mn, blue: corrected sample spectrum). Image Credit: Analytik Jena US
All the results are presented in Table 4.
The detectability of low to sub µg/L concentrations in the measurement solutions corresponds to method limits of detection in the sub mg/kg range for all investigated elements.
The method's accuracy was validated through recovery measurements of 1 mg/L spikes in the measurement solution. As indicated in the result table, all the elements studied exhibit recovery values within the range of 95 to 110%.
Table 4. Electronic waste sample. Source: Analytik Jena US
| Element |
Line [nm] |
Mass fraction [mg/kg] |
RSD1 [%] |
LODinst2 [μg/L] |
LODmeth3 [mg/kg] |
Spike
recovery [%] |
| Ag |
328.068 |
1200 |
2 |
0.07 |
0.014 |
110 |
| Ag |
338.289 |
1250 |
1 |
0.08 |
0.016 |
110 |
| Au |
197.744 |
82.6 |
1 |
2.0 |
0.4 |
101 |
| Au |
242.795 |
84.3 |
0.8 |
0.3 |
0.06 |
104 |
| Pd |
324.270 |
9.5 |
0.7 |
0.8 |
0.16 |
102 |
| Pd |
360.955 |
7.6 |
1.5 |
0.5 |
0.10 |
103 |
| Pt |
214.424 |
1 |
6 |
0.7 |
0.14 |
96 |
| Pt |
265.945 |
(0.6)4 |
(14)4 |
1.2 |
0.24 |
95 |
2 … instrumental limits of detection determined in the calibration blank
3 … method limits of detection refers to 0.25 g sample in 50 mL
4 ... value is below limit of quantification of this emission line (LOQ = 3 x LOD), thus RSD value is affected by noise
Summary
In summary, the PlasmaQuant 9100 Elite is ideal for electronic waste applications. Its attributes, including high resolution, heightened sensitivity, and advanced software tools, facilitate the straightforward determination of precious metals in such materials.
The suitability of the system was demonstrated by using two different wavelengths per element and spike recovery tests.
Figure 4. PlasmaQuant 9100 Elite. Image Credit: Analytik Jena US
Table 5. Overview of devices, accessories, and consumables. Source: Analytik Jena US
| Article |
Article number |
Description |
| PlasmaQuant 9100 Elite |
818-09101-2 |
High resolution ICP-OES |
| speedwave XPERT |
819-5005000-2 |
Microwave Pressure Digestion System |

This information has been sourced, reviewed and adapted from materials provided by Analytik Jena US.
For more information on this source, please visit Analytik Jena US.