Contrary to their name, rare earth elements (REE) constitute a significant portion of the Earth's crust, where they exist dispersed among various minerals. The demand for REE has surged in recent years across user electronics, catalysis, optical displays, high-performance magnets, batteries, aerospace manufacturing, and medical applications.
As such, there is a need for reliable trace analysis procedures to assess potential mining sites, control processes (mostly involving rare earth oxides, REO), and ensure the quality of high-purity REE.
In addition, academic research in earth sciences exhibits considerable interest in the determination of REE at trace and ultra-trace levels in geology, geochemistry, and mineralogy.
The quantification of REE in geological materials through Inductively Coupled Plasma Optical Emission Spectrometry (ICP-OES) poses a formidable analytical challenge. The high matrix contents of digested samples, often containing substantial amounts of alumina, silica, sulfur, and refractory metals, demand exceptional plasma robustness.
This challenge intensifies when detecting trace levels of REE without resorting to sample dilution.
Adverse Rare Earth Oxides (REO) formation in the plasma tail and the substantial spectral interferences caused by numerous emission lines can impact the detection of REE when using techniques like Inductively Coupled Plasma Mass Spectrometry (ICP-MS) or Inductively Coupled Plasma Optical Emission Spectrometry (ICP-OES).
The PlasmaQuant 9100 Elite, equipped with a fast-sequential echelle-double monochromatic optical bench and versatile CCD detection, overcomes these hurdles.
It nearly doubles spectral resolution and halves total analysis time compared to currently available ICP-OES instrumentation with PMT detection exclusively used for REE analysis.
ICP-MS, a widely used analytical technique for REE determination, spans applications from raw materials like soils, rocks, and ores to impurities in highly refined rare earth products. This technique ensures rapid detection of multi-element REEs at concentrations down to the parts-per-quadrillion (ppq) range.
Despite its efficiency, scientists still face certain challenges in REE measurement, including polyatomic and isobaric interferences that quadrupole ICP-MS cannot resolve.
Collision gases prove useful in removing polyatomic interferences. The PlasmaQuant MS Elite, which features Collision Reaction Cell technology, offers an effective solution for such requirements. Moreover, analytical constraints imposed by sample preparation must be considered to obtain accurate analytical data.
Materials and Methods
To quantify REE, achieving complete sample digestion is crucial, as any insoluble residue can lead to an underestimated concentration of these elements.
When utilizing acid mixtures with hydrofluoric acid (HF), there is a risk of insoluble REE fluorides remaining in the precipitate. Refractory minerals like zircon, tourmaline, chromite, rutile, garnet, spinel, and corundum may not fully decompose under acid attack.
Decomposition by lithium metaborate and tetraborate fusion provides a complete decomposition of silicate phases and accessory minerals. However, this results in a higher amount of total dissolved solids (TDS).
As ICP-MS tends to be limited to TDS levels of less than 0.3% w/v, the fusion decomposition requires additional dilution before analysis.
For certain geological matrices, sintering with Na2O2 is an appealing analytical decomposition technique due to its rapid and effective mineral decomposition. The resulting sinter residue is easily dissolved and does not introduce high concentrations of reagent elements (e.g., Li, B) that could affect future analyses.1
Thus, this study adopted a sintering digestion in the presence of Na2O2. About 100 mg of sample, ground to pass a 200-mesh sieve, was thoroughly mixed with 600 mg of Na2O2 and sintered at 480 ± 10 degrees Celsius for precisely 30 minutes in a Carbolite muffle furnace (CWF 1200) using porcelain crucibles (30 x 30 mm) lined with aluminum sheet.
After cooling, the sinter residue was carefully transferred from the crucible to a 50 mL polypropylene tube, with ultrapure water added dropwise. Upon completion of the reaction, three drops of concentrated HCl and 2 mL of concentrated HNO3 were added.
The tube was filled to the mark with ultrapure water, and the final solution was homogenized using a vortex stirrer. ICP-OES measured all samples undiluted, while for ICP-MS analysis, samples were diluted ten-fold with 1% HNO3.
Samples and Reagents
- Reference Material GBW 7103
- Deionized water (> 18.2 MΩ cm, Millipore MiliQ)
- Nitric acid Supra-quality 69% (ROTIPURAN Supra)
- Sodium peroxide (Na2O2) finely powdered, reagent grade, 97% (SIGMA-ALDRICH)
Calibration
For ICP-OES, calibration solutions were prepared in a matrix-matched solution containing 12 g/L Na2O2 in 1% HNO3. The calibration concentrations ranged from 0.1 to 1 mg/L for all elements analyzed. For ICP-MS measurements, calibration solutions were prepared from high-purity, single and multi-element solutions (SIGMA-ALDRICH) in 1% HNO3 + 1.2 g/L of Na2O2. The calibration standards covered the concentration range from 0.25 to 25 μg/L for La, from 0.5 to 50 μg/L for Ce and Nd, and from 0.05 to 5 μg/L to Pr, Sm, Eu, Gd, Tb, Dy, Er, Ho, Tm, Yb, and Lu.
Instrumentation
The ICP-OES system employed an HF kit for sample introduction. Tables 1 and 2 list the system configurations for ICP-OES and ICP-MS, respectively.
Table 1. Configuration of the PlasmaQuant 9100 Elite, equipped with HF kit. Source: Analytik Jena US
| Parameter |
Settings |
| Plasma gas flow |
15.0 L/min |
| Auxiliary gas flow |
1.0 L/min |
| Nebulizer gas flow |
0.5 L/min |
| Nebulizer |
Parallel path nebulizer, PFA, 1.0 L/min |
| Spray chamber |
PTFE cyclonic, 50 mL |
| Injector |
Alumina, inner diameter 2 mm |
| Outer tube /Inner tube |
SiAlON/alumina |
| Pump tubing |
PVC |
| Sample pump flow |
1 mL/min |
| Rinse/Read delay |
60 sec |
| Integration time |
3 sec (3 replicates) |
| Plasma view |
axial |
Table 2. Configuration of the PlasmaQuant MS Elite. Source: Analytik Jena US
| Parameter |
Settings |
| Plasma gas flow |
9.0 L/min |
| Auxiliary gas flow |
1.35 L/min |
| Nebulizer gas flow |
0.97 L/min |
| iCRC settings |
No gas mode, Gas mode with Helium |
| Plasma RF power |
1,300 W |
| Dwell time |
30 ms |
| Scans per replicate |
10 |
| Acquisition mode |
Peak hopping, 1 pt/peak |
| Number of replicates |
5 |
| Pump rate/tubing |
8 rpm, black/black PVC |
| Sample uptake delay |
30 s |
| Stabilization time |
20 s |
| Ion optics |
Auto-optimized for highest sensitivity |
Results and Discussion
In ICP-MS, the formation of polyatomic species like MO+ and MOH+ is significantly influenced by the chemical nature of the respective element.
As oxide and hydroxide formation follows specific stoichiometric reactions, their contribution to an analyte signal can be corrected by a fixed numerical coefficient (correction equation), determined for the specific analysis conditions.
Cerium, for example, has a strong affinity for oxygen, with oxide levels of less than 2% being typical under optimized instrument conditions. Oxide interferences can be reduced to negligible levels by injecting a helium gas into the iCRC interference management system (Figure 1).
Thus, the CRMs were investigated by ICP-MS with helium as collision gas within the iCRC. No corrections for oxide and hydroxide polyatomic interferences were applied, though isobaric interferences were accounted for.
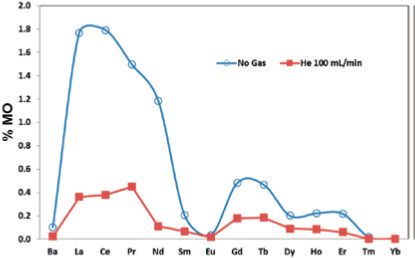
Figure 1. Image Credit: Analytik Jena US
Table 3 presents concentration values of REE in CRM GBW07103 (GSR-1) measured by HR ICP-OES and ICP-MS. Concentrations range from μg/kg to mg/kg, with excellent recoveries for both techniques.
ICP-OES analysis achieved RSD values below 2% for most elements, demonstrating that the precision attained with HR ICP-OES is well-suited for REE-trace analysis. Additionally, the total analysis time per sample, including rinse and read delays, was under 120 seconds.
Table 3. Results for CRM GBW07103 obtained by HR ICP-OES and ICP-MS. Source: Analytik Jena US
| Element |
CRM GBW 7103 (GSR-1)
Granite powder [mg/kg] |
HR ICP-OES PlasmaQuant 9100 Elite |
ICP-MS PlasmaQuant MS Elite |
| Measured [mg/kg] |
Recovery [%] |
MDL [mg/kg] |
Measured [mg/kg] |
Recovery [%] |
MDL [μg/kg] |
| La |
54 ± 4 |
53.4 |
99 |
0.14 |
60.9 |
113 |
3.5 |
| Ce |
108 ± 7 |
112 |
104 |
0.85 |
114 |
106 |
0.9 |
| Pr |
12.7 ± 0.8 |
12.2 |
96 |
1.55 |
13.2 |
104 |
0.6 |
| Nd |
47 ± 4 |
48.6 |
103 |
0.34 |
51.2 |
109 |
2.6 |
| Sm |
9.7 ± 0.8 |
9.23 |
95 |
0.65 |
10.6 |
108 |
2.7 |
| Eu |
0.85 ± 0.07 |
0.71 |
84 |
0.04 |
0.82 |
96 |
2.7 |
| Tb |
1.65 ± 0.09 |
n.a.* |
|
|
1.68 |
102 |
0.8 |
| Gd |
9.3 ± 0.7 |
10.3 |
111 |
0.36 |
9.69 |
104 |
1.4 |
| Dy |
10.2 ± 0.4 |
10.6 |
104 |
0.32 |
10.8 |
106 |
0.4 |
| Er |
6.5 ± 0.3 |
7.0 |
108 |
0.15 |
7.01 |
108 |
0.3 |
| Ho |
2.05 ± 0.17 |
2.22 |
108 |
0.11 |
2.24 |
109 |
1.6 |
| Tm |
1.06 |
n.a.* |
|
|
1.11 |
105 |
0.8 |
| Yb |
7.4 ± 0.5 |
7.67 |
104 |
0.34 |
8.23 |
111 |
1.5 |
| Lu |
1.15 ± 0.09 |
1.11 |
97 |
0.19 |
1.17 |
102 |
0.4 |
* this element was not analyzed by ICP-OES
The unique potential of the PlasmaQuant 9100 Elite becomes even clearer when inspecting the Nd/Ce-line pair at about 401.2 nm (Figure 2). With a line spacing of only 14 pm, the Nd 401.225 nm (orange) severely overlaps with Ce 401.239 nm (black) in conventional ICP-OES systems, and therefore, only a high-resolution ICP-OES can resolve the individual lines for analysis.
The Nd 401.225 nm is the most sensitive Neodymium line and is optimal for trace analysis.
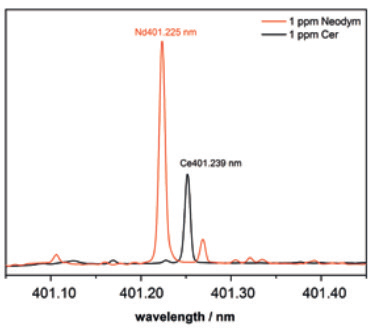
Figure 2. HR ICP optical emission spectra of the Nd 401.225 (orange) and the Ce 401.239 nm line (black) as in the highest calibration standard. Image Credit: Analytik Jena US
Summary
ICP-OES and ICP-MS stand out as ideal analytical techniques for the analysis of REE in geological samples owing to their multi-element detection capabilities.
The presence of line-rich emission spectra, isotope-rich mass spectra, and polyatomic interferences such as oxides demand high-performance and cutting-edge technological solutions to meet contemporary requirements.
ICP-MS, with its high detection power, proves especially advantageous, aided by collision cell techniques that help eliminate interferences. The enhancements made over the past decade have rendered these instruments reliable and user-friendly for routine applications, contributing to their widespread acceptance.
The high-detection power, especially for REE, enables detection limits in the ppt to ppb range, but an experienced operator is still essential for optimal performance, given limited matrix tolerance and the need for complex parameter optimization.
Elite ICP-OES systems, recognized for their robustness and reliability, serve as workhorses in many analytical laboratories. Improved optics and detector designs over the years have significantly lowered detection limits.
High-resolution instruments allow the use of typically interfered lines, making them well-suited for analyzing complex matrices. The user-friendly handling and robust introduction system enable analysis without prior sample dilution, catering to a wide range of applications.
Table 4 provides a concise summary of the potentials and limitations of both techniques, each demonstrating unique strengths and weaknesses.
ICP-MS, despite better detection limits, exhibits less matrix tolerance and higher running costs. On the other hand, ICP-OES, with its robustness and higher matrix tolerance, requires more frequent cleaning and careful configuration of the sample introduction system.
This comparison underscores the high performance of both analytical techniques for REE analysis in geological samples.
The PlasmaQuant 9100 Elite and the PlasmaQuant MS Elite offer outstanding features to overcome the challenges in the analysis of REE. Interference removal by either the high-resolution optical system or collision cell technology (iCRC), in combination with low gas consumption, underlines the high performance of these instruments.
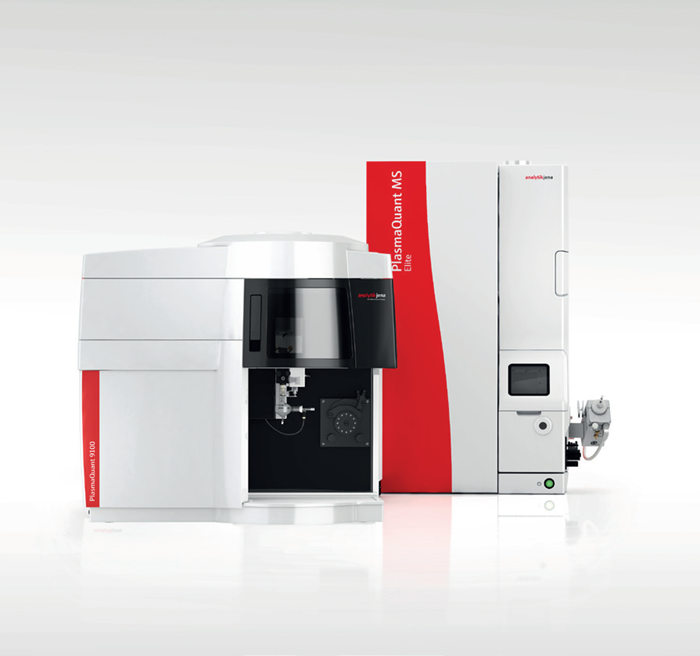
Figure 4. PlasmaQuant 9100 Elite and PlasmaQuant MS Elite. Image Credit: Analytik Jena US
Table 4. Comparison of potential and limitations for ICP-OES and ICP-MS. Source: Analytik Jena US
PlasmaQuant 9100
Elite HR-ICP-OES |
Potential/
Limitations |
PlasmaQuant MS
Elite ICP-MS |
- TDS > 30% are tolerated
- Direct analysis
|
Heavy matrix
(fusion or acid digest) |
- TDS typically < 0.3%
- Dilution strategies required
|
- Overlap of emission lines
- High resolution required
- Mathematical correction tools used
|
Spectral Interferences |
- Molecular interferences, e.g. REO
- Correction equations used
- Interference management systems required
|
- ng to μg/L or μg to mg/kg (ppmw)
|
Detection limits (DL) |
- pg/L to ng/L or ng/kg to μg/kg (ppbw)
|
- RSD typically < 3% for REE
- Recovery typically ± 5% for REE
|
Precision |
- RSD typically < 1% for REE
- Recovery typically ± 2% for REE
|
- High resolution with CCD
- Time saving single line
evaluation with automated algorithms
|
Throughput |
- High sensitivity allows short dwell times
- Fast wash-out using discrete sample introduction
|
- Workhorse for REE analysis with mg/kg detectability
|
Performance |
- Advanced analytical capabilities incl.
- highpurity REE, isotope ratio analysis and μg/kg
|
- Direct analysis
- Quick method development
- Robust system (sealed optic)
- Easy maintenance (cleaning)
|
Handling |
- Dilution strategies
- High operator skills
- More prone to contaminations
- Frequent cleaning required
|
- Lower cost of technology
- Glassware (consumables)
- Normal chemicals
- Less stringent lab requirements
|
Cost of Ownership |
- High costs of technology
- Consumables (cones, glassware)
- High purity chemicals
- High lab standard
|
References
- T. Meisel et al., Geostandard Newslett 2002, 26, 53-61.

This information has been sourced, reviewed and adapted from materials provided by Analytik Jena US.
For more information on this source, please visit Analytik Jena US.