A medium-sized refinery lab can process 250 samples per day, whereas a big refinery can process up to 500 samples daily.
Gas chromatographs, simulated distillation, flash and freeze point devices, densitometers, vapor pressure testers, RON and MON test engines, and other analytical equipment are often used nowadays.
Solid-state Raman spectroscopy can accurately, precisely, and quickly measure a variety of parameters of gasoline, jet fuel, and diesel fuel in seconds.
This study will discuss the methods for obtaining high-quality Raman spectroscopy spectra and the approach for converting the spectral data into actionable information to guide crucial decision-making processes.
Different fuel types, including gasoline, jet fuel, and diesel, will be analyzed, as well as component streams such as reformate, isomerate, and alkylate. Modeling methodologies will also be detailed to ensure a streamlined approach to laboratory workflow for technicians and operators.
What is Raman Spectroscopy?
Raman spectroscopy is a laser-based optical analytical technique that measures composition using the vibrational characteristics of molecules.
Samples are collected using a 785 nm excitation laser and a contact probe, which creates a unique spectral fingerprint that identifies a hydrocarbon's chemical content and molecular structure. The distribution of spectral peaks describes the molecule's composition, whereas signal intensity is proportional to concentration.
Discovered in the 1920s, Raman spectroscopy has revolutionized process analysis due to its nondestructive method of operation and ability to quantify sample composition.
However, the broader acceptance of this approach is due to improvements in the stability and mobility of solid-state Raman spectroscopy devices, as well as technological advances in lasers, optics, and detectors, which have made the technique faster and more accessible.
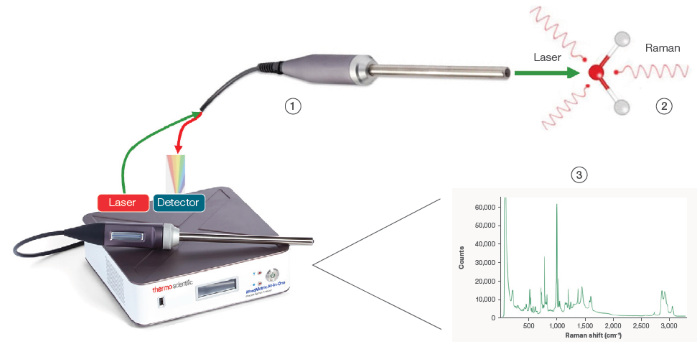
1 Laser light directed at sample. 2 Small portion of scattered light, Raman effect, returns through collection fiber to the detector. 3 System displays the Raman spectrum of the sample which is unique for every molecule (molecular fingerprint). Image Credit: Thermo Fisher Scientific – Portable and Handheld Process Raman Spectroscopy
Methodology
Measurement Collection
A Raman spectroscopy apparatus uses a vial holder to evaluate samples in 20 mL scintillation vials. Spectra are captured at 250 ms integration times.
Following spectrum collection, the chemometrics program automatically preprocesses the data, performs a discriminant analysis to determine the sample type, and then applies PLS regression models to that sample.
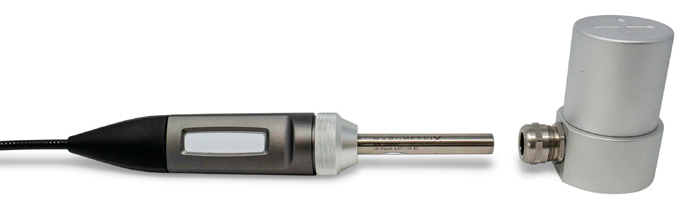
Vial holder accessory for laboratory measurement. Image Credit: Thermo Fisher Scientific – Portable and Handheld Process Raman Spectroscopy
Analysis
The analysis results are subsequently transmitted in a legible format to a Laboratory Information Management System (LIMS).
The operator’s workflow is very simple and designed to reduce bottlenecks. The operator inserts the sample into the vial holder, enters the unique ID, and hits the acquisition button on the program. The entire process takes about 15 seconds.
The Raman spectroscopy device can examine around 500 samples in an 8-hour shift or 1500 samples in 24 hours.
Sample capacity is also significantly reduced (20 mL) compared to the standard quart container, resulting in a smaller sample footprint and easy storage. Using a non-contact probe to evaluate fluid through the vial reduces sample handling.
Experimental Conditions
A total of 127 refined fuel samples were analyzed utilizing the Thermo Scientific™ MarqMetrix™ All-In-One Process Raman Analyzer. The sample consisted of 87 gasoline, 20 diesel, and 20 jet fuel samples.
The acquisition parameters were tuned for signal intensity and signal-to-noise ratio. All samples were measured using a Thermo Fisher Scientific vial holder. The acquired spectra were averages of 10 scans, each with a 250 ms acquisition time at 450 mW. All spectra were dark-subtracted. The total analysis time per sample was five seconds.
The generated spectra were processed by SOLO (Eigenvector). Models were created using either partial least squares (PLS) or partial least squares discriminant analysis (PLSDA). Cross-validation was employed to improve model calibration.
A holdout set was kept for the gasoline models to ensure model fidelity. Cross-validation results were used to estimate model correctness for the diesel and jet models. The reference data required to develop the model were gathered using the appropriate ASTM technique.
Source: Thermo Fisher Scientific – Portable and Handheld Process Raman Spectroscopy
| Products |
ASTM method |
Output |
| Gasoline |
D2699 |
RON |
| Gasoline |
D2700 |
MON |
| Gasoline |
D5191 |
Vapor pressure |
| Gasoline |
D5188 |
V/L ratio |
| Diesel |
D0093 |
Flash point |
| Diesel |
D0976 |
Cetane number |
| Diesel |
D2500 |
Cloud point |
| Jet |
D2386 |
Freeze point |
| Jet |
D0093 |
Flash point |
| All |
D0086 |
Distillation boiling points |
| All |
D4052 |
API gravity |
Experiment at a Glance
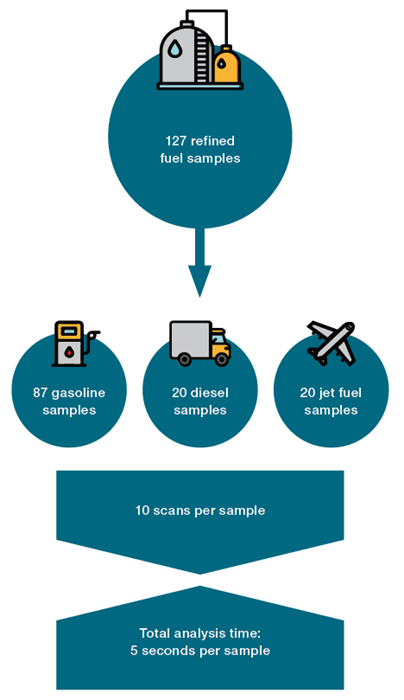
Image Credit: Thermo Fisher Scientific – Portable and Handheld Process Raman Spectroscopy
Results and Discussion
Two research avenues were pursued: fuel type classification and quantification of various fuel attributes.
Fuel Type Classification
PLSDA was applied to a dataset containing all the fuel spectra. The spectra were preprocessed with EMS and mean centering.
Figure 1A shows the mean EMSC spectra of each fuel type, revealing notable variances between them. The generated PLSDA model could easily distinguish between the fuel kinds. Figure 1B depicts the PLS score plot from the PLSDA model.
The success of the PLSDA model paves the way for many new applications and productivity improvements. Real-time categorization model applications can monitor product transitions, decreasing transmix waste while boosting safety and profitability.
The categorization model could also be applied in analytical laboratories to boost throughput.
The model is the initial stage in a pipeline that automatically switches between models and provides results depending on the type of fuel being evaluated.
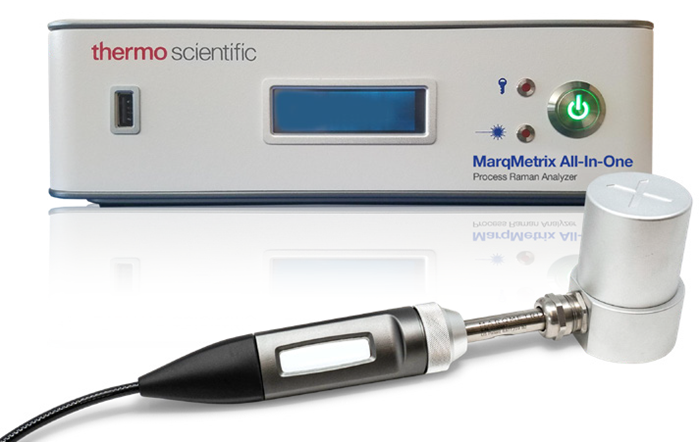
MarqMetrix All-In-One Process Raman Analyzer with a Thermo Scientific™ MarqMetrix™ Proximal Probe Sampling Optic and vial holder accessory for laboratory measurement. Image Credit: Thermo Fisher Scientific – Portable and Handheld Process Raman Spectroscopy
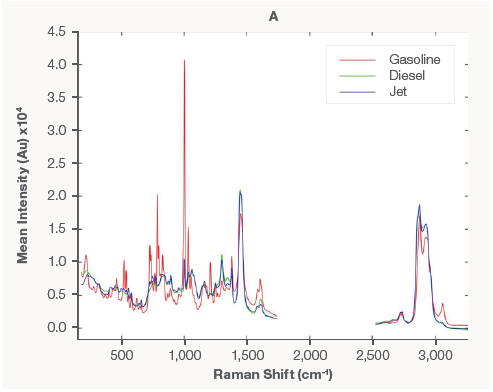
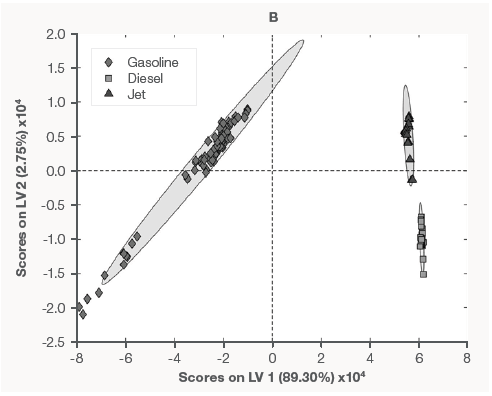
Figure 1. Mean preprocessed Raman spectra of each fuel type (A) and PLSDA classification model (B). Image Credit: Thermo Fisher Scientific – Portable and Handheld Process Raman Spectroscopy
Gasoline Fuel Properties
A total of 87 samples were utilized to develop models that predicted six fuel attributes for gasoline. Table 1 summarizes the properties modeled and the model's accuracy.
Table 1. Gasoline fuel properties and model accuracies. Source: Thermo Fisher Scientific – Portable and Handheld Process Raman Spectroscopy
| Property |
Accuracy |
| API (°API) |
0.26 |
| Benzene (Vol. %) |
0.026 |
| RON (O.N.) |
0.27 |
| MON (O.N.) |
0.30 |
| V/ L ratio |
1.82 |
| RVP (psi) |
0.22 |
Figure 2 shows the models generated for API (A), benzene (B), RON (C), and MON (D).
The excellent model performance, particularly for RON and MON prediction, shows Raman and chemometrics' promise as supplements, if not viable alternatives, to costly Knock engines and other demanding laboratory procedures.
The rapid rate at which spectra are gathered and results processed makes this a perfect tool for monitoring truck, tanker, and barge loading and unloading, constantly analyzing product quality, and eliminating loading errors.
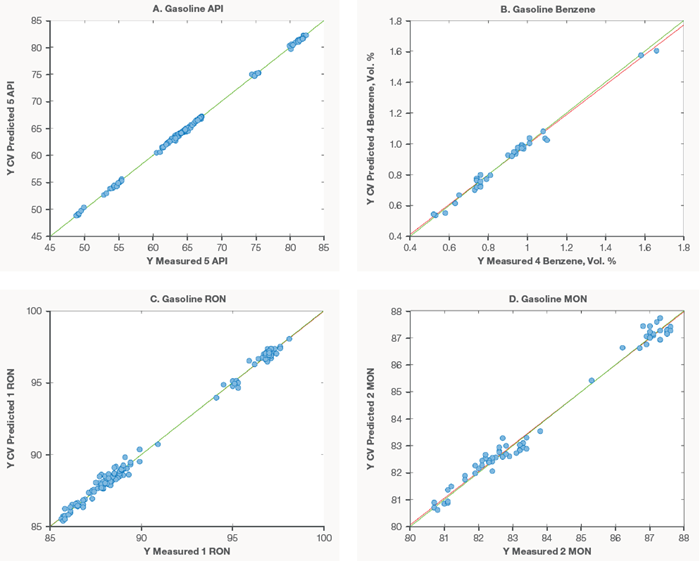
Figure 2. Gasoline property models for API (A), Benzene (B), RON (C), and MON (D). Image Credit: Thermo Fisher Scientific – Portable and Handheld Process Raman Spectroscopy
Diesel Fuel Properties
There were 20 samples available to create PLS models for seven diesel fuel parameters. Table 2 summarizes the expected features and the model's accuracy.
Table 2. Diesel fuel properties and model accuracies. Source: Thermo Fisher Scientific – Portable and Handheld Process Raman Spectroscopy
| Property |
Accuracy |
| API (°API) |
0.06 |
| Cetane number |
0.40 |
| Flash point (°F) |
1.1 |
| IBP |
9.2 |
| T10 |
2.9 |
| T50 |
1.7 |
| T90 |
2.2 |
Figure 3 shows examples of models made utilizing diesel spectra. Compared to gasoline models, there were much less samples available for modeling. As new data becomes available, these models will be updated and developed. However, the earliest models perform well.
The diesel models' excellent performance, like that of the gasoline models, demonstrates that Raman spectroscopy can supplement current lab analyses with short screening times or replace costly and time-consuming distillation procedures.
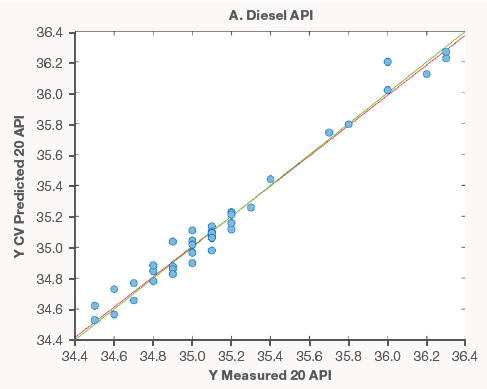
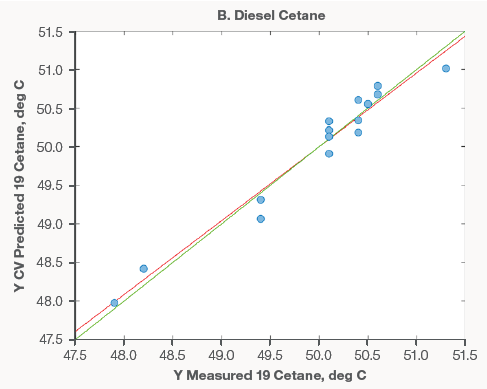
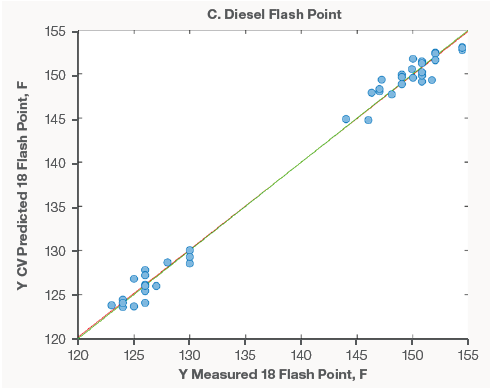
Figure 3. Diesel property models for API (A), Cetane (B), and Flash Point (C). Image Credit: Thermo Fisher Scientific – Portable and Handheld Process Raman Spectroscopy
Jet Fuel Properties
As with the diesel models, only 20 samples were available for modeling. Table 3 displays the models created and the resulting model accuracies. Despite the restricted number of samples, the jet models performed admirably, as did the diesel versions. Figure 4 shows a selection of the models created for jet fuel samples.
As more samples are collected, the models will be expanded to improve model resilience by broadening working ranges and increasing accuracy.
Table 3. Jet fuel properties and model accuracies. Source: Thermo Fisher Scientific – Portable and Handheld Process Raman Spectroscopy
| Property |
Accuracy |
| API (°API) |
0.09 |
| Cetane number |
0.26 |
| Flash point (°F) |
1.2 |
| Freeze (°F) |
1.0 |
| IBP |
3.5 |
| T10 |
2.6 |
| T50 |
1.3 |
| T90 |
1.5 |
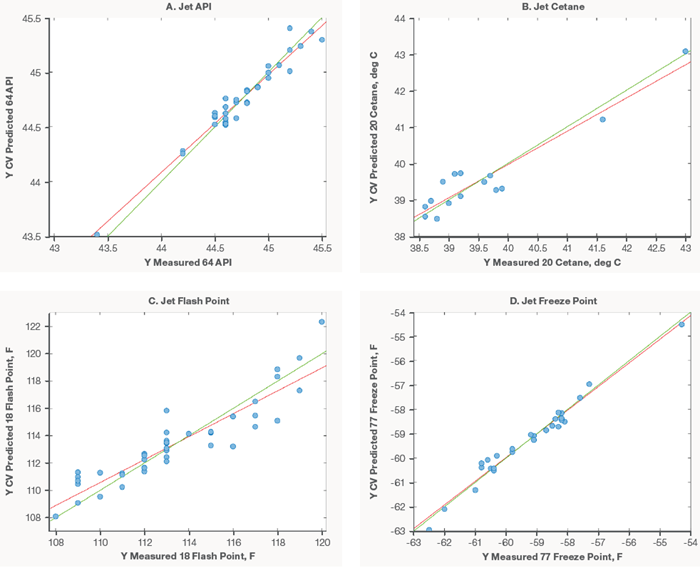
Figure 4. Jet fuel models for API (A), Cetane (B), Flash Point (C), and Freeze Point (D). Image Credit: Thermo Fisher Scientific – Portable and Handheld Process Raman Spectroscopy
Conclusion
The studies show that Raman spectroscopy can accurately evaluate the refined fuel qualities of gasoline, jet fuel, and diesel fuel. Using Raman spectroscopy in a refinery can significantly increase throughput while lowering overhead and improving laboratory safety.
The transferability of Raman methods enables models to be constructed in a lab and applied to field-based process equipment, enhancing the return on investment in process analytical technologies.

Image Credit: Thermo Fisher Scientific – Portable and Handheld Process Raman Spectroscopy

This information has been sourced, reviewed and adapted from materials provided by Thermo Fisher Scientific – Portable and Handheld Process Raman Spectroscopy.
For more information on this source, please visit Thermo Fisher Scientific – Portable and Handheld Process Raman Spectroscopy.