Precise natural gas measurements are critical in any environment. This article demonstrates how Raman spectroscopy and chemometric modeling can offer accurate natural gas measurements in any situation.
The Thermo Scientific™ MarqMetrix™ All-In-One X Process Raman Analyzer ensures safe optical power in hazardous environments.
Thermo Scientific's MarqMetrix™ Flow Cell Sampling Optic, certified for ATEX Zone 0, IECEx, and Class 1 Division 1, collected and analyzed spectra from six natural gas standards. The device produced high-quality data while maintaining a steady pressure of 100 psi and using an ATEX-compliant laser (35 mW).
Chemometric modeling yielded robust regression models for major chemical constituents, improving model accuracy and consistency with optimal variable selection.
Model performance metrics revealed high linearity, resolution, and sensitivity, suggesting that Raman spectroscopy combined with chemometric modeling is a powerful approach for precise natural gas analysis in hazardous environments.
Introduction
Natural gas is a fossil fuel made up largely of methane, with trace amounts of other hydrocarbons and impurities. Natural gas, which is formed by heating and compressing old marine organisms, is used as a combustion source for heating, electricity generation, car fuel, and as a feedstock in chemical synthesis.
It is thought to be a cleaner-burning alternative to traditional fossil fuels, helping to reduce greenhouse gas emissions and air pollution.
Natural gas measurement and analysis are critical procedures that require speed and precision. Accurate natural gas measurement has far-reaching consequences. It maintains revenue accuracy and allows for fair financial transactions between producers, which is critical to the industry's economic integrity.
These measurements are critical for regulatory compliance since they assure strict government and industrial norms conformity.
Accurate natural gas measurement has an impact on operational efficiency in gas-using sectors. Operators may optimize their processes, eliminate waste, and improve overall operational efficiency by receiving reliable and exact data.
Natural gas measurement is essential for safety and environmental preservation. By correctly monitoring methane content and detecting abnormalities in the natural gas stream, operators can address potential safety dangers and minimize environmental difficulties, supporting safer and more sustainable industry practices.
Raman spectroscopy is a highly effective method for addressing the numerous issues connected with natural gas measurements.
The MarqMetrix's All-in-One X Process Raman Analyzer, when connected with a flow cell or an immersion probe, can perform non-invasive, in-situ natural gas measurements directly within pipelines or process equipment.
This novel solution eliminates the need for traditional sample devices or loops, considerably lowering the expense and operational disturbances commonly associated with gas sampling.
The MarqMetrix All-In-One X analyzer's versatility is demonstrated by its ability to work reliably in various situations, including varying temperature and pressure regimes.
The hazardous site configuration expands the instrument's capabilities, allowing the analyzer to operate safely and effectively in some of the harshest and most dangerous operating conditions.
This sturdy configuration means that precise and consistent natural gas measurements may be obtained even in extreme situations, making it essential for ensuring operational efficiency, safety, and regulatory compliance.
The analyzer is developed explicitly for hazardous settings, ensuring intrinsic and inherent safety when used in ATEX Zone 0, IECEx, and Class 1 Division 1. It offers inherently safe operation and on-site real-time compositional insights, allowing operators to make faster, safer, and more informed decisions in high-risk locations.
The analyzer also has probe choices for safe operation in hazardous environments, including ATEX Zone 0, IECEx, and Class 1 Division 1 certification requirements.
These probes enable the real-time analysis of gases, liquids, and solids with a single analyzer, making them a versatile solution for demanding industrial applications.
Combining the MarqMetrix All-In-One X Process Raman Analyzer with advanced chemometric modeling considerably improves its capabilities, allowing for quick compositional analysis, environmental monitoring, and impurity identification in near real time.
This strong combination offers a comprehensive solution to the challenging requirements of natural gas analysis.
Natural gas spectra have minimal background fluorescence, which makes analysis easier. The principal components of natural gas have distinct, well-resolved spectral peaks, allowing for the formulation of extremely accurate and robust chemometric models.
These models may successfully assess natural gas's compositional nuances, allowing for precise identification and measurement of its elements.
Operators may accomplish timely and reliable assessments of natural gas quality and composition by combining the capabilities of the MarqMetrix All-In-One X analyzer with Thermo Fisher's global chemometric assistance.
This integration improves operating efficiency and promotes strict regulatory compliance and environmental responsibility. The capacity to monitor and detect pollutants in near real time adds to the usefulness of this technique, which provides an important tool for assuring the safety and integrity of natural gas operations.
This article will demonstrate the viability and usefulness of Raman spectroscopy for natural gas analysis in hazardous environments, emphasizing its potential effectiveness and reliability under demanding operational situations.
Table 1. Natural gas standard composition. Source: Thermo Fisher Scientific – Portable and Handheld Process Raman Spectroscopy
| Cylinder |
Methane (mol%) |
Ethane (mol%) |
Propane (mol%) |
Isobutane (mol%) |
N-Butane (mol%) |
Isopentane (mol%) |
N-Pentane (mol%) |
Hexane (mol%) |
Nitrogen (mol%) |
Carbon dioxide (mol%) |
| 1 |
90 |
2.5 |
2.5 |
0.5 |
2 |
0.3 |
0.5 |
0.2 |
1.5 |
0 |
| 2 |
89.01 |
4.8 |
1 |
0.3 |
0.3 |
0.1 |
0.1 |
0.08 |
2.4 |
1.9 |
| 3 |
81.7 |
4.2 |
1.9 |
0.9 |
0.3 |
0.2 |
0.1 |
0.4 |
0.2 |
10.1 |
| 4 |
77.8 |
6.5 |
4.6 |
0.9 |
0.9 |
0.5 |
0.5 |
0.3 |
1 |
7 |
| 5 |
81.85 |
3 |
1 |
0.4 |
1 |
0.2 |
0.4 |
0.05 |
9 |
3 |
| 6 |
72.7 |
10 |
4 |
0.9 |
0.8 |
0.4 |
0.3 |
0.3 |
0.2 |
10.4 |
Materials and Methods
The MarqMetrix All-In-One X Process Raman Analyzer, which included a flow cell, was used to gather the spectra of six natural gas standards, as shown in Table 1.
To guarantee constant and accurate sampling, the sample cylinders were linked to the analyzer using a gas sampling rig, and the pressure was carefully maintained at 100 psi throughout the process.
A laser with a power output of 35 mW was employed for the spectral analysis, with each sample being acquired for one minute. The laser power delivered to the sample met the ATEX 0 standards.
Each acquisition was averaged over six measures to increase the dependability of the results.
The spectra produced during this technique were then loaded into Solo 9.5 software (Eigenvector Research, Inc., Manson, WA USA 98831) for extensive chemometric modeling. This allowed for detailed analysis and interpretation of the chemical composition of natural gas samples.
Figure 1 shows the principal component peaks from the mean spectra acquired for each cylinder, demonstrating the MarqMetrix All-In-One X Process Raman Analyzer's incredible resolution and sensitivity.
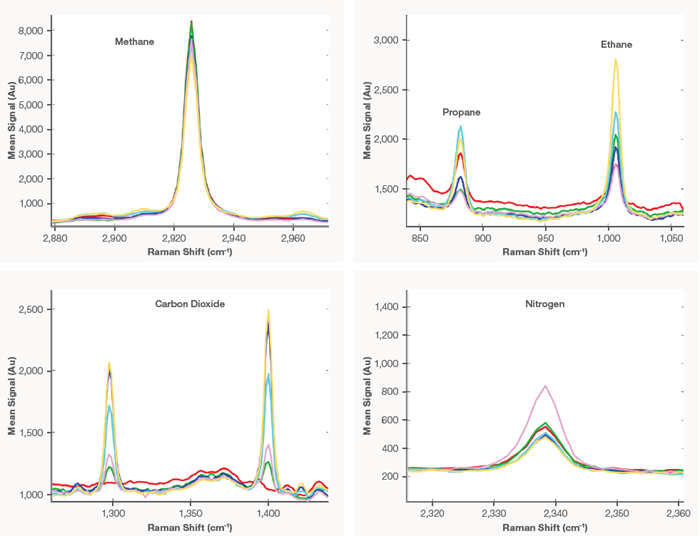
Figure 1. Peaks for the main natural gas components at various concentrations. Image Credit: Thermo Fisher Scientific – Portable and Handheld Process Raman Spectroscopy
Results
The spectra generated and the reference data collected from the certificates of analysis that accompanied the gas cylinders were entered into SOLO software. Partial Least Squares (PLS) regression models were developed for each hydrocarbon found in natural gas standards using this dataset.
The models underwent rigorous optimization, emphasizing variable selection, latent variable determination, and appropriate preprocessing techniques.
Because of the high covariance between the various hydrocarbons within the natural gas standards, variable selection emerged as a critical stage in the modeling process.
By carefully picking certain parts of the spectra that correspond specifically to the hydrocarbons of interest in each model, the independence and relevance of the information used in the model were significantly improved.
This thorough selection approach guarantees that the PLS regression models are robust and accurate, resulting in more reliable hydrocarbon content forecasts and analysis for natural gas samples.
Given the lower concentrations and intensities of the butane and pentane peaks, a broader set of variables was used to develop the models. Table 2 illustrates which parts of the spectra were used to build the regression models.
Table 2. Selected spectral regions for model development. Source: Thermo Fisher Scientific – Portable and Handheld Process Raman Spectroscopy
| Components |
Region (cm-1) |
| Methane |
2880 - 2960 |
| Ethane |
975 - 1050 |
| Propane |
850 - 950 |
| Butanes |
370 - 700, 800 - 875 |
| Pentanes |
370 - 700, 800 - 875 |
| Nitrogen |
2320 - 2360 |
| Carbon dioxide |
1250 - 1500 |
Given the small number of samples in the dataset, the models' performance was evaluated using the Root Mean Square Error in Cross-Validation (RMSECV). To provide strong cross-validation, the Venetian blinds technique was used; all sample replicates were held out at the same time during validation.
The 95% Confidence Interval (CI) for the RMSECV was calculated by multiplying the RMSECV value by 1.96, which measures the uncertainty associated with model predictions. Table 3 summarizes the results of the chemometric models, including performance measures.
Table 3. Model parameters and performance metrics. Source: Thermo Fisher Scientific – Portable and Handheld Process Raman Spectroscopy
| Components |
Range |
LVs |
RMSECV (mol%) |
R2 |
95% CI (mol%) |
| Methane |
72.7 - 90 |
5 |
1.91 |
0.993 |
3.74 |
| Ethane |
2.5 - 10 |
4 |
0.075 |
0.999 |
0.147 |
| Propane |
1 - 4.6 |
3 |
0.095 |
0.995 |
0.187 |
| i-Butane |
0.3 - 0.9 |
3 |
0.059 |
0.948 |
0.115 |
| n-Butane |
0.3 - 2 |
5 |
0.084 |
0.966 |
0.165 |
| i-Pentane |
0.1 - 0.5 |
2 |
0.046 |
0.785 |
0.091 |
| n-Pentane |
0.1 - 0.5 |
4 |
0.066 |
0.814 |
0.129 |
| Nitrogen |
0.2 - 9 |
4 |
0.575 |
0.968 |
1.13 |
| Carbon dioxide |
0 - 10.4 |
3 |
0.182 |
0.999 |
0.357 |
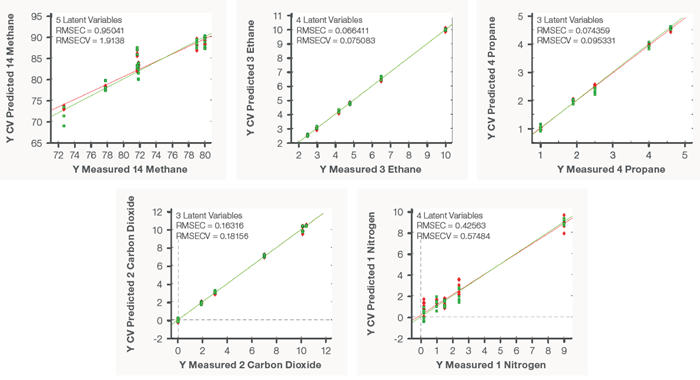
Figure 2. Regression models of key natural gas species. Image Credit: Thermo Fisher Scientific – Portable and Handheld Process Raman Spectroscopy
Figure 2 shows regression models for the principal natural gas species. Each model has high linearity, high resolution, and extraordinary sensitivity, demonstrating the resilience and precision of the analytical approach used.
Conclusion
The MarqMetrix All-In-One X Process Raman Analyzer and Thermo Scientific™ MarqMetrix™ FlowCell™ Sampling Optic, designed for ATEX Zone 0, were particularly effective in collecting and analyzing natural gas spectra.
The resultant data generated robust PLS regression models for each hydrocarbon component. Careful variable selection and optimization improved the independence and relevance of the models, resulting in more accurate and dependable forecasts.
These models demonstrated outstanding linearity, resolution, and sensitivity across a wide variety of natural gas components.
This study demonstrates the practicality and usability of Raman spectroscopy, when combined with advanced chemometric modeling, for precise and reliable natural gas measurement in hazardous situations.

This information has been sourced, reviewed and adapted from materials provided by Thermo Fisher Scientific – Portable and Handheld Process Raman Spectroscopy.
For more information on this source, please visit Thermo Fisher Scientific – Portable and Handheld Process Raman Spectroscopy.