Author: Philipp Beutler Thermo Fisher Scientific Karlsruhe, Germany
Texture and mouthfeel are closely linked to a food’s microstructure, and play a key role in consumer choice and acceptability. To enhance consumer appeal, formulation and production methods must be tailored to achieve the desired flow properties, texture, and mouthfeel.
Image Credit: P-fotography/Shutterstock.com
The first section is dominated by the sample's bulk properties, which include deformation and flow under shear, compression, and elongation. Following that, oral processing is dominated by surface properties, as seen by intimate contact interaction and oral surface lubrication.1,2
Rheology is extensively used in the chocolate and dairy industries, among others, and is used to characterize the bulk property regime.
Because the oral cavity consists of the tongue touching and sliding on the palate in the presence of a lubricant, tribological testing techniques are required to quantify the frictional qualities of foods.
It’s a technique that is becoming increasingly popular in research. However, the appraisal of the gathered data remains a source of dispute.
This application report examines the impact of various compositions of commercially available puddings on rheological and tribo-rheological qualities to demonstrate the utility of tribology as an industrially relevant method for quantifying and comparing mouthfeel.
A rheometer with regular and tribo-rheometrical measuring geometries is used to construct Stribeck curves and determine the rheological flow parameters of each food product.
Materials and Methods
This analysis focused on commercially available whole milk pudding, cream pudding, high-protein pudding, and plant-based pudding. It used a Thermo Scientific™ HAAKE™ MARS™ 60 Rheometer with an air-cooled Peltier temperature control module and a sample hood.
Figure 1 depicts the rheometer setup. The rheological experiments were taken with a 35 mm parallel plate geometry.
The temperature was fixed to 23 °C before beginning the measuring method. Following sample loading and trimming, a one mm measurement gap was established, and the temperature was constantly maintained for 200 seconds to ensure a uniform temperature distribution across the sample.
A steady state viscosity measurement was performed over a shear rate range of 0.01 to 1000 s-1. Figure 2 depicts the whole HAAKE RheoWin™ Software measurement technique.
The tribological measurements were taken with a Ball-On-Three-Discs configuration. Figure 3 depicts this measurement geometry against its real-world counterpart, the human mouth.
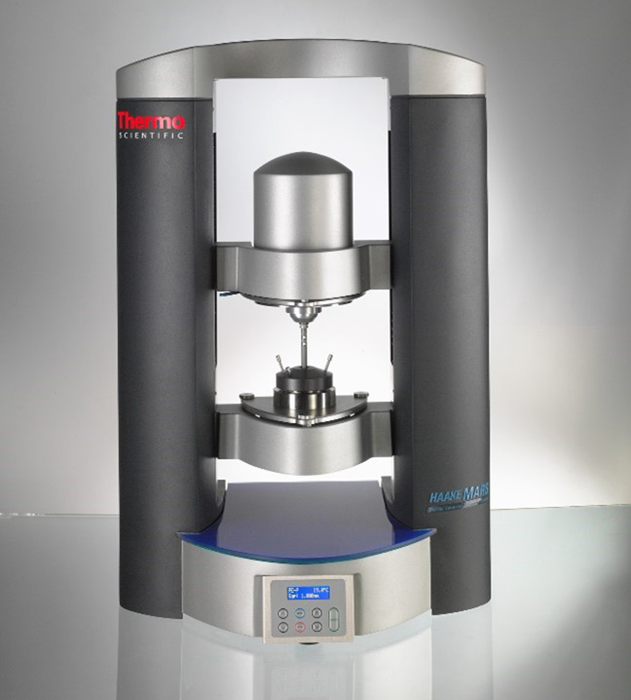
Figure 1. HAAKE MARS 60 Rheometer configuration for rheological characterization of pudding samples. Image Credit: Thermo Fisher Scientific – Production Process & Analytics
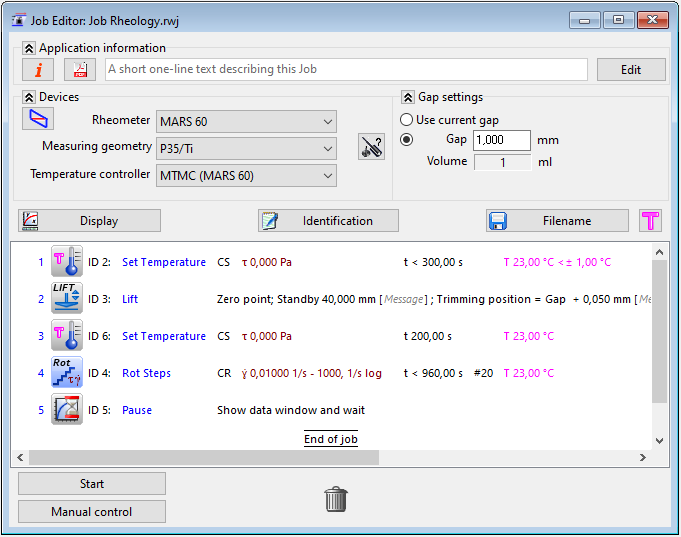
Figure 2. Measurement routine HAAKE RheoWin Software for rheological measurements. Image Credit: Thermo Fisher Scientific – Production Process & Analytics
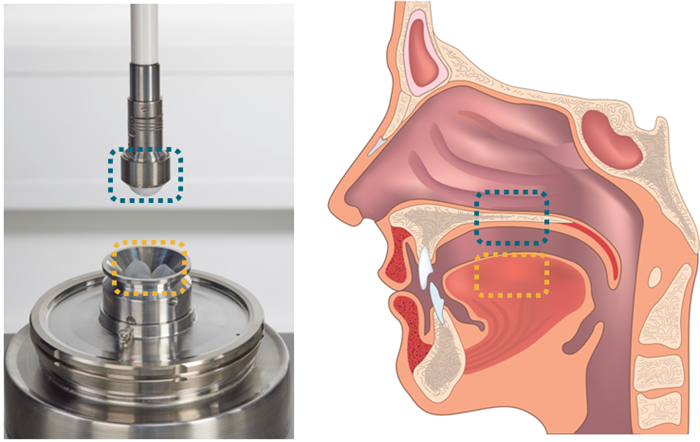
Figure 3. Tribo-rheometry measuring geometry consisting of a Ball-On-Three-Discs setup (left) as well as the corresponding tribo-system of the human mouth (tongue-yellow square, palate-blue square) (right). Image Credit: Thermo Fisher Scientific – Production Process & Analytics
To simulate the swallowing process of dairy products, a glass sphere is used to represent the palate (upper portion of the tribo-pair), and Polydimethylsiloxane (PDMS) discs are used to represent the tongue.
During a tribological measurement, a body is forced against a surface, either by gravity or an external force.
When the body moves across the surface, it encounters resistance due to friction at the body-surface interaction. Friction can be quantified by computing the coefficient of friction (COF) µf using equation (1).
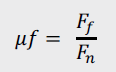 |
(1) |
Stribeck curves are often used to depict changes in tribological properties in a tribo-system that includes a tribo-pair and a lubricant.3
Figure 4 shows an example of such a Stribeck curve.
At low sliding speeds vR, the tribo-pair's surfaces are in direct contact with each other, resulting in high friction or coefficient of friction. This range is often referred to as border lubrication. As speed increases, hydrodynamic forces drag lubricant between both surfaces, reducing contact area and therefore friction.
As a result, the tribo-system transitions from boundary to mixed lubrication. The more liquid is dragged between the tribo-pairs, the wider the space between them becomes.
As soon as the lubricant completely separates both surfaces, the friction is limited to the lubricant's internal friction, which corresponds to its viscosity. This state is commonly known as the hydrodynamic lubrication regime.
The lubricant's viscosity, which plays an important role throughout the tribological experiment, must also be considered. A Stribeck curve considers both the lubricant's shear viscosity (η) and the applied load (P), which is the normal force per contact unit length of the bearing.
The dimensionless Hersey number (He) can be calculated by adding sliding speed, viscosity, and applied load.4 In practice, the normal force FN is generally favored over the applied load when calculating a Hersey number.5
As a result, the HAAKE RheoWin Software only provides the so-called simplified Hersey number (He-sim), as described in equation 2.
 |
(2) |
Additionally, when two lubricants share the same viscosity and the applied load remains constant throughout a series of experiments, their tribological behavior can be described using sliding speed alone, without having to reference the He.
Once sufficient sample was applied to the PDMS pins in the lower reservoir, the rotor was lowered to bring the tribo-pair into contact. To construct complete Stribeck curves, a constant normal force of three newtons was applied, and the ball's sliding velocity was increased logarithmically from 0.1 to 600 mm/s.
During operation, a tribo-system's contact surfaces wear, particularly at the start. This so-called running-in is temporary and results from the wear down of microscopic surface asperities, which reduces friction over time.
This phenomenon is typically encountered during the initial measurement runs. To acquire reliable measurement data, repeat the experiment numerous times with the same tribo-pair, reload a fresh lubricating sample after each run, and clean the surfaces with isopropyl alcohol beforehand.
The running-in time ends when the tribological data becomes consistent and the curves overlay. This typically occurs after two to three runs.
As a result, in this investigation, the third repetition run was used to conduct further examinations. Figure 5 depicts the HAAKE RheoWin Software measurement technique used for tribological testing.
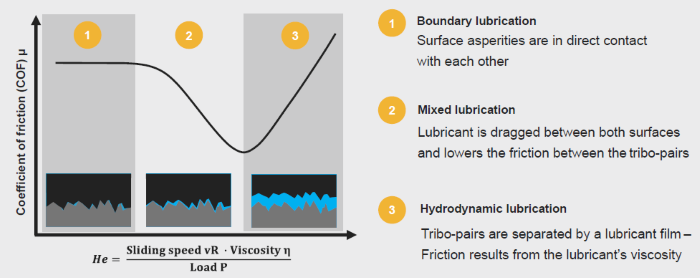
Figure 4. Example of a common Stribeck curve. Image Credit: Thermo Fisher Scientific – Production Process & Analytics

Figure 5. Measurement routine in HAAKE RheoWin Software for tribological measurements. Image Credit: Thermo Fisher Scientific – Production Process & Analytics
Results and Discussion
Figure 6 depicts the viscosity curves of the various puddings tested in this study, which show their flow qualities. All four samples have a decreasing shear viscosity with an increasing shear rate and so can be categorized as non-Newtonian materials.
Despite modest variances in shear viscosity, all pudding samples exhibited similar flow qualities.
To compare samples with different viscosities, Stribeck curves are created using a high-shear viscosity η1000 at a shear rate of 1000 1/s, as many materials, including dairy samples, exhibit non-Newtonian behavior with a shear rate-dependent viscosity.1 To follow this guidance, Table 1 shows η1000 for each pudding.
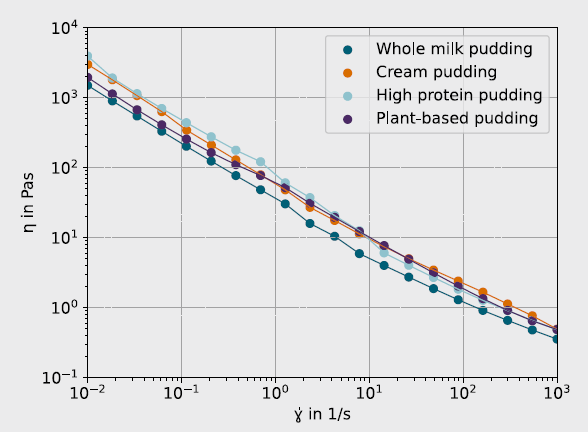
Figure 6. Comparison of viscosity curves of different commercially available types of pudding. Image Credit: Thermo Fisher Scientific – Production Process & Analytics
Table 1. High shear viscosities of the different pudding samples. Source: Thermo Fisher Scientific – Production Process & Analytics
| Sample |
η1000 / Pas |
| Whole milk pudding |
0.36 |
| Cream pudding |
0.49 |
| High protein pudding |
0.48 |
| Plant-based pudding |
0.49 |
Using the simplified Hersey number idea, the tribological properties of all screened substances may be determined based on their Stribeck curves, as shown in Figure 7. A bar plot also visualizes the different dietary compositions against friction qualities.
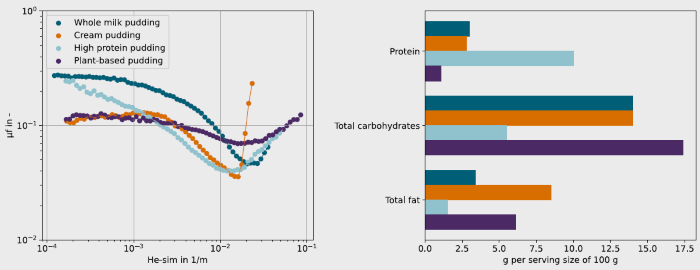
Figure 7. Tribological data as well as nutrition facts of the pudding types used in this study. Image Credit: Thermo Fisher Scientific – Production Process & Analytics
Compared to the shear viscosity curves shown in Figure 6, the frictional behavior of the screened compounds is far more variable. This is primarily due to variances in protein, total carbohydrates, and fat intake.
Various bio-lubrication mechanisms can exist depending on the structure and type of macromolecules.
Figure 8 provides a quick overview of these methods. The cream pudding (8.5 g/100 g) and the plant-based pudding (6.1 g/100 g) have more total fat than the whole milk pudding (3.4 g/100 g) and the high protein pudding (1.5 g/100 g).
Fat crystals can behave like rolling balls in a ball bearing, increasing lubrication. This leads to an overall decreased friction in the cream and plant-based pudding's boundary lubrication regimes, both below simplified Hersey numbers of 10-3 1/m.
Despite the cream pudding's larger total fat content, µf is not appreciably different from the plant-based pudding in the boundary lubrication regime. In contrast, the friction parameters of the two samples differ in both the mixed and hydrodynamic lubrication regimes.
Since the hydrodynamic lubrication regime is largely determined by sample viscosity, and the different pudding types show similar flow properties (Figure 6), it is reasonable to assume that, in the case of cream pudding, most of the sample is expelled from the gap between the rotating bodies by centrifugal forces at very high speeds.
This causes a dramatic increase in friction inside the tribo-system. Because of the increased shear at greater sliding speeds, a considerable amount of energy is introduced into the tribo-system's surface boundary.
Oil droplets coalesce as a result, creating a lubricating oil layer. This reduces the friction in the mixed lubrication regime. In contrast, the plant-based pudding exhibits a less dramatic reduction in friction during the shift from boundary to mixed lubrication.
According to the ingredients list, this product contains coconut fat. Coconut fat is expected to lubricate the sliding bodies far less than the animal-based fat found in the other goods.
Interestingly, unlike the other puddings, the high-protein pudding did not exhibit a boundary friction plateau. This could be due to the type of macromolecules present. In tribological interactions, non-spherical protein molecules slide while their globular counterparts roll. In addition, the creation of polysaccharide protein complexes may influence friction behavior.
Despite having the lowest protein and fat content, whole milk shows the highest overall friction. This may be due to its low protein levels, which reduce the likelihood of forming polysaccharide-protein complexes that contribute to effective lubrication.
Tribology offers valuable insights into the lubricating behavior of foods, but accurate interpretation requires additional characterisation techniques. Tools like quartz crystal microbalances can help link how macromolecules adsorb onto model surfaces with the underlying lubrication mechanisms.8
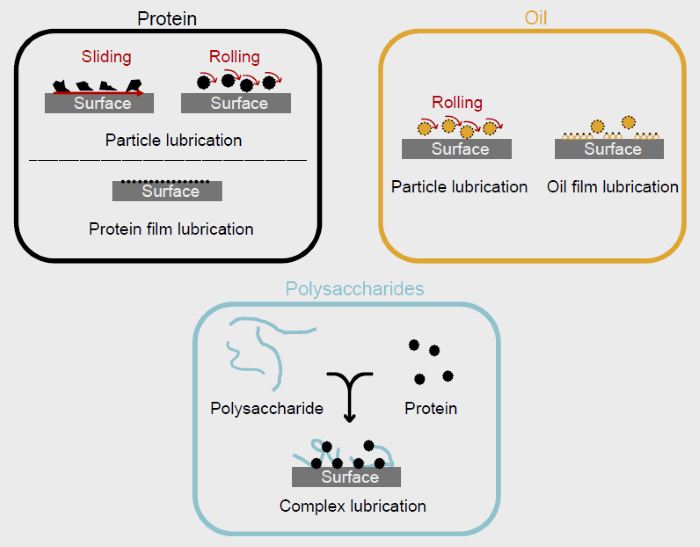
Figure 8. Bio-lubrication mechanisms of protein, oil as well as polysaccharide according to 6, 7. Image Credit: Thermo Fisher Scientific – Production Process & Analytics
Conclusion
This article reports on the testing of various types of pudding based on their flow and lubricating properties.
Despite minor variations in flow qualities, all food products had significant disparities in frictional properties. These discrepancies can be attributed to their nutritional values, as protein, fat, and carbohydrate content can affect lubrication in the tribo-system 'glass sphere-PDMS discs'.
Based on these findings, the influence of microstructures in plant-based food items can be compared to that of their dairy-based counterparts, accelerating both product improvement and novel formulations to fulfill customer expectations.
References
- Sarkar, A., et al. (2019). Lubrication of soft oral surfaces. Current Opinion in Colloid & Interface Science, 39, pp.61–75. https://doi.org/10.1016/j.cocis.2019.01.008.
- Stokes, J.R., Boehm, M.W. and Baier, S.K. (2013). Oral processing, texture and mouthfeel: From rheology to tribology and beyond. Current Opinion in Colloid & Interface Science, 18(4), pp.349–359. https://doi.org/10.1016/j.cocis.2013.04.010.
- Bharat Bhushan (2013). Introduction to Tribology, 2nd Edition. https://www.wiley.com/en-gb/Introduction+to+Tribology%2C+2nd+Edition-p-9781119944539.
- Wang, Q.J. and Chung, Y.-W. eds., (2013). Encyclopedia of Tribology. https://doi.org/10.1007/978-0-387-92897-5.
- Veltkamp, B., et al. (2021). Lubricated Friction and the Hersey Number. Physical Review Letters, 126(4). https://doi.org/10.1103/physrevlett.126.044301.
- Ji, L., et al. (2022). Lubrication properties of model dairy beverages: Effect of the characteristics of protein dispersions and emulsions. Food research international (Ottawa, Ont.), (online) 157, p.111209. https://doi.org/10.1016/j.foodres.2022.111209.

This information has been sourced, reviewed, and adapted from materials provided by Thermo Fisher Scientific – Production Process & Analytics.
For more information on this source, please visit Thermo Fisher Scientific – Production Process & Analytics.