Sponsored by LabmanReviewed by Maria OsipovaJan 22 2026
The Hegman fineness-of-grind gauge continues to be one of the most widespread and user-friendly tools for assessing the quality of particle dispersion in inks, paints, coatings, and related materials. However, across different industries, interpretating gauge drawdowns varies substantially.
Bulk particle analysis and scratch analysis, two of the most common approaches, often produce conflicting results.
This article provides a scientifically grounded evaluation of the two methods. It demonstrates that overall, scratch analysis is not a reliable tool for detecting large particles or representing particle size, and that bulk particle analysis more accurately reflects overall dispersion behavior.
Particle dispersion quality is crucial for the performance of inks, coatings, and formulated products. Using a Hegman gauge is a quick, qualitative way to assess the presence of particles as a liquid film thins along a tapered groove. The hardware used is standardized, but the interpretation of the visible features on the gauge is not.
As a result, two different evaluation methods have materialized:
- Scratch analysis – Recording the point at which the first linear scratch appears.
- Bulk particle analysis – Recording the point at which a consistent speckled texture emerges, representing the majority particle population.
These methods do not measure the same physical behavior. Understanding their differences is key to making reliable decisions in quality control, milling optimization, and process development.
2. How the Hegman Gauge Works
A Hegman gauge contains a precision-machined tapered groove. The drawdown procedure spreads a liquid sample from the deep end (thick film) toward the zero end (thin film).
As the film thins:
- Particles start to break through the liquid surface, which creates visible speckling.
- Sometimes a particle can become trapped under the scraper blade, producing a linear scratch.
The main concern for users is determining which of these signals should be used to determine the grind’s fineness.
3. Scratch Analysis
3.1 Method Description
Scratch analysis takes the reading at the position where the first linear scratch appears.
The premise of this method is that this scratch marks the depth at which the responsible particle is bigger than the wet film thickness.
3.2 What Scratch Analysis Actually Measures
In practice, the position of the scratch does not indicate particle size. A scratch will only appear if a particle becomes trapped between the gauge surface and the blade: this event is governed not by particle dimensions, but rather random particle placement.
This means that:
- A small particle could produce an early scratch if it, by chance, lands in a shallow region.
- If a large particle never becomes trapped under the blade, it may never create a scratch.
- The scratch depth, therefore, does not correlate to the particle’s true size.
- Readings can greatly vary between replicate draws from the same sample.
Scratch analysis ultimately detects random trapping events, not large particles.
3.3 Limitations
- There is no reliable correlation to a particle’s true size.
- It is not a suitable method for detecting oversized particles.
- It is highly sensitive to sample loading variation, isolated agglomerates, and contamination.
- The method demonstrates weak reproducibility, making it unsuitable for quality control or process decisions.
Scratch readings provide no helpful insights into milling progression or dispersion quality.
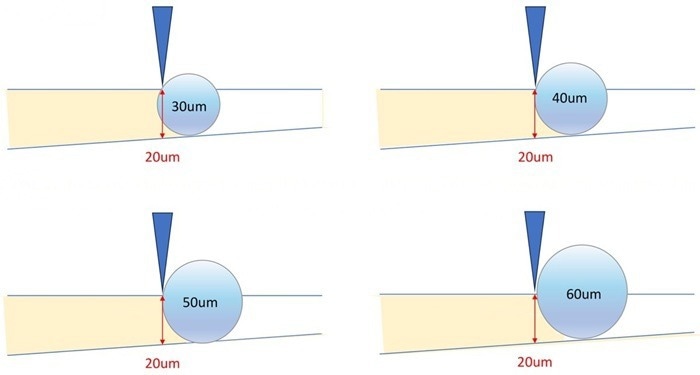
Image Credit: Labman
4. Bulk Particle Analysis
4.1 Method Description
Bulk particle analysis identifies the depth at which a consistent band of texture or speckling becomes visible across the groove. It deliberately disregards isolated scratches or single specks.
4.2 What Bulk Particle Analysis Measures
This method reflects the point where the majority of the particle population starts to protrude through the gradually thinning liquid film.
Key characteristics:
- Lower sensitivity to isolated anomalies.
- Greater reproducibility across drawdowns and operators.
- Represents overall dispersion behavior.
4.3 Strengths
- Gives a representative qualitative view of dispersion state.
- Evaluates larger particle populations, rather than outliers.
- Shows clearer trends with milling time, batch variations, and formulation changes.
4.4 Limitations
- It is still a manually interpreted process.
- It is not a substitute for particle size measurement instruments when quantitative accuracy is necessary.
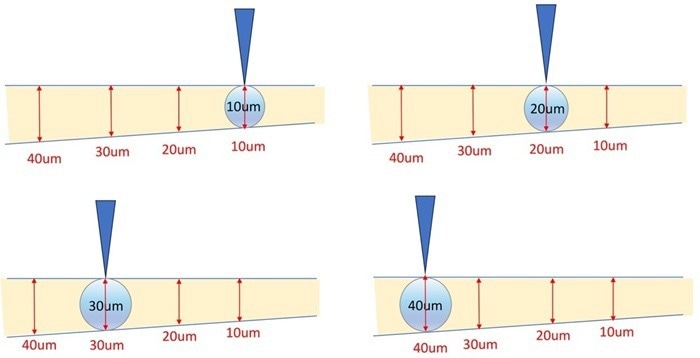
Image Credit: Labman
5. Sources of Variability
5.1 Random Particle Placement
Only a small portion of the dispersion is drawn across the gauge, and individual particles deposit unpredictably. It is not the size of these particles, but rather their locations, that determine whether and where scratches occur. This randomness makes scratch readings fundamentally unreliable.
5.2 Operator Technique
Many factors can significantly influence the visibility of scratches and the appearance of textures, such as the lighting, pressure, angle of the scraper, and the drawdown speed.
5.3 Material Properties
Viscosity, solvent content, flocculation, and flow behavior all have an impact on particle movement and emergence during the drawdown.
Scratch analysis is extremely vulnerable to these variables, whereas bulk particle analysis is more consistent.
6. Comparative Summary
Source: Labman
| Aspect |
Scratch Analysis |
Bulk Particle Analysis |
| What does the method reflect? |
Random blade-trapping events |
The majority of the particle population |
| Relation to particle size |
Scratch position does not indicate a particle’s size |
Qualitative correlation |
| Sensitivity to outliers |
Very high |
Low |
| Reproducibility |
Low |
Higher |
| Is there a meaningful representation of dispersion? |
No |
Yes |
| Appropriate use of the method |
The method is not recommended |
Routine evaluation of a grind’s fineness |
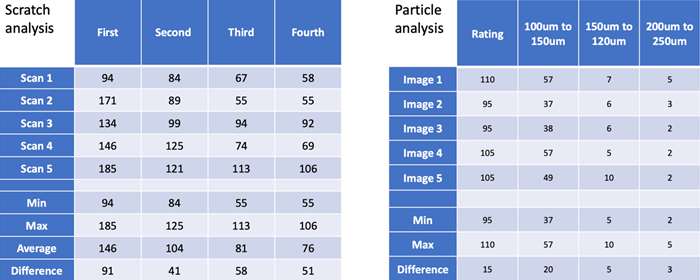
Below are the results of a Scratch Analysis vs Particle Analysis report performed by Labman. See the full report here:
Download the PDF
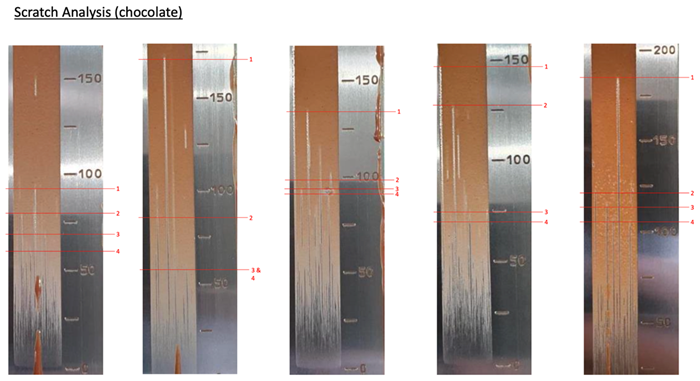
Image Credit: Labman
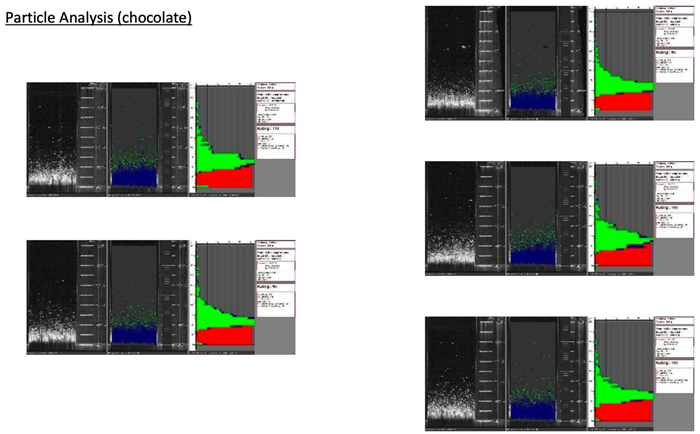
Image Credit: Labman
Results Comparison. Source: Labman
7. Conclusions
Scratch analysis does not provide meaningful dispersion metrics or information about particle sizes. Scratches occur due to random particle positioning rather than particle dimension. As such, scratch readings fluctuate unpredictably and do not reflect the size or presence of large particles.
In contrast, bulk particle analysis indicates where most of the particles break the film surface, thus providing a more representative and consistent dispersion quality assessment.
For almost all paints, coatings, and general dispersions, bulk particle analysis is the appropriate interpretation method.
8. Recommendations
- Users should stop using scratch analysis for the assessment of dispersion quality, milling progression, or particle size. Its readings are non-representative and random.
- Bulk particle analysis should be used as the primary qualitative method for evaluating grind fineness.
- Operators should be trained to focus on population-based texture as opposed to early isolated defects.
- Particle sizes should be measured using instruments for quantitative verification.
- Ensure that internal SOPs explicitly state that scratch events do not represent particle size and should not be used for QC or decision-making.
References:
- Qualtech Products Industry. (2022). Professional Fineness of Grind Gauge - Precision Hegman Gauge. (online) Available at: https://www.qualtechproductsindustry.com/products/physical-properties-testing-instruments/fineness-of-grind/fineness-of-grind-gauges/.
- Saitech Informatics. (2025). Grind Gauge Reading. (online) Available at: https://saitechinfo.com/grind-gauge-reading/.
- Ogla, B., et al. (2025). An inline quality control device for continuous measurement of fineness of grind in paint dispersion processes. Chemical Engineering and Processing - Process Intensification, (online) 218, p.110561. DOI: 10.1016/j.cep.2025.110561. https://www.sciencedirect.com/science/article/pii/S0255270125004076.

This information has been sourced, reviewed, and adapted from materials provided by Labman.
For more information on this source, please visit Labman.