Particle size distribution (PSD) continues to be one of the most decision-critical variables in metal mining, impacting comminution efficiency, recovery, liberation, and tailings behavior.
This article showcases why P80 and other single indicators can be insufficient in this area, highlighting how fines content and overall PSD can influence flotation and leaching outcomes. It also offers a range of practical PSD measurement strategies for mining materials, combining sieving with laser diffraction to support process control.
Introduction
Particle size is an important physical parameter in metal mining and mineral processing, linking metallurgical performance, energy consumption, and downstream operational stability.
The accurate characterization of particle size distribution (PSD) has become essential for effective process control, particularly as ore grades decline and processing routes become more complex.
Beyond its historic role as a laboratory measurement tool, particle size now operates as a decision-critical variable impacting every key processing stage from grinding and classification to flotation, extraction and refining, and tailings management.1
Upstream PSD choices directly impact factors such as recovery efficiency, water and reagent usage, and long-term operational risk. PSD measurements are, therefore, key to informing practical engineering decisions across various stages of mineral processing.
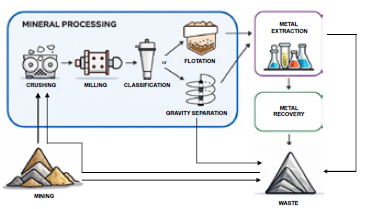
Figure 1. The breakdown of the mineral processing steps within the mining chain. Image Credit: Bettersize Instruments
PSD Considerations Across Key Processing Stages
PSD influences each mineral processing stage in different ways, with each of these stages being sensitive to specific size ranges. It is important to understand which part of the PSD is most relevant at each stop to ensure effective control and risk reduction.
Table 1. Summary of the key PSD control objectives, critical particle size regions, and major operational consequences across metal mining process stages. Source: Bettersize Instruments
| Stage |
What PSD
Controls |
Particle
Size Focus |
Primary
Consequence |
| Grinding & Classification |
Degree of mineral liberation and circuit stability |
P80 and PSD
shape |
Determines energy efficiency and governs downstream performance |
| Flotation |
Recovery efficiency
and selectivity |
Size-by-size recovery behavior |
Identifies where material losses occur in the circuit |
| Extraction & Refining |
Reaction kinetics and extraction efficiency |
Fine fraction (surface-area dependent) |
Impacts residence time and consumables demand |
| Tailings Management |
Settling behavior and water recovery |
Fine end of
the PSD |
Governs dewatering performance and metal mobility risk |
PSD as a Process Control Tool
Grinding and Classification: Similar P80, Different Outcomes
P80, the size at which 80 % of the material is finer, is widely empployed in grinding circuits as a practical control metric for tracking particle size reduction. Figure 2 highlights the change in P80 under different grinding conditions.
Particle size decreases predictably as grinding time increases, meaning P80 serves as a practical operational parameter when comparing grinding conditions and adjusting variables to reach a targeted size, for example, power input, grinding time, and overall milling strategy.2
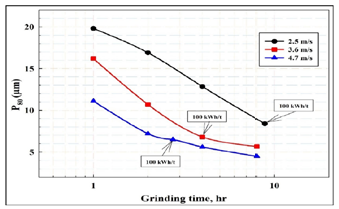
Figure 2. Relationship between grinding time and P80 at varying grinding rates. Image Credit: Bettersize Instruments
P80 alone does not fully describe the resulting particle size distribution, however. Table 2 highlights how sieve-based measurements (for instance, P38 and P53) offer only coarse resolution and are unable to describe complex PSD features or capture fine particle behavior.3
Laser diffraction (LD) analysis can facilitate full PSD characterization, offering in-depth and comprehensive insight into the fine fractions and revealing multimodal or skewed distribution shapes (Figure 3).
The combined results illustrate that, although samples PSD5 to PSD7 exhibit similar P80 values, they differ significantly in terms of D10 and D50, reflecting considerable variation in terms of fines generation and overall distribution shape.
These differences highlight the importance of implementing full PSD characterization for effective grinding-circuit control.
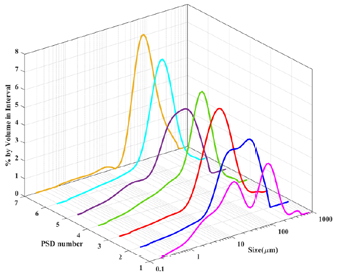
Figure 3. PSD curves of seven slurry samples obtained using the laser diffraction method. Image Credit: Bettersize Instruments
Table 2. Combined sieve and laser scattering descriptors for the seven slurry PSDs. Source: Bettersize Instruments
| PSD |
P38
(Sieve, %) |
P53
(Sieve, %) |
P212
(Sieve, %) |
P300
(Sieve, %) |
D10
(LD, μm) |
D50
(LD, μm) |
P80
(LD, μm) |
| PSD 1 |
59.0 |
71.3 |
93.9 |
100.0 |
1.85 |
14.60 |
75.87 |
| PSD 2 |
59.0 |
71.3 |
93.9 |
100.0 |
1.86 |
29.59 |
96.96 |
| PSD 3 |
49.8 |
70.4 |
93.9 |
100.0 |
2.23 |
39.21 |
90.49 |
| PSD 4 |
39.0 |
65.0 |
92.8 |
100.0 |
2.50 |
44.41 |
91.37 |
| PSD 5 |
48.5 |
59.0 |
83.8 |
98.9 |
3.11 |
50.17 |
143.80 |
| PSD 6 |
28.9 |
49.8 |
85.5 |
97.8 |
6.17 |
65.99 |
148.70 |
| PSD 7 |
10.0 |
39.0 |
83.0 |
96.5 |
29.02 |
82.40 |
155.60 |
Flotation: Size-Dependent Losses Across Process Streams
The relationship between particle size and recovery in conventional sulfide flotation systems is typically illustrated by the widely recognized ‘elephant curve’ (Figure 4).
This characteristic trend has remained largely unchanged over decades of industrial practice, and features higher recovery at intermediate particle sizes and lower recovery at both the coarse and fine ends.4
Recovery losses in the fine fraction are generally the result of reduced selectivity, driven by slime coating, entrainment, and other mechanisms. Losses occur at the coarse end due to reduced collision efficiency, incomplete liberation, and turbulence-driven detachment from bubbles.
These behaviors vary significantly with particle size, meaning that a single size metric is insufficient for characterizing flotation performance.
It is important to implement a full PSD with size-by-size mineral and recovery data to accurately interpret the true flotation response and determine where losses occur across the process streams.
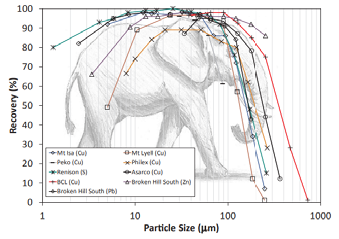
Figure 4. Conventional flotation data for industrial sulfide flotation circuits. Image Credit: Bettersize Instruments
Extraction and Refining: PSD Effects on Reaction Kinetics
Smaller particles generally leach faster in hydrometallurgical extraction due to their shorter mass-transfer diffusion paths and higher specific surface area. Work by Gbor and Jia demonstrates that PSD, as opposed to solely the mean particle size, plays a central role in determining leaching behavior.5
Increasing the Coefficient of Variation (CV) broadens the PSD (Figure 5), producing a higher proportion of fine particles and extending the coarse-particle tail. The corresponding leaching curves displayed in Figure 5 demonstrate a distinct two-stage behavior:
- The large reactive surface areas of fine particles contribute to rapid initial conversion.
- Coarse particles’ reduced accessible surface area and longer diffusion paths mean that they dominate the slower, late-stage reaction tail.
These distribution effects are minimal when the PSD is narrow (for instance, with low CV), meaning that the particle population can be treated as effectively uniform.
In the case of wide distributions (typically reported as CV > 0.3), however, PSD must be explicitly considered in order to accurately interpret kinetic parameters, calculate leaching rates, and compare process conditions across circuits or samples.
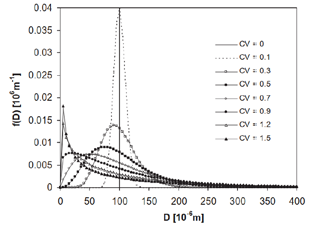
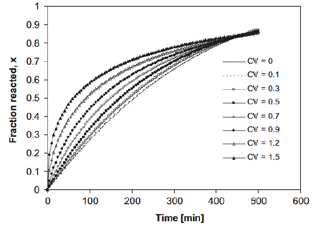
Figure 5. Particle size distributions at varying CV values and fraction reacted curves as a function of time. Image Credit: Bettersize Instruments
Tailings Management: Particle Size Effect on Metal Release
Particle size is a key factor in assessing and managing the environmental risks linked to tailings storage.
Fine particles consistently demonstrate higher metal release, while coarse fractions typically show considerably lower release rates. The example provided in Figure 6 shows that both copper (Cu) and cobalt (Co) display a strong size dependency, with fine fractions releasing significantly more metal, while coarser fractions release notably less.
This trend highlights how tailings’ environmental behavior is largely governed by the fine end of the PSD, most notably in terms of metal mobility and leaching risk.6
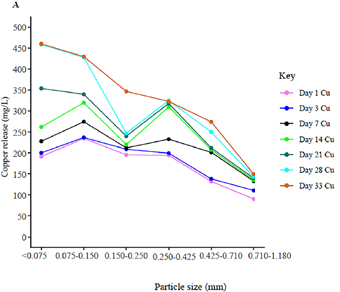
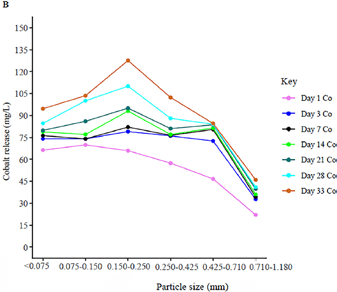
Figure 6. Size-dependent Cu (A) and Co (B) release from slag material. Image Credit: Bettersize Instruments
Laser Diffraction Method for Mining Applications
Mining materials present a range of distinct challenges for particle size analysis, including irregular particle shapes, wide size distributions, and high material density.
Laser diffraction (LD) has become a widespread and popular technique in mining settings due to its rapid analysis speed, broad measurement range, and strong repeatability.
ISO 13320, ASTM B822, and other international standards provide established guidelines for performing and reporting laser diffraction-based particle size measurements.
Bettersize’s Bettersizer 2600 Plus particle size analyzer has been developed to meet the stringent demands of mining environments, delivering reliable PSD data for process monitoring, routine quality control, and application development.
The Bettersizer 2600 Plus offers flexible, detailed PSD analysis, including:
- A wide measurement range of 0.02–3500 μm, accommodating both the fine and coarse fractions typically encountered during mining processing
- Applicability to common size parameters and characteristic values used in mining and plant operations, including D10, D50, D80, and D90
- Distribution width indicators, with metrics such as Span available for the quantitative comparison of PSD narrowness or broadness
- Flexible reporting formats for easy interpretation across different teams, including Log-normal PSD tables, cumulative percentage reporting, and sieving-style distribution reports
For instance, D80, Span, and multiple distribution formats can be used to report the PSD measurements of a manganese ore under varying product conditions, enabling the rapid comparison of product specifications.
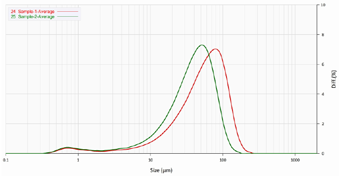

Figure 7. PSD curve of manganese powders. Image Credit: Bettersize Instruments
Sieve analysis remains a standard method in practical mining workflows, particularly when characterizing coarse fractions, due to its simplicity and widespread use among test engineers.
Laser diffraction and sieve results can be integrated into a combined measurement framework to maintain these existing practices while improving fine-end resolution.
For example, the iron ore sample (Table 3 and Figure 8) was analyzed by quantifying coarse material via sieving and measuring fine particles using laser diffraction.
This combined approach preserves widely used and recognized measurement methods while considerably improving resolution in the fine size range, enabling a more comprehensive and broader particle size distribution that is better suited to process control and product quality management.
Table 3. Sieve data for the iron ore sample. Source: Bettersize Instruments
| Size (μm) |
Mass in fraction (kg) |
| <38 |
1.090 |
| 38-53 |
0.707 |
| 53-75 |
0.442 |
| 75-106 |
0.295 |
| 106-150 |
0.177 |
| 150-212 |
0.118 |
| 212-300 |
0.074 |
| 300-425 |
0.044 |
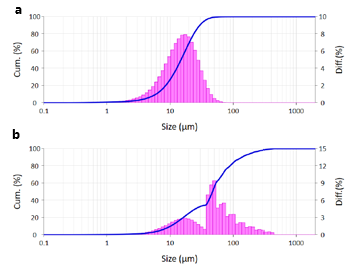
Figure 8. (a) Fine particles PSD by laser diffraction, (b) Combined laser diffraction and sieving results. Image Credit: Bettersize Instruments
Conclusions
Particle size decisions made during grinding define downstream operational stability, recovery performance, and tailings-related environmental risk throughout the mineral processing sector.
Considering and treating particle size distribution as a controllable process variable as opposed to a single descriptive measurement offers mining operations a cost-effective and practical means of enhancing performance without requiring significant changes to the existing flowsheet.
References and Further Reading
- Whitworth, A.J., et al. (2022). Review on advances in mineral processing technologies suitable for critical metal recovery from mining and processing wastes. Cleaner Engineering and Technology, 7, p.100451. DOI: 10.1016/j.clet.2022.100451. https://www.sciencedirect.com/science/article/pii/S2666790822000568.
- Elbendari, A.M. and Ibrahim, S.S. (2025). Optimizing key parameters for grinding energy efficiency and modeling of particle size distribution in a stirred ball mill. Scientific Reports, (online) 15(1). DOI: 10.1038/s41598-025-87229-8. https://www.nature.com/articles/s41598-025-87229-8.
- Grabsch, A.F., Yahyaei, M. and Fawell, P.D. (2019). Number-sensitive particle size measurements for monitoring flocculation responses to different grinding conditions. Minerals Engineering, [online] 145, p.106088. DOI: 10.1016/j.mineng.2019.106088. https://www.sciencedirect.com/science/article/abs/pii/S0892687519304996.
- Lynch, A., et al. (1981) Mineral and coal flotation circuits: their simulation and control. Amsterdam: Elsevier Publishing.
- Gbor, P.K. and Jia, C.Q. (2004). Critical evaluation of coupling particle size distribution with the shrinking core model. Chemical Engineering Science, 59(10), pp.1979–1987. DOI: 10.1016/j.ces.2004.01.047. https://www.sciencedirect.com/science/article/abs/pii/S0009250904001083.
- Harimana, J., et al. (2024). Effect of particle size, pH, and residence time on mobility of copper and cobalt from copper slag. Scientific African, (online) 23, p.e02117. DOI: 10.1016/j.sciaf.2024.e02117. https://www.sciencedirect.com/science/article/pii/S2468227624000620.
Acknowledgments
Produced from materials originally authored by Perfil Liu, Senior Application Engineer, and Beverly Barnum, Technical Director at Bettersize Technologies.

This information has been sourced, reviewed and adapted from materials provided by Bettersize Instruments.
For more information on this source, please visit Bettersize Instruments.