Ink is a liquid dispersion system that is generally comprised of a liquid carrier, pigments, and functional additives. Pigments are dispersed as solid particles within the liquid phase, underpinning ink performance parameters such as opacity, color strength, and viscosity.
Pigment particle size and size distribution (PSD) are, therefore, essential quality attributes that must be carefully controlled. Particle size directly impacts ink properties in a number of different ways:
- Color strength: Smaller pigment particles provide a higher specific surface area, improving light absorption, which in turn increases color strength.
- Opacity: Maximum opacity is generally achieved when light scattering efficiency is greatest, for example, when pigment particles have a mean size in the range of 0.15–0.40 μm.
- Viscosity: As particle size decreases, particle-particle interactions increase, potentially resulting in higher suspension viscosity.
The width and shape of the PSD are equally as important as the average particle size. For example, a broad or multimodal PSD can reduce color strength and is typically indicative of inadequate particle agglomeration or dispersion.
There are several practical challenges associated with failing to monitor and control pigment particle size and PSD during ink development and manufacture, including inconsistent print quality, nozzle clogging in inkjet printing, and reduced long-term stability of the ink system.
Effective control of pigment particle size is, therefore, essential if consistent ink performance and process reliability are to be ensured.
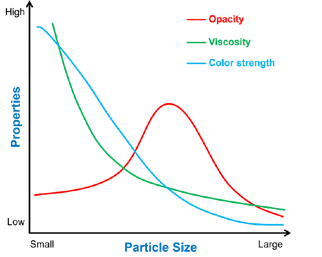
Figure 1. Influence of particle size on ink physical properties. Image Credit: Bettersize Instruments
This article outlines two ink case studies that have been measured using the Bettersizer 2600 Plus.
A corrosion-resistant BT-80N Pro automatic wet dispersion unit was used to perform measurements in solvent-based dispersion media. This approach ensured accurate and reproducible particle size data.
These case studies highlight the importance of precise particle size analysis in optimizing formulation during research and development, as well as the importance of quality control and assurance during production.
Experiment
This study evaluated two groups of ink samples. Group A was comprised of six samples obtained from an R&D project. This group sought to assess and optimize various grinding processes.
Group B was comprised of six samples collected from separate production batches on the same production line. This group sought to represent routine manufacturing variability.
The Bettersizer 2600 Plus fitted with the BT-80N Pro automatic wet dispersion unit was used to perform particle size measurements. Each sample was measured six consecutive times under identical conditions to assess measurement repeatability.
Table 1 summarizes the sample preparation, dispersion, and measurement parameters for Group A and Group B.
Table 1. Measuring procedure parameters for Group A and Group B samples. Source: Bettersize Instruments
| Procedure |
Parameter |
Group A |
Group B |
| Sample Preparation |
Sample amount |
0.3 mL |
0.1 mL |
| Pre-treatment |
5 min. water-bath ultrasonication @40 kHz |
None |
| Dispersion |
Dispersion medium |
Methyl ethyl ketone (MEK) |
N,N-Dimethylaetamide (DMAC) |
| Circulation speed |
1200 rpm |
1200 rpm |
| Internal sonication |
35 W, 60 s |
35 W, 120 s |
| Measurement |
Optical model |
Mie |
Mie |
| Particle refractive index (RI) |
2.741 |
1.38 |
| Particle absorption rate (AR) |
0.1 |
0.1 |
| Medium RI |
1.379 |
1.438 |
| Obscuration range |
8 - 15 % |
10 - 12 % |
| Measurement repetitions |
6 |
6 |
Results and Discussion
The application examples presented here use two sets of real customer samples to show how particle size analysis supports both R&D process development and quality control in production.
R&D Application Example One: Grinding Process Optimization
Particle size measurements were performed on the Group A samples to evaluate the impact of grinding time on pigment particle size distribution during process development.
Figure 2 and Table 2 summarize the particle size results for six samples prepared with progressively longer grinding times. The characteristic particle size parameters D10, D50, and D90 show a clear downward trend as grinding time increases, highlighting improved dispersion and the effective reduction of coarse particles.
The particle size distribution becomes generally stable from samples A4 to A6. A slight decrease in D90 is observed while D10 and D50 remain fundamentally unaffected. This behavior implies that further grinding beyond this point would yield diminished returns in terms of particle size reduction.
The grinding condition represented by sample A4 provides an optimal balance in terms of both processing efficiency and production cost. This approach achieves a well-controlled and stable particle size distribution without unnecessary increases in energy consumption or grinding time.
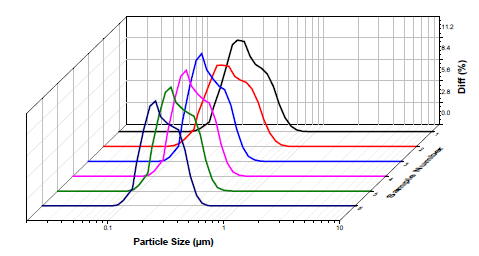
Figure 2. Particle size distributions of Group A samples prepared at different grinding times. Image Credit: Bettersize Instruments
Table 2. Characteristic particle size values of samples prepared at different grinding times. Source: Bettersize Instruments
| Sample |
D10 (μm) |
D50 (μm) |
D90 (μm) |
D97 (μm) |
| A1 - 10 min |
0.146 |
0.227 |
0.396 |
0.476 |
| A2 - 30 min |
0.137 |
0.224 |
0.395 |
0.475 |
| A3 - 50 min |
0.135 |
0.197 |
0.320 |
0.376 |
| A4 - 70 min |
0.133 |
0.196 |
0.318 |
0.372 |
| A5 - 90 min |
0.133 |
0.196 |
0.316 |
0.369 |
| A6 - 110 min |
0.133 |
0.196 |
0.313 |
0.364 |
These results confidently demonstrate the capacity of particle size analysis to deliver clear insight during R&D, improving process selection, facilitating the identification of efficient grinding windows, and preventing unnecessary over-grinding.
Quality Control Example Two: Batch Consistency Monitoring
Particle size analysis is also critical for routine quality control during process development.
The customer in this example had established target particle size values (D10: 0.153 μm, D50: 0.277 μm, D90: 0.52 μm) and corresponding tolerance limits, in order to effectively monitor batch-to-batch consistency.
Six consecutive batches were analyzed: all batches had been produced on the same manufacturing line.
The instrument software’s data evaluation function was used to evaluate measurement results. All six batches exhibited D10, D50, and D90 values close to the defined targets (Figure 3). It was also possible to achieve excellent measurement repeatability, ranging from 0.00–0.41 %.
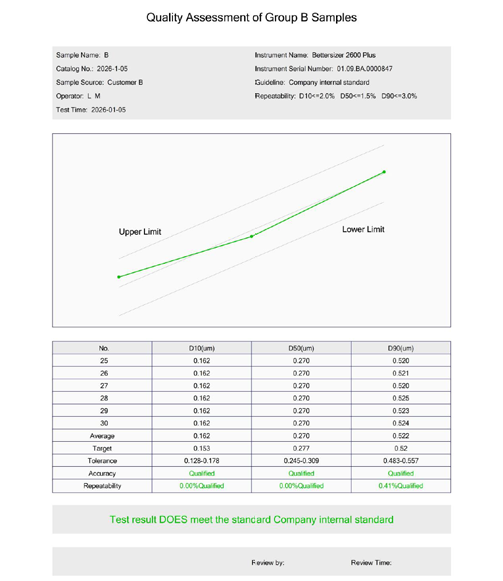
Figure 3. Data evaluation report for six consecutive production batches. Image Credit: Bettersize Instruments
It was noted that the D10 and D50 values remained largely constant across batches, with minor variation observed in D90.
The overall trend features small fluctuations around the target curves, demonstrating good definition in the selected tolerance ranges. The ranges were practical enough for routine manufacturing control, yet sensitive enough to distinguish batch-to-batch differences.
These tolerances could potentially be tightened more with continued process optimization and increased process stability, further strengthening brand consistency and improving product uniformity.
The software provides an intuitive and objective assessment of batch compliance by directly comparing measured particle size distributions with the target curves.
Average values, repeatability metrics, and pass/fail status are reported automatically, considerably reducing the need for subjective assessments and manual calculations.
The system flags the deviation when any particle size parameter exceeds the predefined tolerance, allowing engineers to rapidly investigate potential causes such as insufficient grinding, raw material variability, or changes in dispersion conditions.
This example highlights the utility of the software’s ‘data evaluation’ function in routine quality control operations. Continuous particle size monitoring allows ink manufacturers to rapidly respond to process deviations, maintaining stable production processes and consistent product performance.
Summary
This article detailed the use of practical ink samples from two Bettersize customers to showcase the Bettersizer 2600 Plus’ capacity to serve as a reliable and versatile particle size analysis platform for both routine quality control and ink formulation development.
The Bettersizer 2600 Plus delivers highly repeatable and precise particle size measurements in R&D applications, facilitating the effective evaluation of formulation optimization, grinding processes, and performance-driven decision making.
In quality control settings, it supports consistent batch-to-batch particle size control, improves process stability, and allows the rapid detection of deviations via automated repeatability monitoring and data evaluation.
The Bettersizer 2600 Plus represents a robust analytical solution for ink manufacturers that helps maintain high product quality while enhancing development efficiency and maintaining stable, reliable production processes.
Acknowledgments
Produced from materials originally authored by Zhichao Han, Application Engineer at Bettersize Technologies.

This information has been sourced, reviewed and adapted from materials provided by Bettersize Instruments.
For more information on this source, please visit Bettersize Instruments.