Combined analytical techniques are required to adequately cover the gravel-to-clay fractions when working with wide-range sediment particle size distributions (PSDs). Laser diffraction provides high-resolution measurements of fine particles, while sieving provides mass-based characterization of coarse particles.
Differences in reporting bases can, however, complicate dataset integration. This article outlines a practical workflow for combined sieve and laser diffraction analysis. Software-embedded data integration solutions are also employed to simplify full-range PSD analysis while maintaining reproducibility and mass consistency.
Introduction
Sediment particle size distributions (PSDs) typically encompass a wide size range, meaning that a single technique may struggle to offer adequate resolution, coverage, and efficiency.
Comparatively uniform materials such as clay or clean gravel can be analyzed using a single method, but heterogeneous sediments containing gravel, silt, sand, and clay require a combined analytical approach to determine the entire size distribution.
ISO 17892-4:2016 and other international standards allow PSD to be determined by sedimentation, sieving, or a combination of methods.1 Conventional sedimentation procedures are operator dependent and time consuming, however, and merging datasets from different techniques can be error prone and labor intensive.2

Image Credit: Bettersize Instruments
Laser diffraction has, therefore, seen widespread use with fine particles due to its high resolution and speed, while sieving remains physically transparent and robust enough for the coarse fraction.
Different measurement bases pose a key challenge: sieving reports mass-based size fractions defined by minimum dimension, while laser diffraction delivers volume-based equivalent spherical diameters. Careful data transformation and mass-controlled integration are, therefore, required to ensure a consistent full-range PSD is obtained.
This practical, reproducible workflow combines sieving and laser diffraction to generate full-range PSDs for broadly distributed sediments. The Bettersizer 2600 Plus is used for the study presented here, offering a sizing range of 0.02–3500 μm.
Coarse particles (greater than one millimeter (mm)) are characterized via sieving, while fine fractions (less than 1 mm) are characterized via laser diffraction. The software’s integrated data-merging function streamlines cutoff management, volume-to-mass conversion, and dataset alignment, ensuring consistent and efficient full-range PSD analysis.
Measurement and Analysis Workflow
The employed workflow reflects a commonly used laboratory practice for combined sieving and laser diffraction analysis of wide-range sediments (see Figure 1).
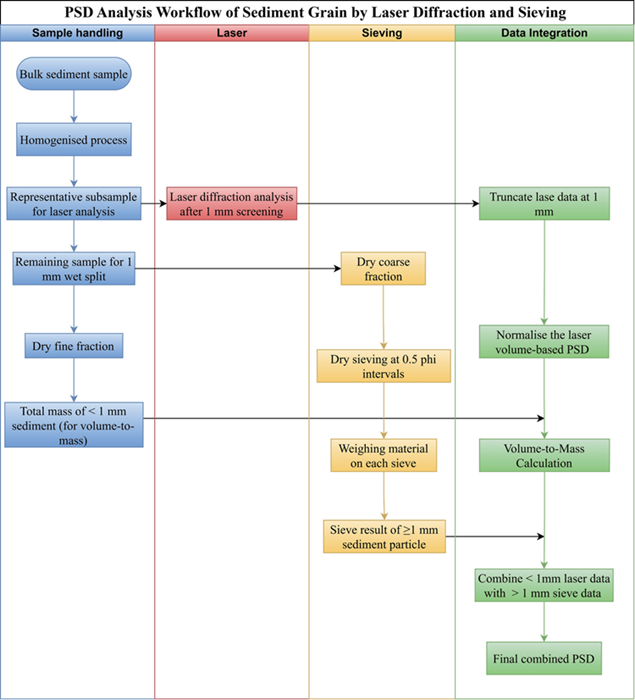
Figure 1. Integrated workflow for combined sieve and laser diffraction grain-size analysis. Image Credit: Bettersize Instruments
Sample Handling
Once thorough homogenization has been achieved, the bulk sediment must be separated using a 1 mm cutoff. A representative subsample is then removed for laser diffraction analysis. This is typically a few grams of the sample.
The remaining sample is then wet-split at 1 mm using gentle washing. Next, the fraction smaller than 1 mm is collected, oven-dried, and weighed to determine the total fine-fraction mass. The fraction that is greater than one mm is retained at this point to use for dry sieving.
The total mass passing the 1 mm sieve provides the mass constraint used for subsequent data integration.
It is important to note that a small amount of fine material may pass into the pan during dry sieving of the greater-than-1-mm fraction in the sieve path. This pan fraction should be included in the total mass of less than 1 mm to maintain mass balance.
Laser Diffraction Path
Laser diffraction is used to characterize the fine fraction (less than 1 mm). A Bettersizer 2600 Plus is used to measure fine sediment, delivering a high-resolution particle-size distribution in terms of equivalent spherical diameter. This data is generally exported as volume percentages.
Sieve Path
Standard dry-sieve stacking is used to characterize the coarse fraction (> 1 mm). This is performed in line with ISO 17892-4, employing geometrically spaced sieve apertures at 0.5 φ intervals. Sieve sizes in this study included 1, 1.4, 2, 2.8, 4, 5.6, 8, 11.2, and 16 mm.
The mass-based size distribution of the coarse fraction was determined by recording the mass retained on each sieve.
Data Integration
The industry-accepted workflow is embedded directly into the software logic, rather than treating data merging as an external post-processing step. The cutoff size (1 mm) is defined as the merging point between the laser and sieve datasets (Figure 2).
The user must enter the mass retained in each coarse sieve interval (≥1 mm), while the software calculates the total <1 mm mass on the mass balance.
The software then performs volume-to-mass conversion of the laser data, internal normalization, and mass-constrained merging to generate the final full-range PSD.
The integrated output features the combined PSD table and derived statistical parameters, including sorting, skewness, mean size, and kurtosis.
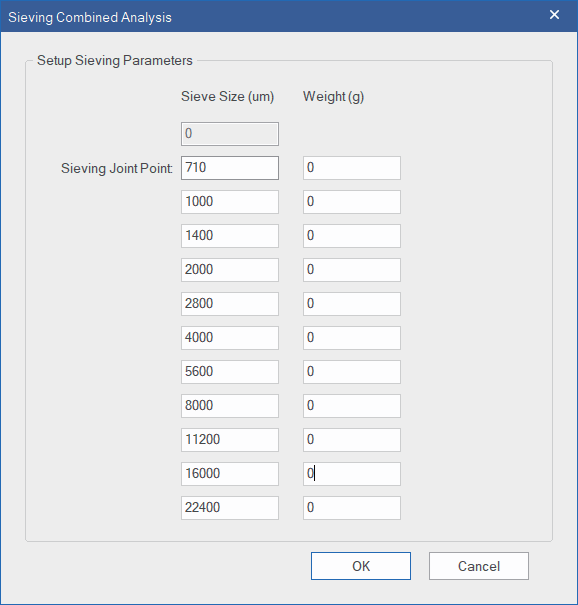
Figure 2. Software interface for sieve-laser data integration. Image Credit: Bettersize Instruments
Result and Discussion
The two samples were analyzed using dry sieving to produce a mass-based distribution, and laser diffraction to provide a high-resolution volume-based PSD.
Table 1 shows the sieving results and the total mass of the less than 1 mm fraction. Figure 3 features the laser diffraction curve and accompanying table, highlighting good repeatability and consistent distribution profiles across a total of six replicates.
Table 1. Sieve results for two sediment samples. Source: Bettersize Instruments
| Diameter (mm) |
Sample State |
| Sample 1 |
Sample 2 |
| 16 |
4.38 |
0.43 |
| 11.2 |
13.23 |
9.46 |
| 8 |
17.09 |
23.19 |
| 5.6 |
22.93 |
19.72 |
| 4 |
21.37 |
11.58 |
| 2.8 |
25.46 |
7.74 |
| 2 |
27.11 |
7.38 |
| 1.4 |
30.37 |
9.69 |
| 1 |
31.08 |
1.93 |
| Dried sieve <1 mm |
24.92 |
5.47 |
| Dry < 1 mm |
132.10 |
37.50 |
| Total < 1 mm |
157.02 |
43.07 |
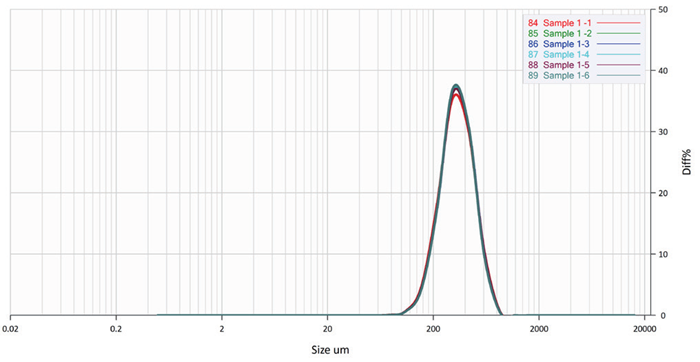
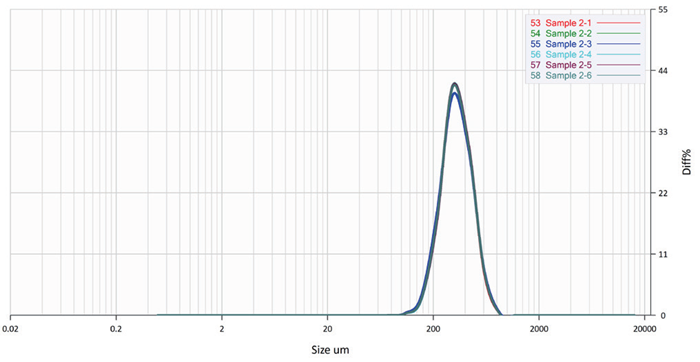
Figure 3. The PSD curve of laser diffraction results of two samples. Image Credit: Bettersize Instruments
The embedded integration module was used to merge the sieve and laser datasets under mass conservation constraints (Figure 4). The integrated analysis generated a full-range grain-size distribution spanning 0.02 μm to 16 mm, with no artificial discontinuities and a smooth transition across the 1 mm cutoff.
In the exported report, it is possible to obtain key sediment descriptors directly from the reports.
Full-Range PSD Curves
The software enables detailed review by outputting differential and cumulative PSDs, as well as the merged data table.
Textural Composition (Gravel–Sand–Mud)
The gravel, sand, and mud fractions are calculated automatically for use in ternary plots. This is done based on standard sediment classification boundaries (gravel = greater than 2 mm; sand = 63 μm–2 mm; ud < 63 μm).
Sample 1 is classified as gravelly sand in this study, with 0 % mud, 29.84 % gravel, and 70.16 % sand, while Sample 2 is sandy gravel with 0 % mud, 53.77 % gravel, and 46.23 % sand.
Phi-scale Descriptive Parameters
The software converts the merged PSD to the phi (φ) scale and reports standard grain-size statistics, including skewness, mean size, sorting, and kurtosis.
The sorting value of Sample 1 is 1.752 in this study, while Sample 2 exhibits a slightly higher value of 1.89. This difference highlights that Sample 2 is more poorly sorted and features a broader grain-size distribution.
Both samples were found to be within the poorly sorted category, which is common for sediments that include mixed gravel-sand fractions.
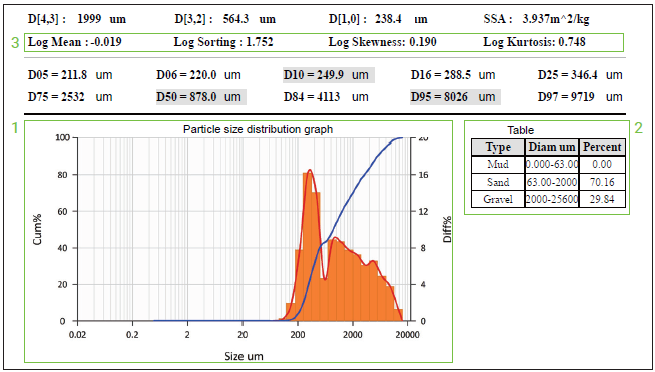
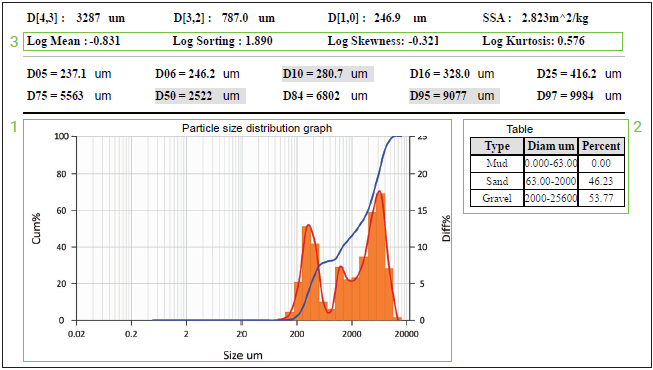
Figure 4. Full-range PSD results after software-assisted merging of sieve (>1 mm) and laser diffraction (<1 mm) datasets for two sediment samples. Sample 1 is shown on the top and Sample 2 on the bottom. Image Credit: Bettersize Instruments
Conclusion
This article outlined a practical workflow for full-range sediment particle size analysis. The workflow combined laser diffraction (less than 1 mm) and sieving (greater than 1 mm), enabling full coverage from coarse to fine fractions.
Coarse and fine datasets can be automatically merged by embedding an established data integration workflow into the software logic, without the need to rely on external spreadsheet calculations.
The software’s built-in volume-to-mass conversion, cutoff management, and integrated reporting functions facilitate the efficient generation of continuous full-range PSD results along with gravel-sand-mud fractions and statistical parameters.
The system’s report editing function supports customization in line with industry-specific requirements and the need for flexible output formats, accommodating a range of different application scenarios, including standardized reporting within monitoring or regulatory frameworks.
References and Further Reading
- International Organization for Standardization (2016) ISO 17892-4:2016. Geotechnical investigation and testing – Laboratory testing of soil – Part 4: Determination of particle size distribution.
- Liu, P. Sediment grain-size analysis methods.
Acknowledgments
Produced from materials originally authored by Perfil Liu, Senior Application Engineer at Bettersize Technologies.

This information has been sourced, reviewed and adapted from materials provided by Bettersize Instruments.
For more information on this source, please visit Bettersize Instruments.