Final product control is key to ensuring that milk powder meets strict regulatory standards, extends shelf life, and guarantees consistent nutritional quality and comprehensive quality assurance.
These considerations are particularly important for dairy ingredients used in sensitive applications and infant formula.
Near-infrared spectroscopy (NIRS) is a rapid, reagent-free technique suitable for directly measuring key quality parameters in milk powder, including protein, moisture, lactose, and fat content.
The NIRS solution does not require sample preparation, enabling real-time monitoring in the lab or directly on the production line. Producers leveraging NIRS are better positioned to minimize waste, react quickly to process variations, and maintain product integrity batch after batch.
Experimental Equipment
An OMNIS NIR Analyzer (Figure 1) was used to analyze over 600 samples of powdered milk from different suppliers.
The various milk powders were placed into an OMNIS sample cup before being analyzed in diffuse-reflection mode. Each sample was rotated during measurement to include sample variety, allowing spectra to be collected from different locations.
Automatically averaged spectra were used for model development, while reference values were obtained using official methods, such as AOAC 939.02 (protein), AOAC 927.05 (moisture), and AOAC 932.06 (fat). A phenol-sulfuric acid method was used for the lactose content determination.
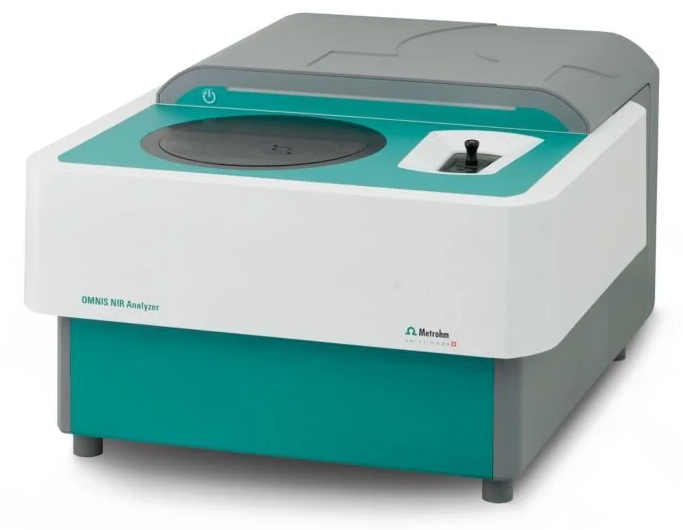
Figure 1. OMNIS NIR Analyzer Liquid/Solid. Image Credit: Metrohm Middle East FZC
Result
Acquired NIR spectra (Figure 2) were employed in the creation of prediction models suitable for each reference parameter. An external validation set was also used to verify the calculated prediction models’ predictive performance.
Figures 3 to 6 feature correlation diagrams showing the relationship between the NIR prediction and the reference values, along with the respective figures of merit (FOM).
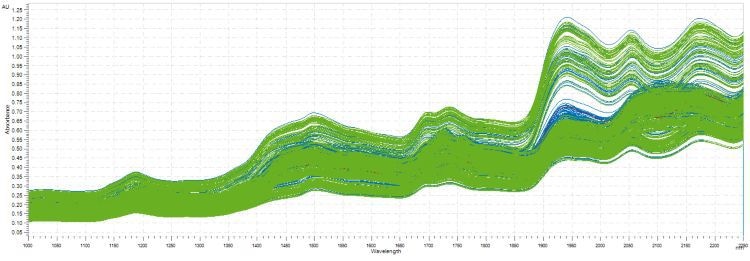
Figure 2. NIR spectra of milk powder samples. Data was obtained with an OMNIS NIR Analyzer. Spectra shown in blue have been used to calibrate the model, while green spectra have been used for validation. Image Credit: Metrohm Middle East FZC
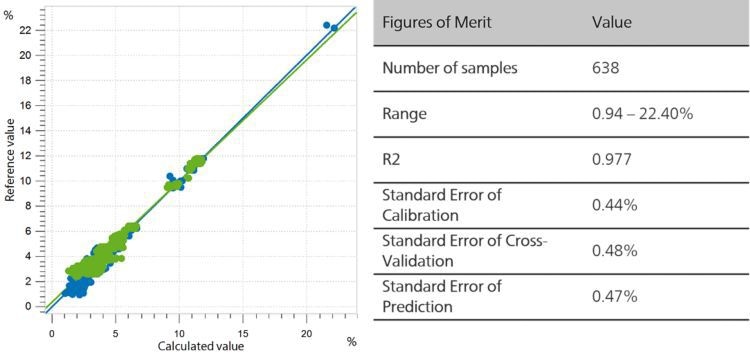
Figure 3. Correlation diagram and the respective FOMs for the prediction of moisture content in milk powder using an OMNIS NIR Analyzer. Reference values were obtained according to AOAC 927.05. Image Credit: Metrohm Middle East FZC
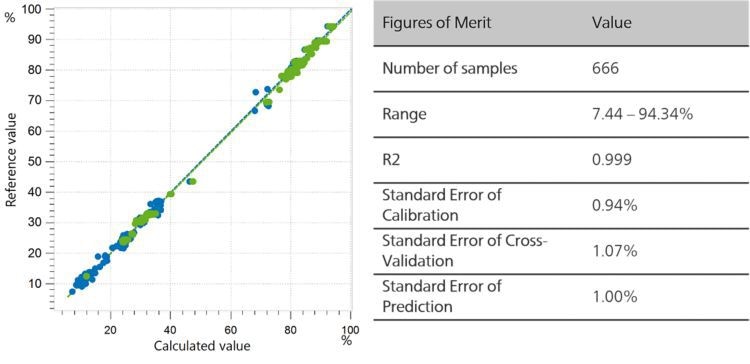
Figure 4. Correlation diagram and the respective FOMs for the prediction of protein content in milk powder using an OMNIS NIR Analyzer. Reference values were obtained according to AOAC 939.02. Image Credit: Metrohm Middle East FZC
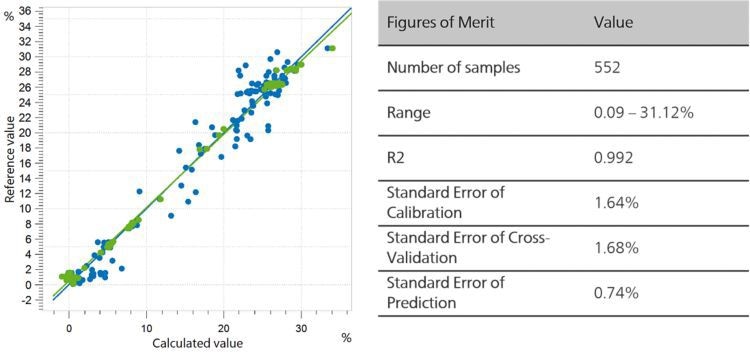
Figure 5. Correlation diagram and the respective FOMs for the prediction of fat content in milk powder using an OMNIS NIR Analyzer. Reference values were obtained according to AOAC 932.06. Image Credit: Metrohm Middle East FZC
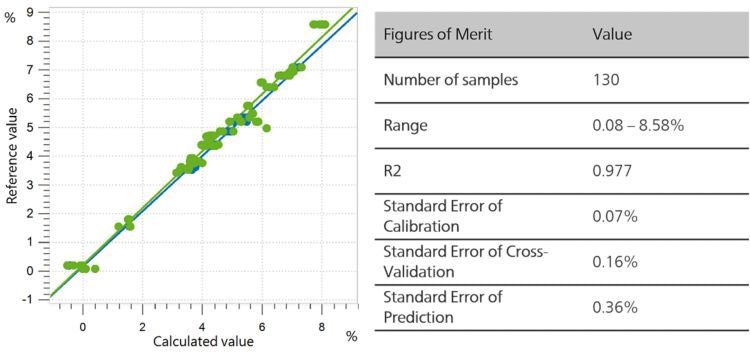
Figure 6. Correlation diagram and the respective FOMs for the prediction of lactose content in milk powder using an OMNIS NIR Analyzer. Image Credit: Metrohm Middle East FZC
Conclusion
NIR spectroscopy has proven applicability in the analysis of milk powder.
Models for a number of quality parameters (fat, lactose, protein, and moisture content) were generated, while independent validation samples verified the models’ robustness and reliability. Using this approach, it was possible to achieve high correlation coefficients and low prediction errors across all parameters.
It is also important to note that the dataset featured samples acquired from diverse global origins, capturing a wide range of product variability. This study confidently demonstrates that NIRS can be successfully integrated into the quality control workflow for dairy powder analysis.

This information has been sourced, reviewed, and adapted from materials provided by Metrohm Middle East FZC.
For more information on this source, please visit Metrohm Middle East FZC.