Maintaining consistent quality in food production is non-negotiable - especially for indulgent products like chocolate, where composition directly impacts taste, texture, and consumer trust. Manufacturers must ensure every batch meets strict regulatory and quality standards, without slowing down production.
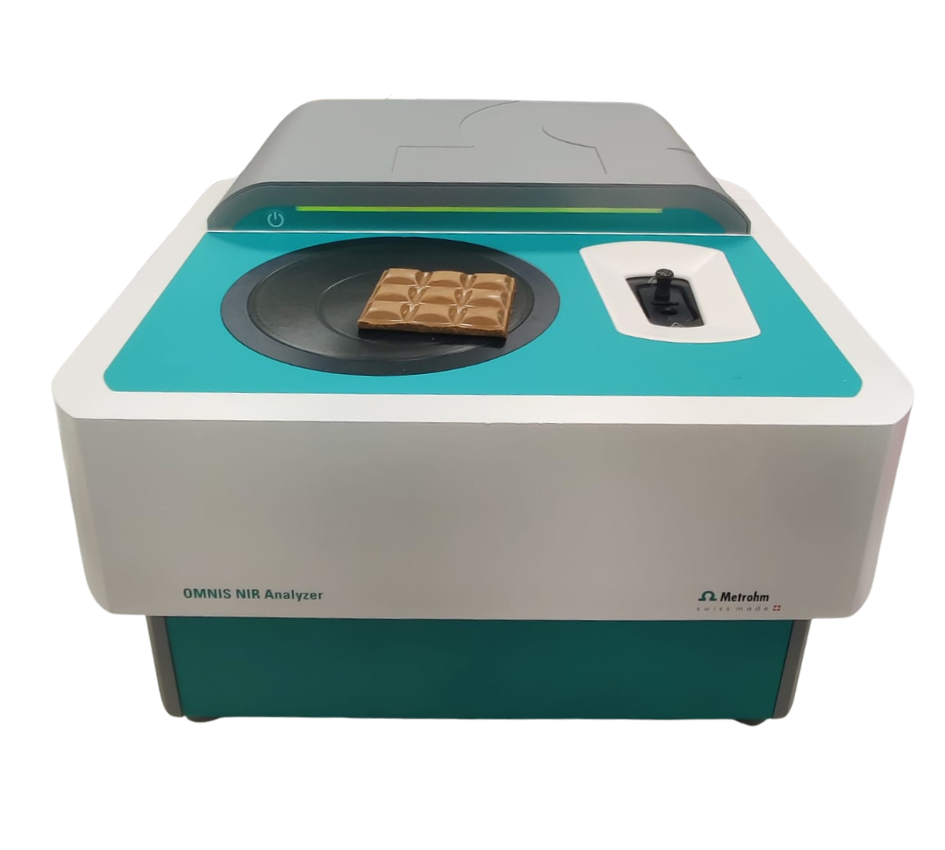
Image Credit: Metrohm Middle East
Traditional analytical methods can be time-consuming, require complex sample preparation, and rely on chemical reagents. But what if key quality parameters could be measured in seconds, with no prep at all?
A faster approach to chocolate and artificial sweetener analysis
Near-infrared spectroscopy (NIRS) offers a rapid, non-destructive alternative for assessing chocolate composition. Using diffuse reflection measurements, chocolate bars can be analysed directly - no grinding, no solvents, no delays.
With the Metrohm OMNIS NIR Solid Analyzer, manufacturers can perform real-time quality control either in the lab or directly on the production line, supporting faster decision-making and reduced operational bottlenecks.
What can be measured?
NIRS enables simultaneous prediction of multiple key parameters, including:
- Calories
- Fat and saturated fat
- Carbohydrates and sugar
- Protein
By capturing NIR spectra and applying advanced modelling techniques, reliable predictions can be generated in seconds - helping ensure product consistency across batches and suppliers.
Why it matters
For chocolate manufacturers, this approach delivers:
- Faster results compared to conventional methods
- No chemical reagents or sample prep
- Reduced operational costs
- Improved process efficiency and throughput
For more details contact a Metrohm Specialist.
Read the Full App Note