Ethylene oxide (EtO) is a carcinogenic and mutagenic compound that is widely used in the chemical industry, particularly for sterilizing medical products and as a reaction intermediate in the production of ethylene glycol.

Image Credit: sergey kolesnikov/Shutterstock.com
Due to its toxicity, federal, state, and local regulatory agencies have placed increasing emphasis on monitoring very low concentrations of EtO in and around commercial sterilization facilities.
Measurement Challenges
Detecting ethylene oxide at low concentrations has traditionally been difficult with quadrupole mass spectrometry due to interference from compounds of the same molecular weight, including CO2, propane, and acetaldehyde, which may be present in the sample matrix. EtO is also highly reactive, especially in the presence of acids, making it challenging to collect and preserve stable samples for laboratory analysis.
Scrubber systems at sterilization facilities often use aqueous acids to convert ethylene oxide into ethylene glycol. If residual acid mists remain in the sampled gas, a portion of the EtO may be lost during sampling. In addition, EtO is difficult to trap and concentrate because of its low boiling point.
These challenges require an analytical technology that is optimized for direct, real-time measurement of ethylene oxide.
Solution
The Thermo Scientific™ MAX-iR™ FTIR Gas Analyzer, equipped with the Thermo Scientific™ StarBoost™ Technology optical enhancement, addresses these analytical challenges.
StarBoost technology dramatically improves the MAX-iR Analyzer's signal-to-noise ratio (SNR), enabling minimum detection limits (MDLs) up to 50 times lower than those of other commercially available Fourier-transform infrared (FTIR) gas analyzers, without requiring extremely long path gas cells.
This optically enhanced FTIR (OE-FTIR) technology enables real-time detection of ethylene oxide at concentrations below one part per billion (ppb).
The MAX-iR Analyzer also serves as the core component of the fully automated Thermo Scientific™ EMS-10™ Continuous Emissions Monitoring System (CEMS), which incorporates the flexible Thermo Scientific™ MAX-Acquisition™ Control Software and complies with US Environmental Protection Agency (EPA) CEMS requirements.
This article considers both laboratory performance studies and field evaluations to demonstrate how the EMS-10 System satisfies the requirements for continuous ethylene oxide emissions monitoring.
Field trials were performed at a commercial sterilization facility in North America, where the EMS-10 System continuously monitored EtO emissions from a common exhaust stack.
US EPA ALT-142 authorizes the use of OE-FTIR as an alternative to gas chromatography (GC) for EtO emissions testing at commercial sterilization facilities regulated under 40 CFR Part 63, Subpart O.
All data presented in this study was collected using an EMS-10 System configured with a MAX-iR Analyzer and StarBoost Technology. Details of the FTIR configuration are provided in Table 1.
Table 1. MAX-iR Analyzer configuration details. Source: Thermo Fisher Scientific – Environmental and Process Monitoring Instruments
| . |
. |
| Detector |
InAs |
| Laser type |
VCSEL diode laser |
| Optical path length |
9.86 m |
| Gas cell volume |
0.4621 L |
| Pressure sensor |
1 atm |
| Gas cell windows |
CaF2 |
| Gas cell O-rings |
Viton |
| Gas cell mirror material |
Nickel-plated aluminum with gold coating |
| StarBoost optical enhancement filter |
Long pass filter |
| Spectral range |
2900–3400 cm-1 |
Table 2. Reference gas cylinder information. Source: Thermo Fisher Scientific – Environmental and Process Monitoring Instruments
| Cylinder ID |
Expiration date |
Gas |
Certified concentration |
Analytical uncertainty |
| CC736527 |
30 September, 2023 |
Ethylene oxide |
1223 ppb |
±10% |
| CC736527 |
30 September, 2023 |
Ethane |
100.2 ppm |
±10% |
| CC512410 |
25 May, 2030 |
Ethylene |
97.78 ppm |
±1% |
Laboratory Performance Study
Materials
Table 2 summarizes the certified EtO calibration standard used throughout the testing protocol (referred to as the "reference gas"), which also contained ethane as a tracer for dynamic spike recovery evaluations. Ethylene served as the calibration transfer standard (CTS) during routine pre-test quality assurance and quality control procedures.
Gas compositions were verified by the manufacturer through direct comparison with National Institute of Standards and Technology (NIST)-traceable calibration standards and/or NIST gas mixture reference materials.
Ultra-high-purity (UHP) nitrogen was used both to dilute the reference gas mixture and to zero the MAX-iR Analyzer. Before testing began, routine MAX-iR diagnostic procedures and direct calibration checks were completed to confirm proper analyzer performance.
Limit of Detection
The limit of detection (LOD) evaluation established the minimum EtO concentration that could be distinguished from the background within a representative gas matrix.
The EMS-10 System sampled ambient laboratory air at its target sample flow rate. Ethylene oxide measurements were collected over seven to 11 consecutive one-minute scans, and the LOD was calculated as three times the standard deviation of those measurements. The results are presented in Table 3.
Table 3. Ethylene oxide LOD results. Source: Thermo Fisher Scientific – Environmental and Process Monitoring Instruments
|
Average |
Standard deviation (σ) |
LOD (3 σ) |
| Ethylene oxide (ppb) |
-0.3 |
0.2 |
0.6 |
Accuracy and Linearity
Accuracy and linearity testing was conducted at concentrations near the emissions standard, although the same procedure can also be applied to facility-specific action levels.
An EtO reference gas was introduced directly into the MAX-iR Analyzer for measurement. The reference gas was then diluted with nitrogen to produce three target concentrations: low (26.6 ppb), medium (51.9 ppb), and high (99 ppb).
Each concentration was measured three times, producing nine measurements while ensuring that identical concentration levels were not introduced consecutively.
For each concentration, percent error was calculated by comparing the expected reference concentration with the average measured concentration and dividing the difference by the 99 ppb span value.
Linearity was evaluated by plotting the expected concentration against the average measured concentration to determine the R2 value. Accuracy results are summarized in Table 4, while linearity results are shown in Figure 1.
Table 4. Ethylene oxide accuracy results. Source: Thermo Fisher Scientific – Environmental and Process Monitoring Instruments
| Level |
Replicate |
EtO concentration (ppb) |
Error (% of span) |
|
|
Target |
Measured |
|
| Zero |
1 |
0.0 |
-1.1 |
-MDL |
| Low |
1 |
26.6 |
24.6 |
-1.95% |
| Mid |
1 |
51.9 |
50.5 |
-1.38% |
| High |
1 |
99.0 |
98.1 |
-0.93% |
| Zero |
2 |
0.0 |
-1.1 |
-MDL |
| High |
2 |
99.0 |
98.2 |
-0.76% |
| Mid |
2 |
51.9 |
50.7 |
-1.12% |
| Low |
2 |
26.6 |
24.8 |
-1.72% |
| Zero |
3 |
0.0 |
-0.6 |
-MDL |
| High |
3 |
99.0 |
99.4 |
0.35% |
| Low |
3 |
26.6 |
25.2 |
-1.40% |
| Mid |
3 |
51.9 |
51.0 |
-0.86% |
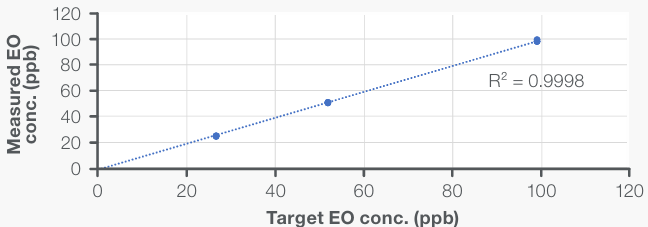
Figure 1. Ethylene oxide linearity results. Image Credit: Thermo Fisher Scientific – Environmental and Process Monitoring Instruments
Response Time
This evaluation measured how quickly the EMS-10 System responded to changes in EtO concentration while operating at its target sample flow rate. Zero gas was first introduced into the system at a flow rate exceeding the sample pump capacity.
Next, the high-level EtO reference gas (99 ppb) was introduced. Once the analyzer response stabilized, defined as varying by no more than 1%, the time required to reach 95% of full scale (rise time) was measured at 12 seconds.
The zero gas was then reintroduced, and after the analyzer response stabilized, the time required to decrease below 5% of full scale (fall time) was11 seconds. The response profile is shown in Figure 2.
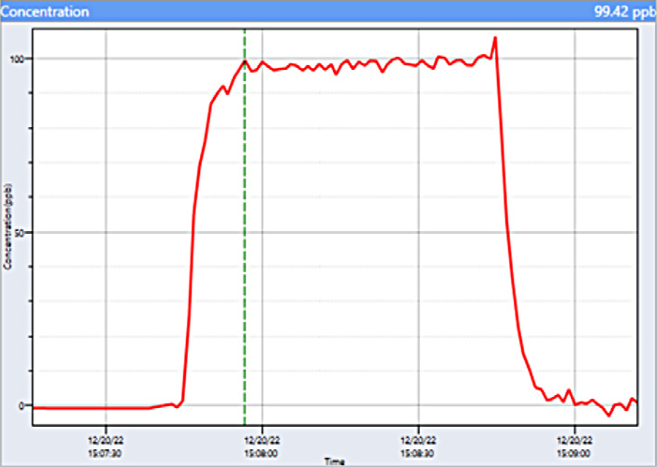
Figure 2. Ethylene oxide response time. Image Credit: Thermo Fisher Scientific – Environmental and Process Monitoring Instruments
Field Study
Field evaluations were conducted at a commercial sterilization facility, where the EMS-10 System continuously monitored EtO emissions from a common stack in accordance with U.S. EPA ALT-142. A stainless steel sampling probe was installed in the stack and connected to a 100 foot sample line maintained at 120 °C.
The heated sample line fed the EMS-10 System, which included a heated particulate filter and diaphragm pump operating at 120 °C. An unheated exhaust line connected to the system outlet removed the sampled gas from the testing location.
Following routine pre-test diagnostics and direct calibration verification, analyte spiking was performed in accordance with US EPA Method 301 to demonstrate instrument precision and bias.
This procedure also verified effective transport of ethylene oxide throughout the complete EMS-10 sampling system by challenging the entire sampling train. A reference gas containing 154 ppb EtO was introduced into the native stack emissions.
Table 5. Analyte spike data for US EPA Method 301 Section 12. Source: Thermo Fisher Scientific – Environmental and Process Monitoring Instruments
| Test run |
Tracer (ppmv) |
Dilution factor |
Ethylene oxide (ppmv) |
Calculated spike level (ppmv) |
Percent recovery |
|
Spiked |
Native |
|
Spiked |
Native |
|
|
| 1 |
29.188 |
0.013 |
0.061 |
0.136 |
0.028 |
0.146 |
92.7% |
| 2 |
29.306 |
0.059 |
0.061 |
0.138 |
0.036 |
0.151 |
91.1% |
| 3 |
29.273 |
0.041 |
0.061 |
0.140 |
0.034 |
0.148 |
94.1% |
| 4 |
29.386 |
0.056 |
0.061 |
0.138 |
0.041 |
0.155 |
88.6% |
| 5 |
29.365 |
0.047 |
0.061 |
0.142 |
0.038 |
0.153 |
92.8% |
| 6 |
29.404 |
0.087 |
0.061 |
0.143 |
0.030 |
0.146 |
98.1% |
| 7 |
29.392 |
0.048 |
0.061 |
0.144 |
0.042 |
0.157 |
91.7% |
| 8 |
29.439 |
0.068 |
0.061 |
0.143 |
0.043 |
0.157 |
90.8% |
| 9 |
29.373 |
0.048 |
0.061 |
0.146 |
0.044 |
0.158 |
92.5% |
| 10 |
29.416 |
0.076 |
0.061 |
0.147 |
0.042 |
0.156 |
94.2% |
| 11 |
29.422 |
0.051 |
0.061 |
0.142 |
0.045 |
0.159 |
89.3% |
| 12 |
29.425 |
0.099 |
0.061 |
0.148 |
0.045 |
0.159 |
93.1% |
| Mean |
29.366 |
0.058 |
0.061 |
0.142 |
0.039 |
0.154 |
92.4% |
Table 6. Statistical analysis for US EPA Method 301 Section 12. Source: Thermo Fisher Scientific – Environmental and Process Monitoring Instruments
| Bias analysis |
Value |
Criteria |
Validation |
| Relative bias, BR |
7.63% |
<10% |
PASS |
| Relative standard deviation, RSD |
2.82% |
<20% |
PASS |
Results and Conclusions
When configured with StarBoost Technology, the EMS-10 System provides an effective solution for monitoring low-level ethylene oxide emissions from commercial sterilization and chemical manufacturing facilities.
With a limit of detection below 1 ppb and response times under 15 seconds, the EMS-10 OE-FTIR System demonstrated substantially better performance than conventional gas chromatography systems, which typically achieve detection limits of approximately 50 ppb with analysis times of 10 minutes or longer.
Using technology capable of lower detection limits also helps prevent over-reporting of emissions when routine stack concentrations remain below 50 ppb.
In addition to exceeding current US EPA performance requirements for ethylene oxide monitoring, the flexibility and sensitivity of the EMS-10 OE-FTIR System make it well-suited to accommodate future regulatory changes, including updates to the National Emissions Standards for Hazardous Air Pollutants (NESHAP) and the Ethylene Oxide Emission Standards for Sterilization Facilities (40 CFR Part 63, Subpart O).
Table 7. Summary of results. Source: Thermo Fisher Scientific – Environmental and Process Monitoring Instruments
| Test |
Measurement |
Result |
| Limit of detection |
3 σ |
0.6 ppb |
| Accuracy |
Average error (% of span) |
-1.08% |
| Linearity |
R2 |
0.9998 |
| Response time |
Rise time |
12 seconds |
| Fall time |
11 seconds |
| Spike recovery |
Average % recovery |
92.37% |
| US EPA Method 301 |
Relative bias |
7.63% |
| Precision (RSD) |
2.82% |

This information has been sourced, reviewed, and adapted from materials provided by Thermo Fisher Scientific – Environmental and Process Monitoring Instruments.
For more information on this source, please visit Thermo Fisher Scientific – Environmental and Process Monitoring Instruments.