Microplastic contamination has become a growing environmental concern in water, land, and even the atmosphere. Beyond its harmful effects on ecosystems and human health, recent findings showing microplastic contamination in bottled water and other beverages have put many companies at risk of negative publicity and brand erosion.
Addressing microplastic pollution requires a comprehensive understanding of its origins and pathways, beginning with the detection and identification of microplastics in various sample types.
The combination of the Thermo Scientific™ Nicolet™ iN10 MX Infrared Microscope, Thermo Scientific™ DXR3xi Raman Imaging Microscope, Thermo Scientific™ OMNIC™ Picta™ Software, and polymer libraries from Thermo Fisher Scientific provides a complete solution for investigating microplastics across a broad size range (1–5000 μm).
An Expanding Global Challenge
In recent years, the widespread presence of microplastic material (small synthetic plastic particles smaller than 5 mm) in the environment has attracted significant attention. Regulatory bodies, scientists, and manufacturers are working to identify their sources and pathways, evaluate their effects on ecosystems and human health, and establish effective approaches to handle the issue.
Materials such as simple synthetic fibers in clothing and plastic microbeads in consumer products have gradually introduced residual materials into the environment, particularly aquatic ecosystems. Following their accumulation in marine environments, microplastics are infiltrating freshwater, land, and even air.
Recent research has demonstrated a much more pervasive problem than previously feared.
Overall, 83% of the analyzed tap water samples were found to contain plastic fibers, with the United States showing the highest contamination level at 94% and Europe reporting the lowest at 72%.
Research at the State University of New York at Fredonia found that 93% of examined bottled water samples contained evidence of microplastic contamination, with at least part of this contamination originating from the packaging and bottling procedures. Microplastic fibers and fragments were also detected in beer, honey, sugar, and air.1
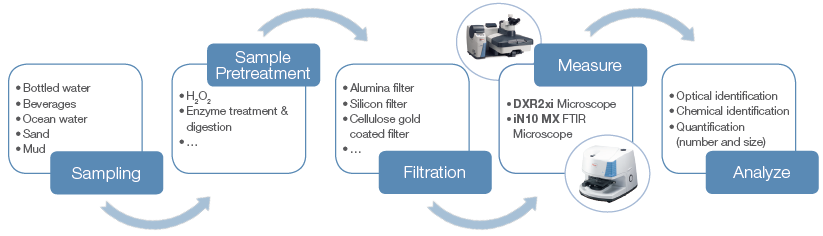
Figure 1. Schematic showing the typical workflow for microplastics analysis. Image Credit: Thermo Fisher Scientific - Vibrational Spectroscopy
The Thermo Fisher Scientific Solution
Figure 1 presents a typical workflow for microplastics evaluation. Following pre-treatment, liquid samples are passed through filters to eliminate biogenic materials, where required.
The dried filters are then directly placed onto the sample stage of microscopes for microspectroscopic evaluation. The Nicolet iN10 MX FTIR microscope is particularly suitable for analyzing microplastic particles larger than 10 μm. An example is illustrated in Figure 2.
The visual image (Figure 2A) contains over 200 video captures combined into a mosaic covering around 1 cm2. Approximately 17,500 spectra were acquired within ~30 minutes (50 μm steps and 0.1 s/spectrum). Representative spectra obtained from the filter itself and the spheres are displayed in Figure 2B.
Using a polyethylene spectrum from a reference standard, a correlation map was generated relating to each spectrum in the map (Figure 2D). In this map, red regions indicate strong correlation with polyethylene, whereas the blue field is uncorrelated. This evaluation can be completed automatically using the particle wizard of the Picta software.
After selecting a region from the video image, the software detects the relevant particles and proceeds to generate spectra for each particle. These spectra are subsequently searched against a spectral library, and a report catalogs the number of particles in the inspection area.
The data can then be back-extrapolated through the volume of filtered liquid to acquire a semi-quantitative measure of particulate concentrations.
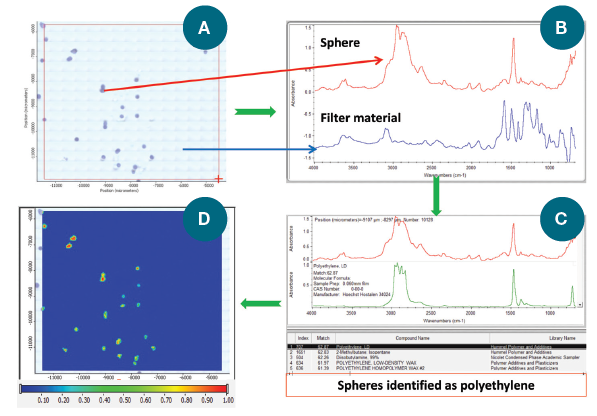
Figure 2. An example of using the Nicolet iN10 MX FTIR microscope for microplastics analysis. (A) A visual image of the filter showing particles; (B) Spectra of the particles and the filter paper; (C) Library search results for the particles; and (D) Correlation map of the particle spectrum. Image Credit: Thermo Fisher Scientific - Vibrational Spectroscopy
For particles smaller than 10 μm, the DXR3xi Raman imaging microscope provides an effective solution with spatial resolution down to 0.5 μm. Figure 3 demonstrates the evaluation of an ocean water sample acquired from the Pellestrina beach in the Lagoon of Venice. The DXR2xi Raman microscope software detected and located multiple particles on the alumina filter from the optical image (Figure 3A).
Only the regions of interest, based on predefined criteria, were chosen for spectral collection, which effectively reduced the overall analysis duration. During spectral measurement, a real-time MCR (multivariate curve resolution) enabled chemical identification of the particles while also providing direct visualization of the particles of different chemical origins (Figure 3B).
For instance, all three particles highlighted in Figure 3A are between five and 10 μm in size. The yellow particles were identified as polypropylene, while the gray particle was identified as PV23 Hoechst Laser pigment.
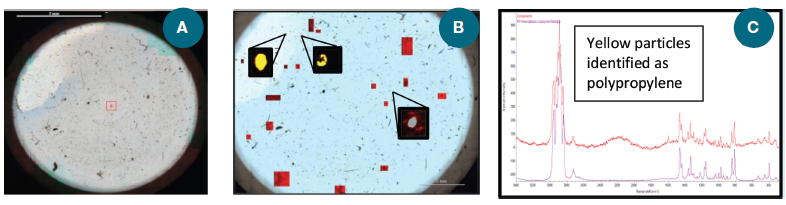
Figure 3. An example of microplastic analysis using the DXR2xi Raman microscope. (A) Video image of the alumina filter with microplastic particles; (B) Chemical image of the filter with microplastic particles; and (C) Spectrum of one of the yellow particles compared to the library spectrum of polypropylene. Image Credit: Thermo Fisher Scientific - Vibrational Spectroscopy
Conclusions
The broad size spectrum of microplastics (1–5000 μm) makes their analysis particularly challenging. Thermo Fisher Scientific addresses this challenge through a state-of-the-art product portfolio that features 1.) the Nicolet iN10 MX FTIR Infrared Microscope for particle sizes larger than 10 μm and 2.) the DXR3xi Raman Imaging Microscope for particles smaller than 1 μm in diameter.
The intelligence integrated into the Picta software enables automated evaluation in the filter regions containing microplastics, significantly improving analysis efficiency and reducing overall analysis time.
References and Further Reading
- Carrington, D. (2018). Plastic fibres found in tap water around the world, study reveals. The Guardian. The Guardian. Available at: https://www.theguardian.com/environment/2017/sep/06/plastic-fibres-found-tap-water-around-world-study-reveals.

This information has been sourced, reviewed, and adapted from materials provided by Thermo Fisher Scientific - Vibrational Spectroscopy.
For more information on this source, please visit Thermo Fisher Scientific - Vibrational Spectroscopy.