Microplastics are considered to be one of the most pervasive environmental pollutants, and their presence in aquatic sources, air, and the food chain raises several concerns. This has encouraged a number of environmental pollution regulation agencies across the globe to establish methods and limits for microplastic classification.
Yet, due to the size, diversity, and multidimensionality of these contaminants, there are significant challenges when it comes to establishing an appropriate characterization method.1,2
The California State Water Resources Control Board (SWRCB) has a working definition for microplastics in drinking water, categorizing them as large (100–5000 μm), small (1–100 μm), submicron (100–1000 nm), and nanoplastics (1–100 nm) based on size.
This has led to the release of a standardized protocol now available from the California SWRCB and the Southern California Coastal Water Research Project (SCCWRP). In the protocol, FTIR and Raman are the given methods for microplastic analysis.3
FTIR and Raman spectroscopies are the preferred choice of instrumentation for polymer analysis and QC, so it makes sense that they are the go-to techniques for determining the presence of microplastics.
The identification of conventional polymers is performed using the right spectral databases, which are well-suited for identifying non-degraded polymers from the production line. However, microplastics may have experienced various forms of environmental degradation, making it hard to identify them in the same way: oxidation and other exposure events, such as UV exposure, may cause spectral changes.
For the characterization of individual particles, micro-attenuated total reflectance (ATR) analysis of particles is commonly regarded as an effective method. However, automated micro-ATR can be limiting for multi-particle microplastic analysis as cross-contamination can occur when the micro-ATR tip moves from particle to particle due to material adhesion to the tip.
As a result, reflective mode is recommended as nothing touches the sample. However, the majority of commercial libraries were assembled using transmission or ATR mode. When collecting sample spectra in reflection mode, it is recommended that the reflection libraries are used to optimize spectral matches.
This article discusses the availability and use of a polymer library collection in reflection mode.
Today, a number of labs are working on processes to automate FTIR (and Raman) data acquisition and analysis for microplastics. Automated analysis of samples can be challenging as it involves locating particulates and finding the correct coordinates for analysis.
For many years, Thermo Fisher Scientific has led the way in developing advanced techniques for locating materials of interest driven by a robust, long-standing electron microscopy and software business.
This technology has now been made available for widespread use in FTIR microscopy through the Thermo Scientific™ OMNIC™ Paradigm™ Software launched with the Thermo Scientific™ Nicolet™ RaptIR™ FTIR Microscope. The Thermo Scientific Nicolet RaptIR X FTIR Microscope, the latest addition to the Nicolet RaptIR FTIR microscopy platform, is now available.
Included in the FTIR microscopy system are tools for the image capture of each particle with the capacity to identify the form factors (shape and size) for each particle; the aperture size assigned to each particle is determined by the form factors.
This optimizes the data quality of the overall analysis. The identity of the particles is produced by coupling the analysis with FTIR search capabilities, and the full software report provides a comprehensive analysis, completing the process.
Method
Sample Preparation
Microplastic-containing water and wastewater samples were processed in accordance with the SCCWRP/California SWRCB protocol.3 The resulting filtrate (1–50 μm) was filtered using a suitable filter such as silicon, gold-coated polycarbonate, Al2O3, or stainless steel.
The steps involved in the isolation and analysis of microplastics are shown in Figure 1. Air-based particles were collected by exposing the air filter/slide to the outdoor environment for an extended period.

Figure 1. Summary of steps involved in isolation and analysis of microplastics. Image Credit: Thermo Fisher Scientific - Vibrational Spectroscopy
FTIR Analysis
This article outlines the two types of data collection featured in this study. The first approach uses particle analysis and involves acquiring data from particles distributed across a filter: simply put, first find the particles, then collect and analyze them.
The second approach involves creating a chemical map of the entire filter, which means finding the particles using the FTIR spectra. Across both methods, a single-point LN2-cooled MCT detector was used for data capture at a resolution of 8 cm-1, and each spectrum was obtained from the coaddition of eight or 16 scans.
When using the particle analysis approach, image analysis was performed on the visual image of the filter to identify the particles based on the contrast against the filter itself. The software automatically positions the microscope stage for each material.
Then, the spectra are collected and analyzed against a set of suitable libraries for identification. After measuring hundreds or thousands of particles on the surface, the software is able to generate a complete particle analysis report with identity, size, shape, and distribution.
The chemical mapping method allows for analysis of the entire area of the filter as an image. This kind of analysis is extremely advantageous when there is minimal contrast between the particles and filter backdrop. The main drawback is a significant occurrence of ‘empty’ data pixels (points with no particles), which takes up time and memory storage.
It is also possible to analyze several different regions in a large sample rather than just the entire area in one map. Once the data has been collected, the particles can be identified by applying correlation, multivariate curve resolution (MCR), or principal component analysis (PCA) algorithms.
Microplastics Reflectance Library
A reference library for microplastics was developed using the CMDR Polymer Kit 1.0 from Hawaii Pacific University (HPU),6 Polysciences microbead standards, and polymer standards from Sigma-Aldrich.
Small particles were prepared with the help of a lab grinder or metal scraper. Reflection spectra at a resolution of 8 cm-1 and 32 scans were acquired from a minimum of three particles. The current list of materials in the microplastics reference library is exhibited in Table 1, which includes 30 of the most frequently used polymers and five common contaminants found in laboratories.
Table 1. Materials represented in the microplastics reference library used for particle identification. Materials found locally are marked with “lab” as the source. Source: Thermo Fisher Scientific - Vibrational Spectroscopy
| |
Name |
Source |
| 1 |
ULDPE (Ultra low density polyethylene) |
HPU |
| 2 |
LDPE (Low density polyethylene) |
HPU |
| 3 |
LLDPE (Linear low density polyethylene) |
HPU |
| 4 |
MDPE (Medium density polyethylene) |
HPU |
| 5 |
HDPE (High density polyethylene) |
HPU |
| 6 |
PP (Polypropylene) |
HPU |
| 7 |
PEST (Polyester poplin fabric) |
HPU |
| 8 |
PET1 (Polyethylene terephthalate) |
HPU |
| 9 |
PET2 (Recycled polyethylene terephthalate) |
HPU |
| 10 |
EVA (20% Ethylene-vinyl acetate) |
HPU |
| 11 |
ABS (Acrylonitrile-butadiene-styrene) |
HPU |
| 12 |
EPS (Expanded polystyrene foam) |
HPU |
| 13 |
PS (Polystyrene) |
HPU |
| 14 |
PA6 (Nylon 6) |
HPU |
| 15 |
PA66 (Nylon 6,6) |
HPU |
| 16 |
PVC 1 (Polyvinyl chloride) |
HPU |
| 17 |
PVC 2 (Polyvinyl chloride with phthalates) |
HPU |
| 18 |
CR (Crumb rubber from used tires) |
HPU |
| 19 |
CA* (Cellulose acetate) |
HPU |
| 20 |
PBS (Polystyrene-block-polybutadieneblock-polystyrene) |
Sigma-Aldrich |
| 21 |
Skin cells |
lab |
| 22 |
Cellulose fiber |
lab |
| 23 |
Soil/silica |
lab |
| 24 |
Nitrile gloves (blue) |
lab |
| 25 |
Hair |
lab |
| 26 |
PE (Polyethylene) |
Polysciences |
| 27 |
PE (Polyethylene with additive) |
Polysciences |
| 28 |
PMMA (Poly [styrene-co-methyl] methyl acrylate) |
Sigma-Aldrich |
| 29 |
PET (Polyethylene terephthalate) |
Sigma-Aldrich |
| 30 |
PC (Polycarbonate) |
Sigma-Aldrich |
| 31 |
PTFE (Polytetrafluoroethylene ethylene) |
Sigma-Aldrich |
| 32 |
PVDF (Polyvinylidene fluoride) |
Sigma-Aldrich |
| 33 |
Silicone |
Sigma-Aldrich |
| 34 |
Epoxy resin |
Sigma-Aldrich |
| 35 |
PU (Polyurethane) |
Sigma-Aldrich |
Results and Discussion
Particle Analysis Method: Analysis of Visually Located Particles
The Nicolet RaptIR FTIR Microscope equipped with OMNIC Paradigm Software completed microplastic analysis in just three simple steps.
First, a suitable region was selected for analysis; in Figure 2, a 10x10 mm silicon filter is displayed on which a broad range of particle sizes appear. The points highlighted red were selected automatically for analysis; these can also be edited by the user.
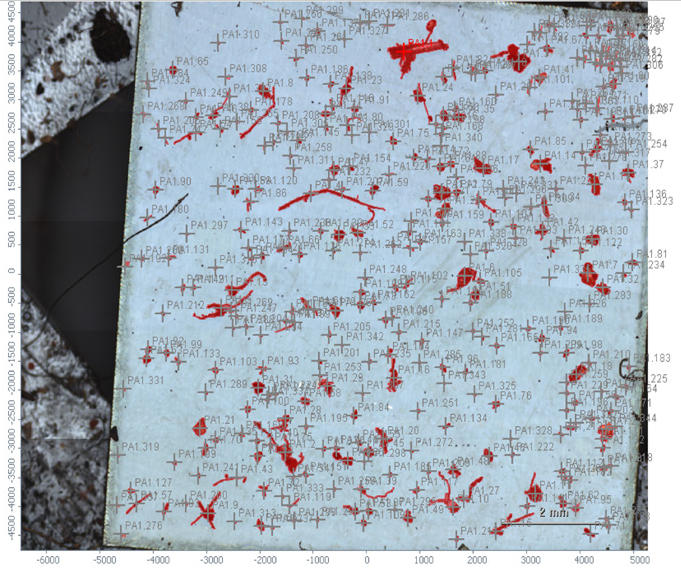
Figure 2. A silicon filter with atmospheric deposition of microplastics. Particles selected are between the size range of 25 μm to 1 mm. Image Credit: Thermo Fisher Scientific - Vibrational Spectroscopy
The second step consists of automatically measuring the FTIR spectra of all particles. The software automatically determines the aperture sizes needed, collects backgrounds, then charts an optimal path through the field of particles for data acquisition.
Depending on the number of particles analyzed and the number of scans collected, this can take anywhere between a few seconds and several minutes. A representative spectrum obtained using this mode is shown in Figure 3.
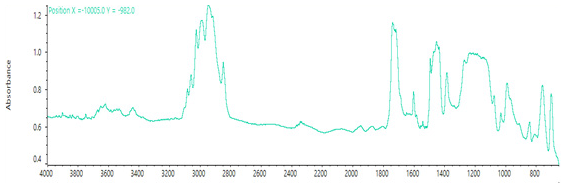
Figure 3. A single scan spectrum of a particle on a filter. Particle measured in reflectance; 16 scans coadded at 8 cm-1. Image Credit: Thermo Fisher Scientific - Vibrational Spectroscopy
The third step occurs once the measurement phase is complete; the particle analysis is run using the selected library. In this example, the microplastic reference library developed using the sources listed in Table 1 was used.
The report with particle identity, size, and a zoomed-in view of the particle itself can be seen in Figure 4(a), while Figure 4(b) shows the particle size distribution for each of the particle types identified. Polymer identification libraries can be tailored and applied to stored spectral data.
This feature allows researchers to use the newer polymer reference libraries to analyze the stored filter data sets. The entire report from the software offers insights into the total particles, the relative numbers of various materials found, and, from the shape, some marker of the effect of environmental forces (abrasion, etc.) on the particles.
The microscope’s speed, automation, and ease of use save time while allowing new users to achieve the same results as more experienced users, as described in this study.
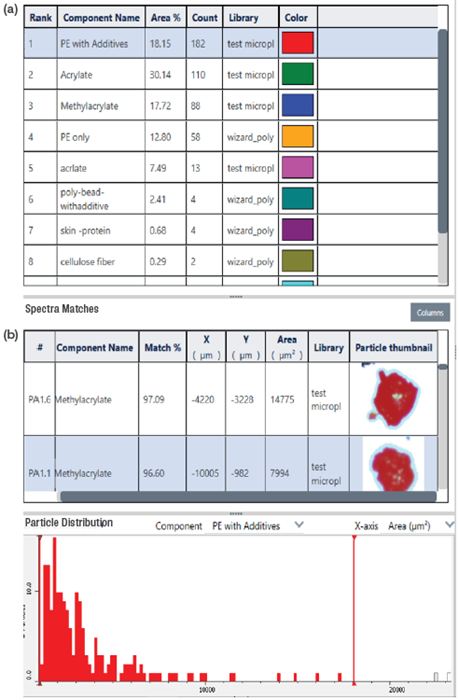
Figure 4(a). Report with full image, identification, particle size, and magnified particle image providing a complete picture. (b) Size distribution of each identification type. Image Credit: Thermo Fisher Scientific - Vibrational Spectroscopy
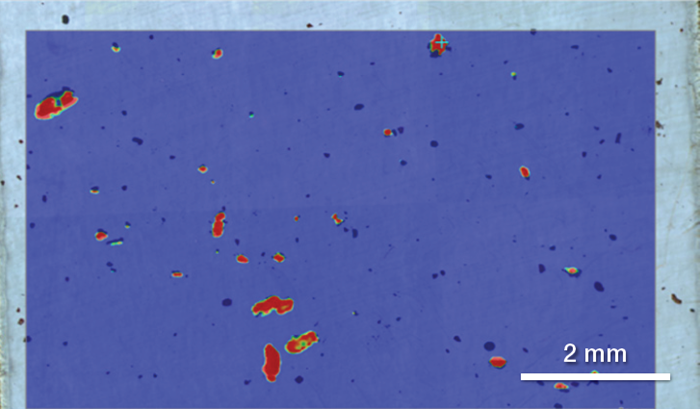
Figure 5. Silicon filter collected with microplastics analyzed with area mapping. Red regions are particles of PE correlated to the entire map. Image Credit: Thermo Fisher Scientific - Vibrational Spectroscopy
Chemical Mapping Method: Analysis of the Full Filter
In the chemical mapping approach, an infrared image is captured using the complete region of interest, in which every pixel contains an infrared spectrum; the entire filter can then be selected for mapping.
Alternatively, the user can select several regions of interest and then collect and analyze those individual regions. An example of a silicon filter is displayed in Figure 5, where the entire 10X10 mm area is mapped as a single map.
The regions that correlate to the polyethylene spectra are those highlighted in red. Figure 6 illustrates where multiregional mapping was performed on a gold slide. The correlation shown here is relative to polyethylene (PE).
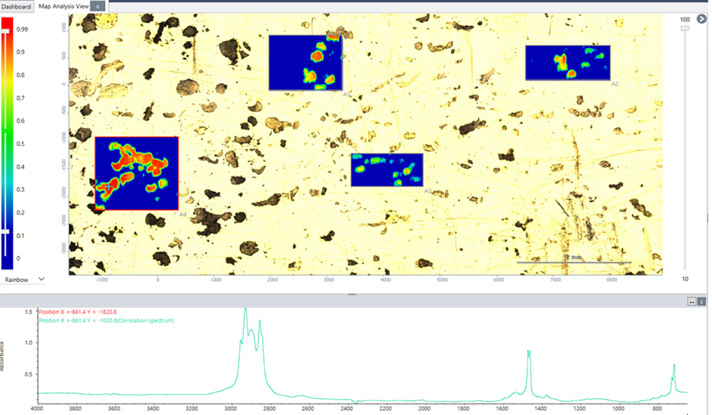
Figure 6. Reflective gold surface covered with microplastic particles. Four regions were selected for analysis. Regions highlighted. Image Credit: Thermo Fisher Scientific - Vibrational Spectroscopy
Chemical mapping can be applied to filters that possess particularly dense particle groupings or when there are extremely low-visual-contrast polymers on the surface of the filter.
It is also recommended to perform mapping analysis for fibers and films collected on filters. This type of chemical approach can also be used for a more comprehensive understanding of laminated film or degradation analysis of an environmentally exposed particle.
Conclusions
The Nicolet RaptIR FTIR Microscope and OMNIC Paradigm Software support microplastic analysis through automated particle-finding and analysis tools, combining visual imaging with infrared spectral analysis. The Thermo Scientific Nicolet RaptIR X FTIR Microscope, the latest addition to the Nicolet RaptIR FTIR microscopy platform, is now available, providing a current solution for FTIR microscopy and chemical imaging applications.
FTIR microscopy can provide information about particle identity, shape, and size, supporting investigations into microplastics and their characteristics in environmental samples.
References and Further Reading
- Rochman, C.M. and Hoellein, T. (2020). The global odyssey of plastic pollution. Science, 368(6496), pp.1184–1185. DOI:10.1126/science.abc4428. https://www.science.org/doi/abs/10.1126/science.abc4428.
- WHO (2019). WHO calls for more research into microplastics and a crackdown on plastic pollution. WHO. Available at: https://www.who.int/news/item/22-08-2019-who-calls-for-more-research-into-microplastics-and-a-crackdown-on-plastic-pollution.
- https://www.waterboards.ca.gov/drinking_water/certlic/drinkingwater/documents/ microplastics/mcrplstcs_ir.pdf.
- De Frond, H., Rubinovitz, R. and Rochman, C.M. (2021). μATR-FTIR Spectral Libraries of Plastic Particles (FLOPP and FLOPP-e) for the Analysis of Microplastics. Analytical Chemistry, 93(48), pp.15878–15885. DOI:10.1021/acs.analchem.1c02549. https://pubs.acs.org/ancham/article-abstract/93/48/15878/829992/ATR-FTIR-Spectral-Libraries-of-Plastic-Particles?redirectedFrom=fulltext.
- Cowger, W., et al. (2021). Microplastic Spectral Classification Needs an Open Source Community: Open Specy to the Rescue! Analytical Chemistry, 93(21), pp.7543–7548. DOI:10.1021/acs.analchem.1c00123. https://pubs.acs.org/ancham/article-abstract/93/21/7543/829664/Microplastic-Spectral-Classification-Needs-an-Open?redirectedFrom=fulltext.
- Hawaii Pacific University (2019). CMDR | Home. Available at: https://www.hpu.edu/cncs/cmdr/.

This information has been sourced, reviewed, and adapted from materials provided by Thermo Fisher Scientific - Vibrational Spectroscopy.
For more information on this source, please visit Thermo Fisher Scientific - Vibrational Spectroscopy.