Exceptional events can cause temporary yet significant increases or decreases in ambient fine particulate matter (PM2.5) concentrations.
Under U.S. regulatory definitions, an exceptional event refers to an event and its associated emissions that can be clearly linked to an observed exceedance or violation; cannot reasonably be controlled or prevented; and arises from either a natural event or an unusual human activity that is unlikely to recur at that specific location.
Exceptional events are formally determined by the U.S. Environmental Protection Agency (EPA) under 40 CFR 50.14.1
Wildfires, wind-blown dust, prescribed burns, and volcanic eruptions are examples of events that may meet these criteria.2 However, a period of elevated pollution does not, by itself, qualify as an exceptional event.
Such episodes may also alter the chemical makeup and physical characteristics of airborne particles. These changes can influence how strongly particles scatter light relative to their mass.
The Thermo Scientific™ 5030iQ SHARP (synchronized hybrid ambient real-time particulate) Monitor pairs light-scattering nephelometry with beta attenuation to address this issue.
The nephelometer responds quickly to concentration changes, whereas beta attenuation supplies a mass-based measurement that can be used to calibrate the optical signal, enabling high-time-resolution PM2.5 monitoring.3,4,5
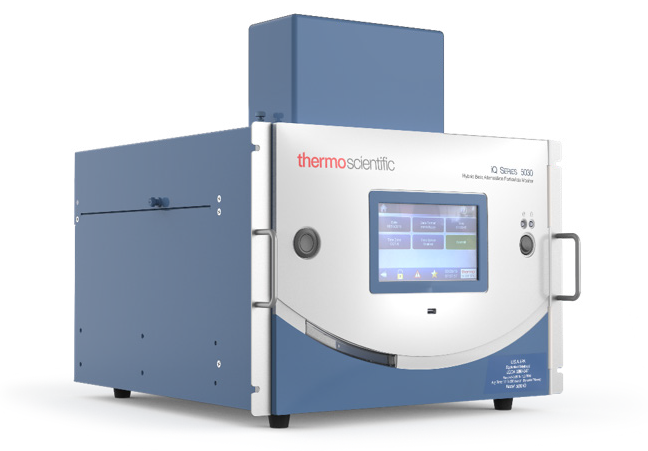
Thermo Scientific 5030iQ SHARP Monitor. Image Credit: Thermo Fisher Scientific – Environmental and Process Monitoring Instruments
Why Changing Aerosols Challenge Optical PM2.5 Measurements
A nephelometer infers particle concentration from the light scattered by particles passing through the sample stream. Although this approach delivers rapid, time-resolved data, the amount of scattered light is not governed solely by particle mass. Instead, it also depends on aerosol characteristics including size distribution, refractive index, density, and particle morphology.3
Humidity and particle chemistry can modify scattering further through hygroscopic growth. When particle composition or water uptake shifts, relying on a fixed relationship between optical signal and mass may produce bias. Such effects become especially important during smoke, dust, and other episodic conditions, when aerosol properties can depart from those normally observed in the local atmosphere.4
SHARP Technology: Rapid Response with Mass-Based Calibration
The 5030iQ SHARP Monitor brings together two complementary measurement approaches within one instrument. Its nephelometer detects changes in particle concentration quickly and sensitively, while its beta attenuation system provides an independent mass-based measurement.
The optical signal is periodically calibrated against the beta attenuation mass concentration, thereby reducing reliance on a fixed optical-to-mass relationship without sacrificing fast response.5
This design matters when aerosol characteristics are changing. Rather than treating the optical measurement as a standalone estimate of mass, SHARP technology uses the beta-based measurement as a reference against which the nephelometric response is calibrated. The 5030iQ SHARP Monitor can report mass concentrations over averaging periods starting at 60 seconds, with output recorded every second.5
Field studies of the earlier 5030i SHARP Monitor support the hybrid measurement concept. In a multi-year investigation in Ontario, Canada, researchers observed high data completeness and close agreement between 24-hour SHARP results and filter-based measurements.
In another study conducted in Fort McMurray, Canada, no statistically significant difference was detected between 24-hour SHARP and Federal Reference Method averages, and the two approaches agreed closely during elevated PM2.5 episodes linked to forest fires.6,7
Note: These studies examined the earlier 5030i SHARP Monitor, not the current 5030iQ model. They provide support for the SHARP measurement approach, but they should not be viewed as direct assessments of 5030iQ performance during a particular exceptional event.
Application During Exceptional Events
Monitoring during exceptional events may require a system capable of tracking both rapidly varying PM2.5 concentrations and evolving aerosol characteristics. The SHARP approach is suited to these conditions because it integrates a fast optical measurement with an independent mass-based beta-attenuation measurement.5
- Rapid concentration changes: High-time-resolution data helps document brief increases, peaks, and declines that can accompany smoke, dust, and related episodic events.
- Changing aerosol properties: Calibration of the nephelometric signal against beta attenuation reduces dependence on the assumption that one optical-to-mass relationship applies across all aerosol conditions.
- Simultaneous changes: The hybrid design is especially valuable when concentration and aerosol characteristics change together, because it provides both temporal detail and mass-based information in a single system.
U.S. EPA Federal Equivalent Method Designation
The 5030iQ SHARP Monitor is covered by U.S. EPA Automated Equivalent Method designation EQPM-0609-184 for PM2.5 measurement, provided it is operated in the configuration and under the conditions established by the EPA. 8
The designation applies to 24-hour average PM2.5 measurements and specifies the necessary inlet, particle separator, flow rate, and operating procedures. Although high-time-resolution outputs can add temporal detail, users should adhere to the applicable FEM designation and the instrument operating manual when conducting regulatory monitoring. 8
Conclusion
Exceptional events can complicate PM2.5 monitoring because both particle concentrations and aerosol properties may shift rapidly and simultaneously. Optical measurements offer useful temporal resolution, but the relationship between their signal and particle mass can change as aerosol characteristics vary.3,4
By combining light-scattering nephelometry with beta attenuation, the 5030iQ SHARP Monitor calibrates its optical response against a mass-based reference. This hybrid design enables rapid PM2.5 measurements while reducing reliance on a fixed optical-to-mass relationship, making it a strong choice for monitoring PM2.5 conditions that change rapidly or vary in composition.5
References and Further Reading
- eCFR. 40 CFR 50.14 -- Treatment of air quality monitoring data influenced by exceptional events. Available at: https://www.ecfr.gov/current/title-40/chapter-I/subchapter-C/part-50/section-50.14.
- US EPA. (2023). Treatment of air quality monitoring data influenced by exceptional events | US EPA. Available at: https://www.epa.gov/air-quality-analysis/treatment-air-quality-monitoring-data-influenced-exceptional-events.
- Tryner, J., et al. (2019). Variation in gravimetric correction factors for nephelometer-derived estimates of personal exposure to PM2.5. Environmental Pollution, 250, pp.251–261. DOI:10.1016/j.envpol.2019.03.121. https://www.sciencedirect.com/science/article/abs/pii/S0269749119302957.
- Ren, R., et al. (2021). Measurement report: The effect of aerosol chemical composition on light scattering due to the hygroscopic swelling effect. Atmospheric Chemistry and Physics, 21(13), pp.9977–9994. DOI:10.5194/acp-21-9977-2021. https://acp.copernicus.org/articles/21/9977/2021/.
- Thermofisher. (2026). 5030iQ SHARP monitor. Available at: https://www.thermofisher.com/order/catalog/product/5030IQ.
- Su, Y., et al. (2018). Multi-year continuous PM2.5 measurements with the federal equivalent method SHARP 5030 and comparisons to filter-based and TEOM measurements in Ontario, Canada. Atmosphere, 9(5), pp.191–191. DOI:10.3390/atmos9050191. https://www.mdpi.com/2073-4433/9/5/191.
- Hsu, Y.-M., et al. (2016). Collocated comparisons of continuous and filter-based PM2.5 measurements at Fort McMurray, Alberta, Canada. Journal of the Air & Waste Management Association, 66(3), pp.329–339. DOI:10.1080/10962247.2015.1136362. https://www.tandfonline.com/doi/full/10.1080/10962247.2015.1136362.
- United States Environmental Protection Agency (2026). List of designated reference and equivalent methods. [Air monitoring methods] Research Triangle Park, NC: United States Environmental Protection Agency. Available at: https://www.epa.gov/system/files/documents/2026-07/amtic-list-july-2026_508-compliant.pdf.

This information has been sourced, reviewed, and adapted from materials provided by Thermo Fisher Scientific – Environmental and Process Monitoring Instruments.
For more information on this source, please visit Thermo Fisher Scientific – Environmental and Process Monitoring Instruments.