Suspensions may be acceptably stable to sedimentation for two reasons. Either the bulk material has a yield stress high enough to hold the particles in suspension, or the material has a ‘zero shear viscosity’ high enough that sedimentation occurs in an acceptably slow manner (A & B).
If a material has a yield stress but a weak gel structure, the sample may still give sedimentation during transportation and handling. The stability of the suspension therefore needs to be measured (C).
A – Materials With a Yield Stress
Sufficient yield stress may prevent sedimentation, as the downward stress exerted by a spherical particle in dilute suspension is given by:
σs = rg (d-ρ) / 3
Thus, if the material has a yield stress greater than σs the sample should resist sedimentation, providing the structure is stable to vibrations that may arise during transportation and handling.
B - Materials with a Zero Viscosity
Experimental: determining zero shear viscosity
Geometry: Cone and plate 1º/60 mm
Table of Shears:
Shear rates: 0.01 - 50 S-1 / down / log (plot Viscosity vs. stress)
Gap: 30 µm
Delay time: 15 Seconds proportional to strain
Integration time: 30 Seconds
Stokes Law gives the sedimentation velocity in a suspension:
Vs = 2 r2 g (d-ρ) / 9 η0
The sedimentation velocity can then be used to calculate the time that a particle will take to reach the bottom of the container. If this takes longer than the acceptable limits for the application, the formulation can be considered to be stable. Also, the shear rate of a falling particle can be calculated from the following formula:
Shear ratemax = 3 Vs n0 / 2r
These formulas describe ideal systems and the assumptions made are that the particles are spherical, uncharged and in a dilute suspension.
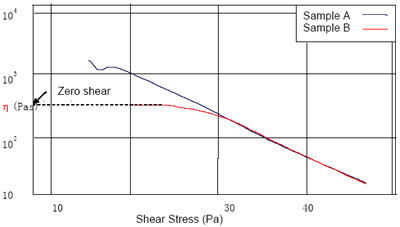
However the results obtained from a zero shear viscosity test can give an indication of sedimentation time. The results (Figure 1) show that Sample B’s viscosity reached a plateau and the value at zero shear can be extrapolated easily. Sample A did not reach a plateau in this experiment and the viscometry data became slightly less accurate at extremely low shear rates. This low shear area can be further investigated by running creep tests.
Creep Testing To Find The Zero Shear Viscosity
Creep
Shear stress: where the curve needs extending
Geometry: Cone & plate 1º/60 mm
Creep time: 600 seconds

Figure 1. Zero shear value can be easily extrapolated after viscosity reaches a plateau.
Interpretation
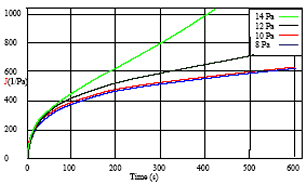
Successively lower stress creep experiments are conducted until the creep compliance curves start to overlay each other (Figure 2).
When this occurs and the test is run until the sample is at steady state, the viscosity value given in the creep results box is the zero shear viscosity. It may be necessary to renew the polymer sample if it starts to degrade during the testing. However, the sample life may be extended by gently passing nitrogen gas around the measuring system.

Figure 2. Successively lower stress creep experiments are conducted until the creep compliance curves start to overlay each other.

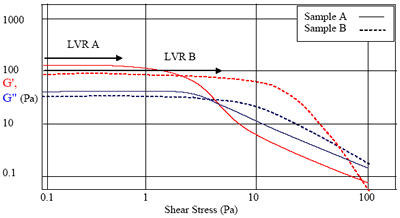
Figure 3. Moduli are initially independent of stress, giving a plateau known as the linear viscoelastic region (LVER).
C - Measurement of Suspension Stability
Geometry: Cone and plate system 4º/40 mm with a solvent trap system
Temperature: 25ºC
Stress amplitude sweep: 0.1 - 100 Pa Up Logarithmic
In this experiment, the sample is oscillated with an increasing stress known as an amplitude sweep and the storage and loss moduli are plotted against the shear stress (Figure 3).
The moduli initially are independent of stress, giving a plateau known as the linear viscoelastic region (LVER). The length of the linear viscoelastic region shows how far the material can be deformed before the onset of structure breakdown.
Interpretation
Sample A evidently has a much shorter linear viscoelastic region than sample B and may therefore be expected to break down much more easily with vibrations and small movements.
Conclusion
A relatively quick amplitude sweep experiment can probe the microstructure of the sample indicating the dispersion stability of a suspension (solid in liquid).
The length of the linear viscoelastic region can also show energy absorption by interfacial interactions and is therefore, also a good indication of the stability of an emulsion to resist synuresis (where a layer of the one component forms on the surface of the mixture, e.g. oil in water). The amplitude sweep results can be used to eliminate many unstable formulations without the need for storage testing.
Measurement Conditions:
Samples: any dispersion system used for coating
Geometry: Cone and plate system 4º/40 mm with a solvent trap
Temperature: 25ºC
Frequency sweep: 10 - 0.l Hz
Strain: 0.010
.png)
This information has been sourced, reviewed and adapted from materials provided by Malvern Panalytical.
For more information on this source, please visit Malvern Panalytical.